Abstract
A novel method based on interleaved localized 31P- and 1H MRS is presented, by which lactate accumulation and the accompanying changes in high energy phosphates in human skeletal muscle can be monitored simultaneously during exercise and recovery. Lactate is quantified using a localized double quantum filter suppressing the abundant lipid signals while taking into account orientation dependent signal modulations. Lactate concentration after ischemic exercise directly quantified by DQF 1H spectroscopy was 24±3 mmol/L cell water, while 22±3 mmol/L was expected on the basis of 31P MRS acquired simultaneously. Lactate concentration in a sample of porcine meat was estimated to be 40±7 mmol/L by means of DQF quantitation, versus 39±5 mmol/L by biochemical methods. Excellent agreement is shown between lactate concentrations measured noninvasively by 1H MRS, measured biochemically ex vivo, and inferred indirectly in vivo from changes in pH, Pi, and PCr as obtained from 31P MRS data.
Keywords: proton MRS, phosphorus MRS, lactate, human skeletal muscle, exercise
31P magnetic resonance spectroscopy (MRS) has long been used to study cellular energy metabolism in vivo, paradigmatically in skeletal muscle, where the wide dynamic range is both an experimental opportunity and an important problem of metabolic regulation (1–3). In addition to exercise science and primary muscle disorders, muscle function is important in aging and chronic diseases. The muscle exercise response has analogies to brain activation of interest in functional neuroimaging. The major disadvantage of 31P MRS compared to needle biopsy has been the inability to quantify lactate directly. This has necessitated indirect 31P MRS approaches (4) to important [and still much debated (5–7)] issues in the control of glycolysis (5,8) and cellular acid handling (4,7,9–11) in vivo. There are several technical obstacles to quantifying lactate in vivo by 1H MRS, particularly overlapping lipid resonances (at 0.5–1.5 ppm) and orientation-dependent dipolar coupling effects which reduce lactate visibility. These necessitate techniques to selectively acquire the lactate resonances while suppressing the strong background signals. Here, we describe an interleaved 31P- and 1H MRS method by which lactate accumulation and the accompanying changes in phosphorus metabolites can be monitored simultaneously in a well-defined gradient localized VOI positioned in a muscle during exercise and recovery (12). Also interleaved is a standard 1H STEAM pulse sequence (13), to monitor extra- and intramyocellular lipid (which becomes depleted in exercise of longer duration than that described here), TMA, and total creatine. The results advance present knowledge of muscle cellular acid-base metabolism and open the way for much more detailed studies of this and the control of glycolysis.
Methods
Subjects
Healthy subjects (n = 7) executed ischemic plantar-flexion on a pedal ergometer (13) at 50% MVC (measured prior to MRS, under aerobic conditions) until fatigue, 2 min 20 sec, on the average. Written informed consent to the protocol, which was approved by the local ethics committee, was obtained from all volunteers. Ischemia in the lower leg was induced by inflating a pneumatic cuff. Control of the cuff pressure was given over to the volunteers themselves, to enhance compliance. To ensure fully ischemic exercise, subjects were instructed to inflate the cuff to 230 mm Hg (i.e., well above the systolic blood pressure) 2 min before commencing plantar flexion exercise, to maintain constant cuff pressure, and to deflate the cuff after an ischemic postexercise period as long as the subjects would tolerate. On average, postexercise ischemia lasted 4 min 20 sec. Subjects were instructed to confine exercise to periods without RF excitation and reception, i.e., not to exert force on the pedal during and shortly after gradient noise, in order to reduce calf motion during acquisition. Force on the pedal and its angle were measured using sensors and were recorded continuously along with the NMR sequence timing (13).
MRS Methods
A protocol for interleaved acquisition of double quantum filtered (DQF) localized MR spectra of lactate and of STEAM localized 1H- and 31P spectra during exercise was implemented and extensively tested on solutions and meat specimens on a 3 T Bruker Medspec whole-body NMR scanner (Bruker Biospin, Ettlingen, Germany), similar to the nonlocalizing sequence described in (12,14), but with short echo times, to account for dipolar coupling of lactate in muscle tissue. All 1H and 31P RF pulses were transmitted and signal was received using a standard double-tuned 10-cm surface coil.
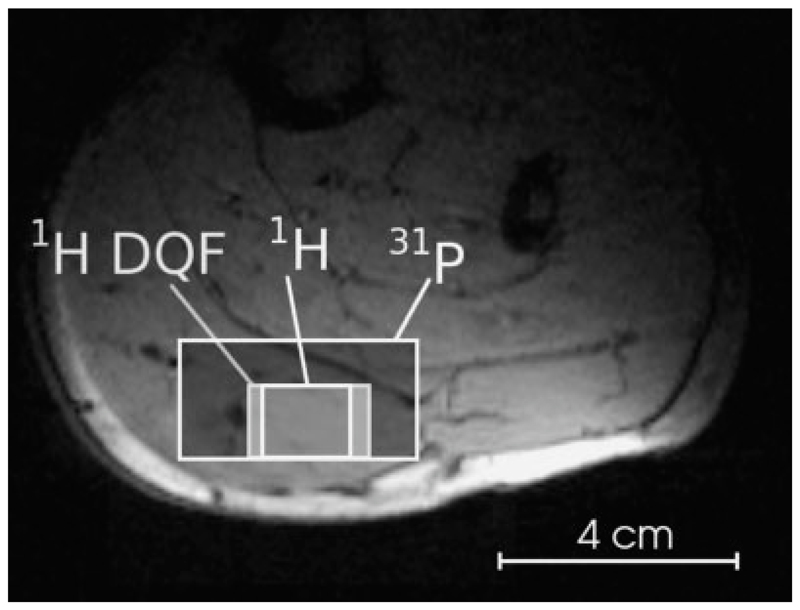
The volumes of interest (VOI) for the three interleaved MRS protocols were positioned in the gastrocnemius muscle (Fig. 1), as plantar flexion exercise with a straight knee activates primarily this muscle (15,16).
Fig. 1.
Position of the volumes of interest for interleaved localized DQF and multinuclear STEAM spectroscopy in a subject’s gastrocnemius muscle. Localized DQF for lactate detection: nominal voxel size V = 6.0 cm3, 1H STEAM: V = 3.6 cm3, 31P STEAM: V = 40 cm3.
The size of the nonisotropic voxels was adapted individually to exclude bulk fat and large blood vessels. The voxels were between 2.6 and 6 ml for 1H MRS (DQF and STEAM) and varied between 32 and 50 ml for 31P STEAM. Different VOIs were chosen for the respective nuclei to compensate for the lower sensitivity of phosphorus and to obtain suffciently narrow line widths (of ≲15 Hz), to allow separation of metabolite resonances and to exclude EMCL contributions to 1H spectra from bulk fat in the muscle.
Within each full cycle of the interleaved sequence (see Fig. 2), one 31P STEAM, one 1H STEAM, and two localized DQF acquisitions were performed, yielding effective repetition times of 7.6 sec for 31P spectra, 1.6 sec for 1H STEAM and 3 sec for the double quantum filtered lactate, to optimize SNR for the different nuclei. 1H and 31P STEAM spectra were acquired with a short TE = 7.48 msec and TM = 30 msec, employing sinc3 pulses (i.e., sinc shaped, truncated to three lobes) with a duration of 1500 µsec and a resulting excitation bandwidth of 3.7 kHz. Contamination by signals arising from outside the nominal STEAM voxel was estimated previously (17), using the same pulses, TE and TM and was found to be 3% or less.
Fig. 2.
Schematic of the interleaved sequence, comprising a localized double quantum filter sequence for lactate detection and STEAM sequences for acquiring localized 31P and 1H MR spectra. The DQF part is repeated m = 2 times before each 31P and 1H STEAM acquisition to increase SNR of edited lactate. The 31P duty cycle is limited by the long T1 relaxation time of phosphorus metabolites. For clarity, spoiler gradients, RF channels, gradient directions, and exact timings are not shown.
The double quantum filter for selective lactate detection is the first element of the interleaved pulse sequence shown in Fig. 2. The first three pulses, 90°–180°–90° with the delay of 1/2 J, convert the single quantum magnetization of the coupled spin systems into a mixture of zero-quantum and double-quantum coherences, which are invisible. The subsequent frequency selective 90° pulse changes the multiquantum coherence of a selected spin system into antiphase magnetization, which is refocused during 1/2 J (the last 180° pulse eliminates evolution due to the chemical shift). The double quantum coherence pathway is selected by cycling phase of the selective pulse and the receiver, and by the 1:2 spoiling gradients. Three of the two 90° and two 180° pulses can be used as slice selective (the use of the frequency selective 90° pulse as slice selective is difficult). For efficient excitation of the multiple quantum coherences, it is practical to apply the second 90° pulse nonselective and as short as possible. For DQF, the nominal voxel size was chosen larger than the 1H STEAM voxel, to gain higher SNR at an expected cost of increased line width, which was considered acceptable in spectra with only a single resonance (i.e., the lactate CH3 signal) passing the double quantum filter. The duration of the spatially selective sinc3 pulses was 1725 msec (excitation) and 1250 msec (inversion), respectively. The DQF sequence is combined with an adiabatic fat inversion pulse (a hyperbolic secant pulse, 15 msec duration, TIR = 208 msec) to improve suppression of the abundant lipid signals underlying the lactate resonance at 1.3 ppm (see Fig. 2). In contrast to brain tissue, where the lactate’s CH3 doublet can be observed at TE = 144 msec using standard MRS pulse sequences, as the scalar coupling constant is J = 6.93 Hz (18) and the resonance is not obscured by lipid signals, the situation in muscle is somewhat more complex. Here, additional dipolar coupling causes an orientation-dependent modulation of the DQF signal according to Eq. [1] (19). The observed splitting (20) for a spin system with both dipolar (Δdc) and scalar (J = ΔHH) coupling (i.e., the pool exhibiting dipolar coupling effects) corresponds to the algebraic sum Δ = ΔHH + Δdc (21).
Allowing for lactate’s short (T2s) and long (T2l) components of transverse relaxation (19,22) shortens the optimum echo time (TE = τ1 + τ2) significantly, compared to tissues not exhibiting dipolar coupling (e.g., brain).
| [1] |
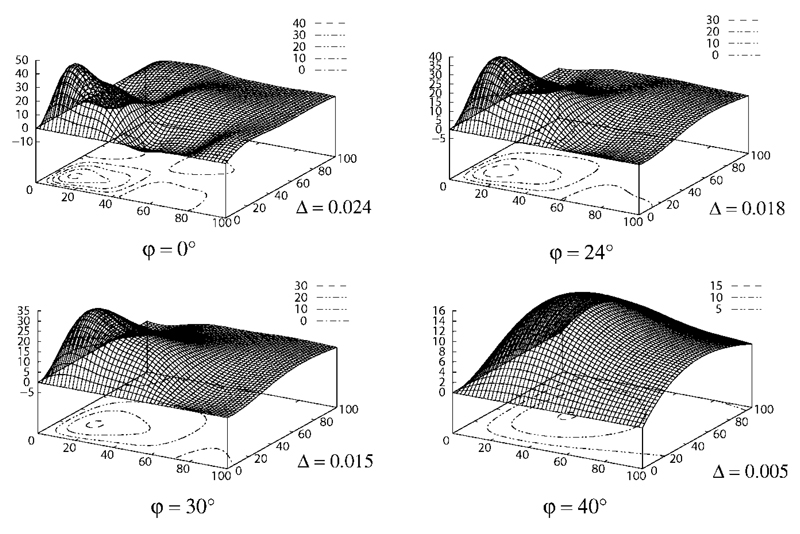
Figure 3 shows simulations of the methyl lactate signal measured with the DQF sequence (Fig. 2) as surface and contour plots with τ1 and τ2 on the abscissae. Four exemplary fiber orientations, which may occur in muscle tissue when the limb is placed parallel to the magnet, are shown: φ = {0°, 24°, 30°, 40°} (parallel orientation, φ = 0°, being the least realistic). As can be seen in Fig. 3, the maximum signal decreases with increasing angle φ.
Fig. 3.
Simulation of the lactate methyl signal S(τ1, τ2, φ) acquired with the DQF sequence (see Fig. 2) as given in Eq. [1] against τ1, τ2 with the muscle fiber orientation φ relative to B0 as parameter. Note that the peak signal amplitude decreases and the peak moves towards longer echo times (τ1, τ2) as the angle φ between muscle fiber orientation and the orientation of the main magnetic field B0 increases. Contours are plotted for signal levels (a.u.) in steps of 10. Also note the different scale of each graph. For more details see text.
A fiber orientation of φ = 0° would, hypothetically, give maximum signal intensity, provided sequence timings are appropriate (τ1 = 10 msec, τ2 = 20 msec). Indeed, the orientation of fibers varies between muscles, muscle types and, to a lesser extent, also across a single muscle itself. The case of muscle fibers being parallel to B0 is especially unlikely for the pennated gastrocnemius muscle, where fibers are oriented at c. 24°–35° relative to B0, if the leg is parallel to the magnet bore (23). Maximum signal for gastrocnemius muscle with φ = 24° is obtained with τ1 = 15 msec, τ2 = 22 msec. Considering the range of orientations given in (23), a more perpendicular orientation appears more realistic, also e.g., due to deformation of the muscle by strapping the calf to the ergometer and the RF coil. The sequence timing used during the plantar flexion exercise experiments was τ1 = 25 msec, τ2 = 32 msec which yields maximum signal for φ ≈ 33°.
This setup was not only considered to yield optimum DQF signal intensity but is also advantageous with regard to minimization of systematic error introduced by uncertainty in fiber orientation: if the minimum fiber orientation angle expected in gastrocnemius, φ = 24°, is assumed, a ±10° deviation in actual angle results in a signal drop of 25%. In contrast, if φ = 33° is assumed, a ±10° deviation variation results in a signal variation of only 7% and 15%, respectively. A source of error on the order of 10–15% (or possibly less) seems acceptable, given the inaccuracy of other relevant parameters, and the fitting error of NMR spectra with low SNR, which was then found to be 15%, on average (standard deviation of the AMARES fit). An inaccuracy of 25%, however, as would be the case for a very short echo time tuned to an angle assumed to be 24°, may easily become the dominating factor of total measurement error.
Quantification
A phantom replacement technique (24) was used for absolute quantification, using test objects filled with lactate solutions (25 and 50 mmol/L) matching the coil load of an in vivo measurement and a small vial below the surface coil as an external reference to estimate coil sensitivity. Absolute lactate concentrations were calculated using muscle fiber orientation, the compartmentation ratios (a, b), and relaxation times (T1 and T2) of Eq. [1] as given in (19), and back-calculation factors to account for differing voxel sizes, receiver gains, and number of averages in muscle and phantom.
To verify the lactate absolute quantification process, first the results using fresh porcine gastrocnemius were compared with those of standard biochemical assay (measured several times before and after MRS to ensure stable conditions). Second, the results in vivo during ischemic exercise were compared with indirect estimates using 31P MRS data.
Cytosolic concentrations of inorganic phosphate (Pi) and phosphocreatine (PCr) were calculated from relaxation corrected 31P MRS measurements of PCr/ATP and Pi/ATP at rest (assuming ATP concentration of 8.2 mmol/L cell water (2)), with exercise induced changes of inorganic phosphate (Pi) and phosphocreatine (PCr) obtained by proportion of peak areas obtained using a time domain fit of spectra (i.e., AMARES (25), incorporated in the jMRUI software package (26)). Cytosolic pH was obtained from the chemical shift of Pi (2). Cytosolic (lactate) was calculated from 1H MRS measurements (also using AMARES) assuming muscle density of 1.04 kg/L and cytosolic water content of 0.66 L/kg (27). For comparison, expected (lactate) was calculated from pH, Pi, and PCr changes by summing the protons consumed by net hydrolysis of PCr (28) and buffered by Pi and non-Pi buffers (4). The latter was assumed to represent 20 slykes at rest increasing 55 slykes/unit as pH falls, with figures derived indirectly from a 31P MRS analysis of ischemic forearm exercise (4). Lactate concentration in fresh porcine gastrocnemius was measured by standard biochemical methods several times before and after MRS to ensure stable conditions. Results are given as mean ± SEM.
Results
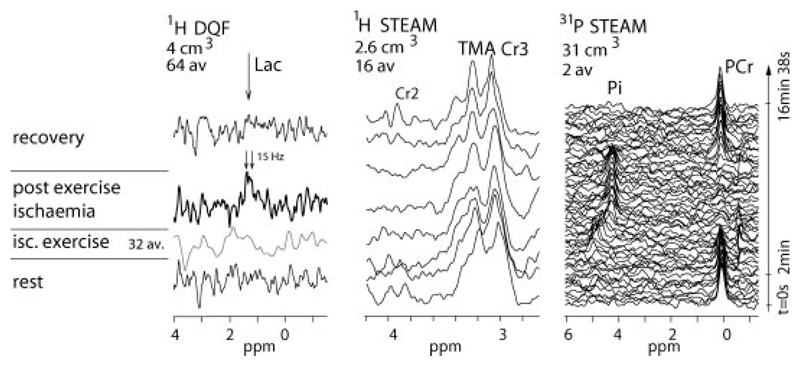
Lactate concentration was 40 ± 7 mmol/L muscle in porcine gastrocnemius muscle ex vivo, close to the biochemical measurement of 39 ± 5 mmol/L. In triple-interleaved MRS experiments (spectra shown in Fig. 4), ischemic exercise resulted in a PCr decrease to 18% ± 3% (n = 7) of resting value of 33 ± 2 mmol/L cell water and a pH decrease of 0.47 ± 0.06 below the resting value of 7.06 ± 0.03 (note the evident shift of Pi in Fig. 4, right side). Based on the earlier analysis of ischemic exercise in forearm muscle (5) (see Methods), this corresponds to an expected lactate concentration of 22 ± 3 mmol/L cell water. In good agreement, the lactate concentration quantified directly by localized double quantum filtered spectroscopy data acquired during postexercise ischemia (Fig. 4, left side) was 24 ± 3 mmol/L cell water. To put this match between theory and observation another way, the overall (all-exercise mean) buffer capacity calculated from the observed changes in pH and the concentrations of PCr, Pi, and lactate (i.e., the ratio of the net proton load added to the cytosolic buffers to the observed fall in cell pH (5)) was 43 ± 7 mmol/L cell water per pH unit, in close agreement with the value of 43 ± 7 mmol/L calculated from 31P MRS data alone making the assumption that non-Pi buffer capacity behaves as in ischemic exercise in forearm muscle (5). The lactate concentrations obtained by DQF MRS absolute quantitation and other approaches in vivo and in meat specimen are subsumed in Table 1.
Fig. 4.
Representative localized DQF lactate spectra with short (57 msec) echo time (64 averages/spectrum, 4 cm3), 1H STEAM (16 av., 2.6 cm3) and 31P STEAM (2 av., 31 cm3) spectra, all acquired in a single interleaved experiment on human gastrocnemius. For more details see Figs. 5 and 6.
Table 1.
Lactate Absolute Concentrations in Human Calf After Ischemic Exercise and in Porcine Meat, by MRS Absolute Quantification, Indirectly via 31P MRS and by Biochemical Assay
| [Lac] /mmol/L | Human in vivo (postexercise) | Meat specimen (ex vivo) |
|---|---|---|
|
1H DQF measurement inferred from 31P MRS biochemical assay |
24 ± 3 22 ± 3 |
40 ± 7 39 ± 5 |
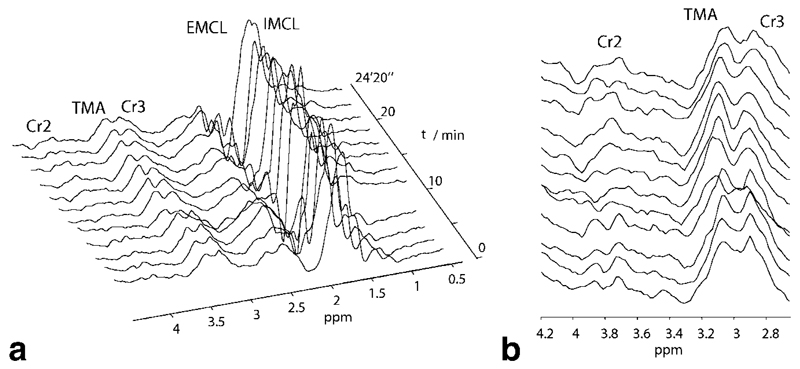
A distinct drop of only the CH2 resonance of creatine is seen in the 1H STEAM spectra (Fig. 4, center) during ischemic exercise and during postexercise ischemia (similar to the findings in (29) and (13)).
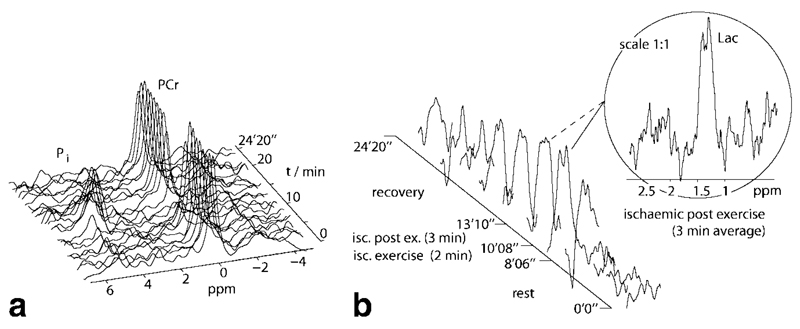
Figures 5 and 6 show time series of spectra acquired during a single interleaved measurement in more detail.
Fig. 5.
Spectra of human gastrocnemius muscle acquired during plantar flexion exercise in an interleaved experiment. (a) 31P STEAM spectra show the PCr/Pi time course. The time resolution for this stack of spectra is 1 min. (b) Series of localized DQF with a time resolution of 2 min. The spectrum in the insert shows the lactate resonance, summed over the ischemic postexercise period (3 min, corresponding to the 6th and part of 7th spectrum in the time series) as it was used for lactate absolute quantification.
Fig. 6.
1H STEAM spectra acquired during plantar flexion exercise in an interleaved experiment. (a) Full spectral range of metabolites. Note that the EMCL/IMCLs at 1.3 ppm are not increased during exercise, e.g., because of motion, and thus the peak observed in DQF spectra is unlikely to be due to lipid contamination. (b) Zoomed-in spectral region showing creatine CH2 and CH3 resonances and TMA. (31P spectra and DQF lactate spectra of the same experiment shown in Fig. 5).
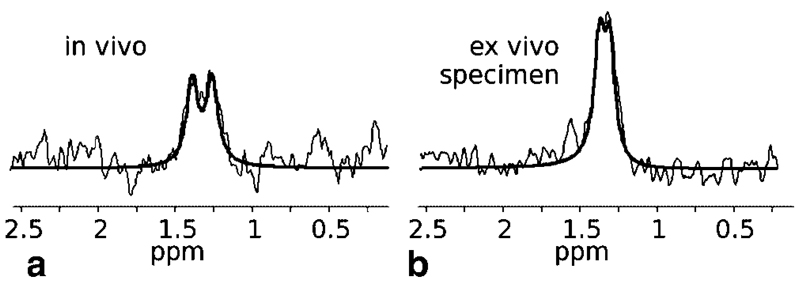
In Fig. 5 b, the lactate CH3 resonance can be observed as a doublet with 15 Hz line splitting, (caused by scalar and orientation-dependent dipolar coupling). The signal accumulates during ischemic exercise, persists during the resting period after exercise while the cuff is inflated and ischemia is maintained, concomitantly with PCr depletion and Pi accumulation (Fig. 5 a), and finally decays back to noise level after deflation of the cuff. Fit results for lactate absolute quantification (data from the same subject as in Figs. 5 and 6) are shown in Fig. 7.
Fig. 7.
Result of the spectral fit of lactate using jMRUI. Data were acquired with the localized double quantum filter (a) in human calf muscle in vivo after ischemic exercise and (b) in porcine meat ex vivo. For display, exponential line broadening of 10 Hz and zero filling to 4 k points was applied.
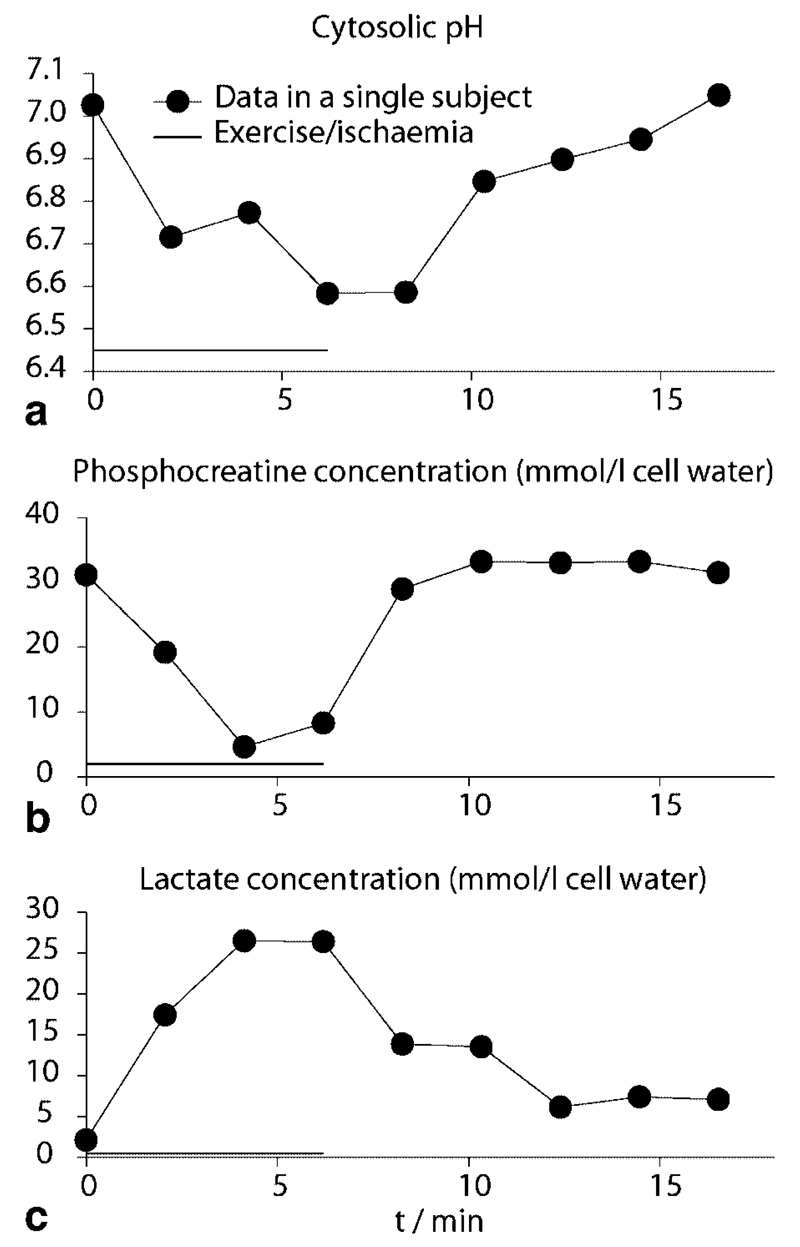
A time course of lactate accumulation, pH, and PCr depletion during and after exercise and ischemia is given in Fig. 8.
Fig. 8.
Lactate accumulation, pH, and PCr depletion during and after exercise and ischemia. Solid lines are to guide the eye only. Exercise/ischemia duration (c. 6 min) is indicated by the horizontal bar.
Neither the lipid resonances nor the creatine or TMA peaks in Fig. 6 show a variation in intensity which would indicate the lactate resonance in Fig. 5 b to be significantly contaminated by lipid signals due to exercise induced motion.
The lactate resonance is most prominent after exercise and decays back to noise level during the recovery period, when there is no motion of the leg at all. The decrease of the creatine CH2 resonance during exercise is also visible in Fig. 6 b.
Discussion and conclusions
The novel method gives an excellent fit both to biochemically measured lactate concentration in porcine gastrocnemius and to the lactate concentration in human calf muscle expected on the basis of changes in pH, Pi, and PCr. As the latter calculation uses cytosolic buffer capacity based on an indirect analysis of proton handling in ischemicaly exercising forearm muscle, the agreement supports both the present method and the analysis of the forearm data (4). Also, because of the localized measurement of 31P metabolites, the acquired data are more specific for the exercised muscle compared to surface coil experiments without further localization of the volume of interest. Finally, the larger amount of complementary information obtained from this triple interleaved experiment may be useful to study more subtle differences or specific changes in various physiological and pathological conditions.
In addition to allowing detailed studies of lactate vs. pH recovery currently not possible by any other means, the methods described here could be used to define possible changes in cytosolic buffering capacity with, e.g., training state and disease. There have been a number of studies of the effects of training on muscle buffer capacity (30–32), albeit using biopsy techniques which have generally not been able to distinguish between proton buffering and ‘consumption’ via the creatine kinase reaction (4,5,7). There have been very few studies in disease (an exception being some early studies in McArdle’s disease (33)). Although estimates of buffer capacity can be made from initial-exercise measurements of pH and PCr only (9), it is technically difficult to ensure that measurements are early enough to exclude significant contribution by glycolysis, so that the initial increases in pH are large enough in all subjects to make the calculation (which is based on the initial ratio of PCr decrease to pH increase) possible without risking mathematical nonsense (zero or negative pH change) or unstable error distributions (very small positive pH changes) (9). It is in principle preferable to correct for lactate changes rather than assume them to be zero, and although quantifying small changes is not a trivial problem, the present method opens this possibility. Furthermore, there is no way to define the pH-dependence of cytosolic buffer capacity, which is very little studied in vivo, using initial-exercise measurements of pH and PCr. To do this requires either lactate measurements (which the present method offers) or else indirect approaches which necessarily make assumptions about the constancy or otherwise of contractile efficiency (4). The present results show an encouraging agreement between the results of such direct and indirect approaches. However, there is essentially no information about how the pH-dependence of cytosolic buffer capacity (as distinct from its resting value) might change with, e.g., training state and disease. A possible limitation of our study is that we obtained pH from the Pi-PCr shift alone. Although this approach has been very common in 31P MRS muscle studies for many years, more sophisticated approaches are available which take into account interactions between free [Mg2+] and the chemical shifts of Pi and β-ATP (34,35). However, as our key aim was to compare direct lactate measurements with the results of a published indirect analysis of 31P MRS data (4), it would have introduced at least some bias into this comparison to use a different pH method in the present work to the simple Pi-PCr shift method used in the earlier study. In effect, any biases in this simple method cancel out in the comparison between the two studies.
To gain maximum SNR for 31P, the voxel size was increased to cover as much of the gastrocnemius muscle without incorporating subcutaneous fat with a maximum side length of 5 cm, smaller than the diameter of the surface coil (d = 10 cm). The length in the direction perpendicular to the coil was limited to 2.5 cm. For the localizing DQF, we limited the volume of interest first to minimize deviations from the nominal flip angle of the 90° and 180° pulses excited by the surface coil, for efficiently creating double quantum coherences and second to allow the voxel to be placed so as to exclude EMCL contributions from bulk fat between the muscle heads. The effect of the transient regions defined by one slice selective 90° pulse and two slice selective 180° pulses on the lactate system has been studied by Yablonskiy (36). Our double quantum filter (an add/subtract scheme combined with the 1:2 ratio spoiling gradients) removes efficiently all single quantum coherence pathways, except those incompletely cancelled because of motion. Of course, some loss of the signal can be expected because of imperfect 180° pulses produced by the surface coil. The 1H STEAM volume was selected even smaller than the DQF voxel, to obtain sufficiently narrow lines to be able to discern IMCL from EMCL and Cr from TMA.
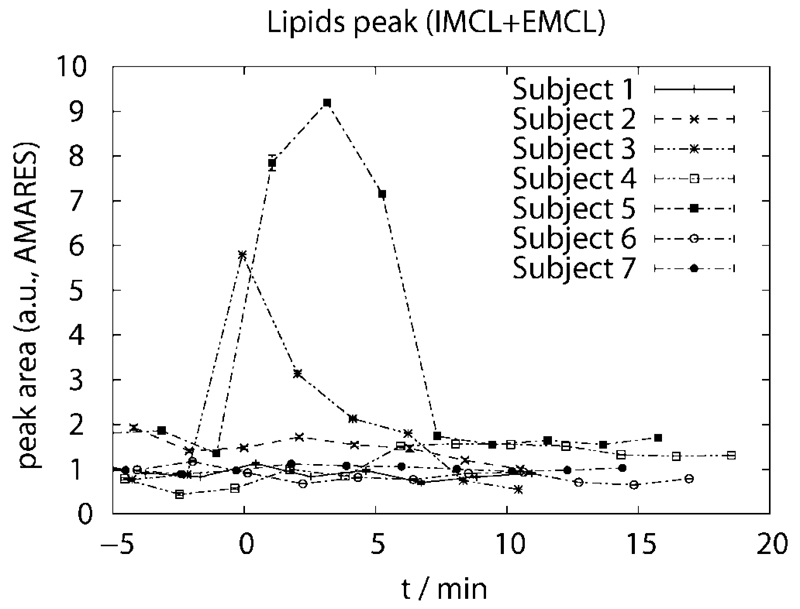
Intra- and extramyocellular lipid resonances, Cr and TMA in 1H STEAM spectra were also quantified using AMARES. In five of our seven subjects, lipid signals remain at a constant level in the VOI before, during, and after exercise for all except two subjects, as shown in Fig. 9, while in two data sets, the lipid peak area increases approximately fivefold during exercise, presumably because of motion.
Fig. 9.
Total lipid peak area IMCL+EMCL measured with 1H STEAM as function of time (t = 0 at onset of exercise). Lipid signals remain at a constant level in the VOI before, during, and after exercise for all except two subjects (labeled 3 and 5). The corresponding lactate absolute concentrations obtained for these two subjects are lying extremely close to the average lactate concentration, thus suggesting that the localizing double quantum filter sufficiently suppresses lipid contamination, even in these two cases.
Regardless of this signal increase in the region of 1.3 ppm in 1H STEAM spectra, the corresponding lactate absolute concentrations measured by double quantum filtered MRS obtained for these two subjects are very close to the group average of lactate concentrations measured in the remaining five subjects (deviating by only −5% and −0.3%, respectively). This suggests that the localizing double quantum filter with lipid inversion is capable of sufficiently suppressing lipid contaminations, at least up to the extent as observed in the cases reported here.
The standard 1H STEAM protocol which is also interleaved is not only capable of measuring total creatine and intramyocellular lipid changes during longer exercise but potentially also other metabolites such as acetylcarnitine (37).
Acknowledgments
Grant sponsor: Austrian Science Fund; Grant number: FWF-P15202-B02; Grant sponsor: Jubiläumsfonds der Oesterreichischen Nationalbank.
Footnotes
Published online in Wiley InterScience (www.interscience.wiley.com).
References
- 1.Chance B, Leigh JS, Clark BJ, Maris J, Kent J, Nioka S, Smith D. Control of oxidative metabolism and oxygen delivery in human skeletal muscle: a steady-state analysis of the work/energy cost transfer function. Proc Natl Acad Sci USA. 1985;82:8384–8388. doi: 10.1073/pnas.82.24.8384. [DOI] [PMC free article] [PubMed] [Google Scholar]
- 2.Arnold DL, Matthews PM, Radda GK. Metabolic recovery after exercise and the assessment of mitochondrial function in vivo in human skeletal muscle by means of 31 P NMR. Magn Reson Med. 1984;1:307–315. doi: 10.1002/mrm.1910010303. [DOI] [PubMed] [Google Scholar]
- 3.Bendahan D, Giannesini B, Cozzone PJ. Functional investigations of exercising muscle: a noninvasive magnetic resonance spectroscopy-magnetic resonance imaging approach. Cell Mol Life Sci. 2004;61:1001–1015. doi: 10.1007/s00018-004-3345-3. [DOI] [PMC free article] [PubMed] [Google Scholar]
- 4.Kemp GJ, Roussel M, Bendahan D, Fur YL, Cozzone PJ. Interrelations of ATP synthesis and proton handling in ischemically exercising human forearm muscle studied by 31 P magnetic resonance spectroscopy. J Physiol. 2001;535:901–928. doi: 10.1111/j.1469-7793.2001.00901.x. [DOI] [PMC free article] [PubMed] [Google Scholar]
- 5.Kemp G. Lactate accumulation, proton buffering, and pH change in ischemically exercising muscle. Am J Physiol Regul Integr Comp Physiol. 2005;289:R895–R901. doi: 10.1152/ajpregu.00641.2004. [DOI] [PubMed] [Google Scholar]
- 6.Robergs RA, Ghiasvand F, Parker D. Biochemistry of exercise-induced metabolic acidosis. Am J Physiol Regul Integr Comp Physiol. 2004;287:R502–R516. doi: 10.1152/ajpregu.00114.2004. [DOI] [PubMed] [Google Scholar]
- 7.Kemp GJ, Böning D, Strobel G, Beneke R, Maassen N. Explaining pH change in exercising muscle: lactic acid, proton consumption and buffering vs. strong ion difference. Am J Physiol Regul Integr Comp Physiol. 2006;291:R235–R237. doi: 10.1152/ajpregu.00662.2005. [DOI] [PubMed] [Google Scholar]
- 8.Crowther GJ, Carey MF, Kemper WF, Conley KE. Control of glycolysis in contracting skeletal muscle. I. Turning it on. Am J Physiol Endocrinol Metab. 2002;282:E67–E73. doi: 10.1152/ajpendo.2002.282.1.E67. [DOI] [PubMed] [Google Scholar]
- 9.Bendahan D, Kemp GJ, Roussel M, Fur YL, Cozzone PJ. ATP synthesis and proton handling in muscle during short periods of exercise and subsequent recovery. J Appl Physiol. 2003;94:2391–2397. doi: 10.1152/japplphysiol.00589.2002. [DOI] [PubMed] [Google Scholar]
- 10.Bendahan D, Confort-Gouny S, Kozak-Reiss G, Cozzone PJ. Heterogeneity of metabolic response to muscular exercise in humans. New criteria of invariance defined by in vivo phosphorus-31 NMR spectroscopy. FEBS Lett. 1990;272:155–158. doi: 10.1016/0014-5793(90)80472-u. [DOI] [PubMed] [Google Scholar]
- 11.Iotti S, Lodi R, Frassineti C, Zaniol P, Barbiroli B. In vivo assessment of mitochondrial functionality in human gastrocnemius muscle by 31 P MRS. The role of pH in the evaluation of phosphocreatine and inorganic phosphate recoveries from exercise. NMR Biomed. 1993;6:248–253. doi: 10.1002/nbm.1940060404. [DOI] [PubMed] [Google Scholar]
- 12.Brillault-Salvat C, Giacomini E, Wary C, Peynsaert J, Jouvensal L, Bloch G, Carlier PG. An interleaved heteronuclear NMRI-NMRS approach to non-invasive investigation of exercising human skeletal muscle. Cell Mol Biol (Noisy-le-grand) 1997;43:751–762. [PubMed] [Google Scholar]
- 13.Meyerspeer M, Krššák M, Kemp GJ, Roden M, Moser E. Dynamic interleaved 1 H/31 P STEAM MRS at 3 tesla using a pneumatic force-controlled plantar flexion exercise rig. Magn Reson Mater Phys. 2005;18:257–262. doi: 10.1007/s10334-005-0014-y. [DOI] [PMC free article] [PubMed] [Google Scholar]
- 14.Jouvensal L, Carlier PG, Bloch G. Low visibility of lactate in excised rat muscle using double quantum proton spectroscopy. Magn Reson Med. 1997;38:706–711. doi: 10.1002/mrm.1910380505. [DOI] [PubMed] [Google Scholar]
- 15.Price TB, Kamen G, Damon BM, Knight CA, Applegate B, Gore JC, Eward K, Signorile JF. Comparison of MRI with EMG to study muscle activity associated with dynamic plantar flexion. Magn Reson Imaging. 2003;21:853–861. doi: 10.1016/s0730-725x(03)00183-8. [DOI] [PubMed] [Google Scholar]
- 16.Vandenborne K, Walter G, Ploutz-Snyder L, Dudley G, Elliott MA, Meirleir KD. Relationship between muscle T2* relaxation properties and metabolic state: a combined localized 31 P-spectroscopy and 1 H-imaging study. Eur J Appl Physiol. 2000;82:76–82. doi: 10.1007/s004210050654. [DOI] [PubMed] [Google Scholar]
- 17.Meyerspeer M, Krššák M, Moser E. Relaxation times of 31 P-metabolites in human calf muscle at 3 tesla. Magn Res Med. 2003;49:620–625. doi: 10.1002/mrm.10426. [DOI] [PubMed] [Google Scholar]
- 18.Kingsley PB. Scalar coupling and zero-quantum coherence relaxation in STEAM: implications for spectral editing of lactate. Magn Reson Med. 1994;31:315–319. doi: 10.1002/mrm.1910310311. [DOI] [PubMed] [Google Scholar]
- 19.Asllani I, Shankland E, Pratum T, Kushmerick M. Double quantum filtered 1 H NMR spectroscopy enables quantification of lactate in muscle. J Magn Reson. 2001;152:195–202. doi: 10.1006/jmre.2001.2407. [DOI] [PubMed] [Google Scholar]
- 20.Asllani I, Shankland E, Pratum T, Kushmerick M. Anisotropic orientation of lactate in skeletal muscle observed by dipolar coupling in 1 H NMR spectroscopy. J Magn Reson. 1999;139:213–224. doi: 10.1006/jmre.1999.1774. [DOI] [PubMed] [Google Scholar]
- 21.Tjandra N, Bax A. Direct measurement of distances and angles in biomolecules by NMR in a dilute liquid crystalline medium. Science. 1997;278:1111–1114. doi: 10.1126/science.278.5340.1111. [DOI] [PubMed] [Google Scholar]
- 22.Jouvensal L, Carlier PG, Bloch G. Evidence for bi-exponential transverse relaxation of lactate in excised rat muscle. Magn Reson Med. 1999;41:624–626. doi: 10.1002/(sici)1522-2594(199903)41:3<624::aid-mrm27>3.0.co;2-w. [DOI] [PubMed] [Google Scholar]
- 23.Vermathen P, Boesch C, Kreis R. Mapping fiber orientation in human muscle by proton MR spectroscopic imaging. Magn Reson Med. 2003;49:424–432. doi: 10.1002/mrm.10396. [DOI] [PubMed] [Google Scholar]
- 24.Roth K, Hubesch B, Meyerhoff DJ, Naruse S, Gober J, Lawry T, Boska MD, Matson G, Weiner M. Noninvasive quantitation of phosphorus metabolites in human tissue by NMR spectroscopy. J Magn Reson. 1989;81:299–311. [Google Scholar]
- 25.Vanhamme L, van den Boogaart A, van Huffel S. Improved method for accurate and efficient quantification of MRS data with use of prior knowledge. J Magn Reson. 1997;129:35–43. doi: 10.1006/jmre.1997.1244. [DOI] [PubMed] [Google Scholar]
- 26.Naressi A, Couturier C, Devos JM, Janssen M, Mangeat C, de Beer R, Graveron-Demilly D. Java-based graphical user interface for the MRUI quantitation package. Magn Reson Mater Phys. 2001;12:141–152. doi: 10.1007/BF02668096. [DOI] [PubMed] [Google Scholar]
- 27.Sahlin K. Intracellular pH and energy metabolism in skeletal muscle of man. With special reference to exercise. Acta Physiol Scand Suppl. 1978;455:1–56. [PubMed] [Google Scholar]
- 28.Kushmerick MJ. Multiple equilibria of cations with metabolites in muscle bioenergetics. Am J Physiol. 1997;272:C1739–C1747. doi: 10.1152/ajpcell.1997.272.5.C1739. [DOI] [PubMed] [Google Scholar]
- 29.Kreis R, Jung B, Slotboom J, Felblinger J, Boesch C. Effect of exercise on the creatine resonances in 1 H MR spectra of human skeletal muscle. J Magn Reson. 1999;137:350–357. doi: 10.1006/jmre.1998.1683. [DOI] [PubMed] [Google Scholar]
- 30.Sharp RL, Costill DL, Fink WJ, King DS. Effects of eight weeks of bicycle ergometer sprint training on human muscle buffer capacity. Int J Sports Med. 1986;7:13–17. doi: 10.1055/s-2008-1025727. [DOI] [PubMed] [Google Scholar]
- 31.Weston AR, Myburgh KH, Lindsay FH, Dennis SC, Noakes TD, Hawley JA. Skeletal muscle buffering capacity and endurance performance after high-intensity interval training by well-trained cyclists. Eur J Appl Physiol Occup Physiol. 1997;75:7–13. doi: 10.1007/s004210050119. [DOI] [PubMed] [Google Scholar]
- 32.Pilegaard H, Domino K, Noland T, Juel C, Hellsten Y, Halestrap AP, Bangsbo J. Effect of high-intensity exercise training on lactate/H+ transport capacity in human skeletal muscle. Am J Physiol. 1999;276:E255–E261. doi: 10.1152/ajpendo.1999.276.2.E255. [DOI] [PubMed] [Google Scholar]
- 33.Kemp GJ, Taylor DJ, Styles P, Radda GK. The production, buffering and efflux of protons in human skeletal muscle during exercise and recovery. NMR Biomed. 1993;6:73–83. doi: 10.1002/nbm.1940060112. [DOI] [PubMed] [Google Scholar]
- 34.Williams GD, Mosher TJ, Smith MB. Simultaneous determination of intracellular magnesium and pH from the three 31 P NMR chemical shifts of ATP. Anal Biochem. 1993;214:458–467. doi: 10.1006/abio.1993.1523. [DOI] [PubMed] [Google Scholar]
- 35.Iotti S, Frassineti C, Alderighi L, Sabatini A, Vacca A, Barbiroli B. In vivo 31 P-MRS assessment of cytosolic [Mg2+] in the human skeletal muscle in different metabolic conditions. Magn Reson Imaging. 2000;18:607–614. doi: 10.1016/s0730-725x(00)00132-6. [DOI] [PubMed] [Google Scholar]
- 36.Yablonskiy DA, Neil JJ, Raichle ME, Ackerman JJ. Homonuclear J coupling effects in volume localized NMR spectroscopy: pitfalls and solutions. Magn Reson Med. 1998;39:169–178. doi: 10.1002/mrm.1910390202. [DOI] [PubMed] [Google Scholar]
- 37.Kreis R, Jung B, Rotman S, Slotboom J, Boesch C. Non-invasive observation of acetyl-group buffering by 1 H-MR spectroscopy in exercising human muscle. NMR Biomed. 1999;12:471–476. doi: 10.1002/(sici)1099-1492(199911)12:7<471::aid-nbm591>3.0.co;2-a. [DOI] [PubMed] [Google Scholar]


