

Abstract
The measurement of extracellular pH (pHe) has potential utility for cancer diagnoses and for assessing the therapeutic effects of pH-dependent therapies. A single magnetic resonance imaging (MRI) contrast agent that is detected through paramagnetic chemical exchange saturation transfer (PARACEST) was designed to measure tumor pHe throughout the range of physiologic pH and with magnetic resonance saturation powers that are not harmful to a mouse model of cancer. The chemical characterization and modeling of the contrast agent Yb3+-1,4,7,10-tetraazacyclododecane-1,4,7-triacetic acid,10-o-aminoanilide (Yb-DO3A-oAA) suggested that the aryl amine of the agent forms an intramolecular hydrogen bond with a proximal carboxylate ligand, which was essential for generating a practical chemical exchange saturation transfer (CEST) effect from an amine. A ratio of CEST effects from the aryl amine and amide was linearly correlated with pH throughout the physiologic pH range. The pH calibration was used to produce a parametric pH map of a subcutaneous flank tumor on a mouse model of MCF-7 mammary carcinoma. Although refinements in the in vivo CEST MRI methodology may improve the accuracy of pHe measurements, this study demonstrated that the PARACEST contrast agent can be used to generate parametric pH maps of in vivo tumors with saturation power levels that are not harmful to a mouse model of cancer.
THE MEASUREMENT of extracellular pH (pHe) has significant clinical value for pathologic diagnoses, for predicting the efficacy of pH-dependent therapies, and for monitoring the effects of pH-altering therapies. In particular, the tumor microenvironment is frequently characterized by an acidic pHe that is caused by increased glycolysis, poor perfusion, and reduced passive buffering capacity.1,2 A lower pHe has been correlated with increased gene mutations and altered gene expressions in tumors, which leads to spontaneous transformation of nonmetastatic tumors into metastatic tumors.3–6 A lower tumor pHe can provide resistance to chemotherapies that act as weak bases and can enhance the efficacy of chemotherapies that act as weak acids.7–9 Metastases and chemoresistance may occur in small localized regions of a tumor owing to the notorious biologic heterogeneity of the tumor microenvironment.10 Therefore, a method is needed to assess pHe throughout the tumor tissue at fine spatial resolution, especially for noninvasive, longitudinal assessments of the effects of antitumor chemotherapies.
Although a needle biopsy or optical imaging can measure the pHe of surface-accessible tumors, magnetic resonance imaging (MRI) provides advantages of noninvasively assessing entire tumor volumes at any location within the body. Measurements of tumor pHe with fine spatial resolution have been performed with MRI by using an exogenous T1 relaxation contrast agent.11–13 However, the quantification of pHe using a T1 relaxation contrast agent requires a second pH-unresponsive agent as a control to account for other factors that affect T1-weighted MRI contrast, such as the concentration of the agent. Although a T2* relaxation contrast agent may serve this purpose, the correlations between T1 relaxation and T2* relaxation create difficulties in quantifying each agent in a mixture, which makes this approach very challenging.14
MRI contrast agents that are detected via chemical exchange saturation transfer (CEST) have also been employed to measure pH. The CEST effects of amide protons of endogenous proteins and peptides have been used to qualitatively measure the intracellular pH of gliomas relative to normal brain tissues.15 Paramagnetic chemical exchange saturation transfer (PARACEST) contrast agents contain a lanthanide ion that greatly shifts the magnetic resonance (MR) frequency of the exchangeable amide protons from the MR frequency of water, which expands the range of MR frequencies that can generate a CEST effect.16 This expanded frequency range facilitates the development of an agent with two CEST effects that have different MR frequencies. PARACEST agents have been designed to possess pH-responsive and pH-unresponsive CEST effects from an amide and metal-bound water, respectively.17,18 A ratio of the two CEST effects can then be used to measure pHe without complications from varying concentrations of the agent.
Unfortunately, these PARACEST agents that contain an amide and metal-bound water only measure pHe below pH ≈ 7.0, whereas the pHe of tumors and normal tissues must be evaluated throughout the physiologic pH range. In addition, extremely high saturation powers are required to detect the CEST effect from the metal-bound water owing to fast exchange rates at physiologic temperature, so these agents cannot be safely applied to measure in vivo tumor pHe. We hypothesized that an aryl amine may provide a better CEST effect than the metal-bound water for this pHe measurement approach. The chemical exchange rate of an aryl amine may be sufficiently slowed by hydrogen bonding to proximal carboxylates, allowing the use of lower saturation powers that are safe for in vivo preclinical measurements of tumor pHe. In addition, the base-catalyzed chemical exchange rates of an amide and aryl amine are anticipated to be different, so the CEST effects of these chemical groups may show different trends with respect to pH throughout the physiologic pH range, which may expand the range of pH that can be measured.
To investigate this hypothesis, we designed a relatively simple PARACEST MRI contrast agent, Yb3+-1,4,7,10-tetraazacyclododecane-1,4,7-triacetic acid,10-o-aminoanilide (Yb-DO3A-oAA), which contains an aryl amine and an amide (Figure 1). Herein we report the characterization of Yb-DO3A-oAA, investigations of the pH dependence of the exchange rates, and CEST effects of this PARACEST agent and a preliminary study of a preclinical tumor pHe measurement with this PARACEST agent.
Figure 1.

A model of Yb-DO3A-oAA. The proximity of Yb(III) to the amide and the amine causes a shift in the magnetic resonance frequencies of these chemical groups. The proximities of the amine and carboxylate ligands indicate hydrogen bonds between these groups.
Materials and Methods
Synthesis of Yb-DO3A-oAA
DO3A-oAA was synthesized using a previously reported method.19 The structure of synthesized DO3A-oAA was confirmed with 1H nuclear magnetic resonance (NMR) spectroscopy performed at 600 MHz magnetic field strength at room temperature, in 99.9% D2O solvent, and referenced to the residual H2O resonance at 4.8 ppm (δ 2.54 [s, 2H], 2.78 [b, 6H], 3.34 [b, 16H], 5.98 [s, 1H], 7.37 [t, 1H], 7.76 [t, 1H], 8.07 [d, 2H], 9.60 [s, 1H]) and mass spectroscopy (matrix-assisted laser desorption/ionization [MALDI]-mass m/z [calcd 494.25], 495.83 [M + H]+). The Yb-DO3AA-oAA complex was prepared by mixing 300 mg of DO3A-oAA and YbCl3 at a molar ratio of 1:1.01 in pH 6 aqueous solution at 60°C for 2 hours. The pH was increased to 8.0 by dropwise addition of 1 N NaOH for an additional 30 minutes. After precipitating the excess free Yb3+ ions by adjusting the pH to 12, the solution was centrifuged, filtered, and lyophilized. The composition of Yb-DO3A-oAA was confirmed by MALDI time of flight mass spectrometry. The concentrations of the chelated Yb(III) complex were determined by inductively coupled plasma–mass spectrometry analysis. Although the final product contained Na+ and Cl− ions, this salt did not affect subsequent studies.
Molecular Modeling of Yb-DO3A-oAA
A molecular model of Yb-DO3A-oAA was constructed to estimate the distance from the aryl amine to the proximal carboxylates and the distance from the aryl amine and amide to the lanthanide ion. A model of DO3A-oAA was constructed with CS MOPAC Pro v8.0 within Chem3D Ultra v8.0 (CambridgeSoft Corp., Cambridge MA). A Yb(III) metal atom was inserted in the binding pocket of the model. Distances between the metal and the chelating amines, carboxylates, and carbonyl were constrained to 2.51 angstroms to match the experimentally determined distances between the coordinating atoms of Yb3+-1,4, 7,10-tetraazacyclododecane-1,4,7,10-tetraacetic acid (Yb-DOTA).20 The amide bond was rotated to cis or trans orientations, and the ring carbons were placed in plane with the amide hydrogen in each of these orientations. To avoid steric interactions between the amide and amine protons, the amide proton and carbon bound to the aryl amine were placed in a trans orientation. The resulting model of Yb-DO3A-oAA was energy minimized using the MM2 force field. The lowest energy conformation was used for subsequent analyses.
CEST Measurements
To investigate the effect of pH, samples of 20 mM Yb-DO3A-oAA were prepared in phosphate-buffered solutions that varied in pH between 6.1 and 8.0. To validate these results, all samples were measured with a pH meter (ThermoElectron, Waltham, MA) that was calibrated with standard commercial pH buffers (pH 4.0, 7.0, and 10.0). To investigate the effect of concentration, samples were also prepared that ranged in concentration from 4 to 80 mM. To investigate the effect of T1 relaxation, varying amounts of gadolinium–diethylenetriamine pentaacetic acid (Gd-DTPA; Magnevist, Berlex Inc, Montville, NJ) were added to samples at 40 mM concentration. CEST spectra were obtained with a 600 MHz Varian (Palo Alto, CA) NMR spectrometer using a standard one-dimensional pulse sequence that was prepended with a continuous wave saturation pulse applied for 6 seconds at 12.2 μT. One-dimensional NMR spectra were acquired with selective saturation applied from +30 ppm to −30 ppm in 1 ppm increments, relative to the water resonance that was referenced to 0 ppm. The height of the water peak in each NMR spectrum was plotted relative to the saturation frequency to generate the Z-spectrum. The temperature was maintained at 37°C during all CEST NMR studies.
The CEST effect is often determined by comparing the water signal with saturation applied at frequency ω (Ms) with the water signal with saturation applied at frequency −ω (M0) to account for direct saturation of water (equation 1).21 However, when this type of analysis is used to measure the CEST effect of the amide at −11 ppm, the water signal with saturation applied at +11 ppm may be affected by the CEST effect of the amine. Similarly, the CEST effect of the amine at +8 ppm cannot be compared to the water signal with saturation applied at −8 ppm owing to the CEST effect of the amide. To account for the direct saturation of water, the experimental NMR data were fitted with a three–lorentzian line shape model centered at 0, −11, and +8 ppm (Figure 2).22 The CEST effect of the amide was determined by comparing the signal at −11 ppm of the lorentzian line shapes centered at −11 ppm (Ms) and 0 ppm (M0), The CEST effect of the amine was determined using the signal at +8 ppm of the lorentzian line shapes centered at +8 ppm (Ms) and 0 ppm (M0).
Figure 2.

The extraction of PARACEST effects of the amine and amide from experimental data by three lorentzian line shapes centered at 0, −11, and +8 ppm. The CEST spectrum (solid line, no symbol) of Yb-DO3A-oAA at pH 6.5 and 37°C was acquired with selective saturation applied at 12.2 μT for 6 s, from +20 ppm to −20 ppm in 1 ppm increments. The line-fitting output showed a lorentzian line shape of water that was symmetric about 0 ppm (solid line with triangles) and lorentzian line shapes of the CEST effects of the amine (solid line with open circles) and the amide (solid line with filled circles).
Modified Bloch-McConnell equations that include chemical exchange of a two-pool model were used to relate pH with the CEST effects of the aryl amine and amide to pH.23 These modified equations show that the CEST effect (MS/M0) is related to the rate of exchange of a proton from the contrast agent to water (kCA):
| (1) |
where R1Wsat = the longitudinal relaxation rate of water during the saturation period, [H2O], [CA] = concentrations of water and the PARACEST agent, and nH2O and nCA = the number of exchangeable protons on a water molecule and CEST agent.
A ratiometric comparison of two CEST effects from an aryl amine and amide on the same agent is independent of [CA], [H2O], and R1Wsat (assuming that R1Wsat with selective saturation at +8 ppm is identical to R1Wsat with selective saturation at −11 ppm):
| (2) |
Because the kCA values of the aryl amine and amide are dependent on [H+] (see equation 6, below), the log10 ratio of the left side of equation 2 was compared to pH (ie, −log10[H+]; see equation 7, below) to calibrate the CEST effects with pH.
T1Wsat Relaxation Time Measurements
The T1WSat (1/R1Wsat) relaxation rate was measured for samples of 40 mM Yb-DO3A-oAA that contained different amounts of Gd-DTPA. A T1 inversion recovery experiment was performed with repetition times (TR) from 0.1 to 10 s with selective saturation applied at +8, −11, or +50 ppm during the TR period using a 600 MHz and a 300 MHz Varian NMR spectrometer. The heights of the water spectral line recorded at each TR was fit to a mono-exponential function with a constant offset (VNMR software, Varian Associates) to obtain the T1Wsat relaxation rate of the sample.
Chemical Exchange Rate Measurements
The QUEST method was used to measure the chemical exchange rates of the aryl amine and the amide.24 The CEST effect of each chemical group was measured as described above, using saturation times of 0.1, 0.2, 0.5, 1, 2, 4, and 6 s, and prepended with 32 scans prior to the measurement to ensure steady-state saturation conditions. The CEST effects as a function of saturation time were fit with a transient solution of Bloch-McConnell equations to extract the water exchange rate, kH2O:
| (3) |
| (4) |
where MS, M0 = water magnetization with and without saturation, respectively, TS = saturation time, R1sat = relaxation rate of water with selective saturation, and kH2O = rate of exchange of a proton from water to the contrast agent.
At steady-state equilibrium, the number of protons transferred from the contrast agent to water must equal the number of protons transferred from the water to the contrast agent. The value of kCA was determined by weighting the chemical exchange rates kH2O and kCA by the number of protons in the water and contrast agent that may be transferred:
| (5) |
The chemical exchange rate between water and an aryl amine or amide is typically catalyzed by hydroxide ions or protons according to acid-base catalysis theory (equations 6 and 7).25 The experimentally determined pH dependence of kCA was fit to equation 7 using customized software developed for Matlab (Mathworks, Natick, MA).
| (6) |
| (7) |
where k0 = spontaneous exchange constant, ka = acid-catalyzed exchange constant, kb = base-catalyzed exchange constant, KW = ionization constant of water, and KW = 10−15.4 at 37°C.26
Measurement of In Vivo Tumor pHe
An in vivo study was conducted according to approved procedures of the Institutional Animal Care and Use Committee of Case Western Reserve University. A warmed solution of 1 million MCF-7 mammary carcinoma cells in 1 mL of 50% Matrigel was injected subcutaneously into the right rear flank of a 6-week-old female athymic NCR nu/nu mouse. The flank tumor was allowed to grow for 6 weeks until it reached a size of 7.66 mm in diameter, so the mature tumor was expected to exhibit low pHe.27 The mouse was anesthetized with 2.0% isoflurane in oxygen carrier gas and secured to a customized cradle. Phantoms consisting of 60 mM Yb-DO3A-oAA and distilled water were taped to the mouse torso as references, and the lower flank of the mouse was tightly constrained to the cradle to prevent motion artifacts. Respiration and rectal temperature were continuously monitored, and body temperature was maintained at 37.0°C using warmed air and a computer-controlled temperature feedback system (SA Instruments, Inc., Stony Brook, NY). MRI was performed with a 9.4 T Bruker Biospec small-animal MRI scanner (Bruker Biospin, Inc., Billerica, MA) equipped with a 35 mm birdcage radiofrequency coil. A rapid acquisition with relaxation enhancement (RARE) MRI pulse sequence with a RARE factor of 16 (TR/evolution time [TE] = 6.0 s/8.6 ms) was prepended with a saturation period applied with a 21 μT saturation power for a total of 5.49 seconds. This saturation period consisted of 300 gaussian-shaped pulses with a pulse length of 18.28 ms and an interpulse delay of 10 μs. This gaussian-shaped pulse generated a bandwidth of 0.5 ppm to facilitate selective excitation. Forty-eight seconds was required to acquire a single MRI with 128 × 128 pixels that covered a 35 × 35 mm field of view, a single slice with a thickness of 1 mm, and a single average. A solution of 60 mM of Yb-DO3A-oAA in 50 μL volume was directly injected to the center of tumor. MRIs were serially acquired with selective saturation at +8, −11, and +50 ppm before injection, and two sets of CEST MRIs with the same saturation frequencies were acquired starting 2 and 5 minutes after the injection. After the MRI session, the mouse was removed from the MR magnet and cradle and allowed to recover from anesthesia.
A parametric map of pH was calculated by comparing the water signal at 2 minutes after injection (Ms) with the water signal before injection (M0) at saturations applied at +8 ppm and −11 ppm and using the CEST-pH calibration determined with phantoms. A second parametric pH map was calculated by comparing the water signal at 5 minutes after injection to the water signal before injection using the same procedure. The contrast to noise ratio, or the CEST to noise ratio in this type of experiment, must exceed 2√2 to ensure that the contrast has a 95% probability of being real.28 This threshold was reached for these images when a calculated CEST effect was at least 2.0%. Therefore, only pixels that showed at least a 2.0% CEST effect from both the aryl amine and the amide were retained in the final parametric pH maps.
Results
Synthesis and Chemical Characterization
DO3A-oAA was synthesized using a straightforward procedure and used to chelate Yb(III) with quantitative yield. The CEST effects of the aryl amine and amide were detected at +8 ppm and −11 ppm, respectively, relative to water that was referenced to 0 ppm (see Figure 2). These NMR chemical shifts agreed with the chemical shifts of exchangeable protons listed in our previous report about Yb-DO3A-oAA.29
Based on the molecular model, the exchangeable amide proton is 5.6 Å from the lanthanide ion, and the two amine protons are each 4.6 Å from this ion, indicating that each of these protons should be sufficiently close to the ion to experience a pseudocontact shift. Furthermore, an amine proton is located 2.4 Å from the carboxylate oxygen of an adjacent acetate ligand, which indicates that the amine should be able to form a hydrogen bond with this oxygen atom. This molecular model was produced by classic newtonian molecular modeling with additional constraints to simulate the highly constrained macrocyclic chelate. Although this model represents a plausible conformation, it should not be considered to be the only or most likely conformation as more sophisticated molecular modeling methods may produce a more refined representation of Yb-DO3A-oAA. Still, this plausible model adequately represented the gross morphologic features of this highly constrained macrocyclic chelate and supports the observation of the two CEST effects at +8 ppm and −11 ppm.
The measured exchange rates of the aryl amine and amide were fit to an acid-base-catalyzed exchange model (Figure 3). The amide proton showed typical base-catalyzed characteristics with a base-catalyzed exchange constant kb of 6.71 × 10⁹ s−1 (k0 = 517.85 s−1, ka = 8 s−1) that was very close to a previously reported value of 5.57 × 10⁹ s−1 for other amides.30 The pH dependency of the aryl amine showed base-catalyzed water exchange behavior below pH 7.1, with a kb of 3.19 × 10¹⁰ s−1 (k0 = 376.86 s−1, ka = 0 s−1). In the pH range higher than 7.1, the exchange rates of the aryl amine could not be fit to a base-catalyzed exchange model; instead, the fitting indicated an acid-catalyzed exchange model (kb = 0.76 s−1, k0 = 119.69 s−1, ka = 6.06 × 10⁹ s−1).
Figure 3.
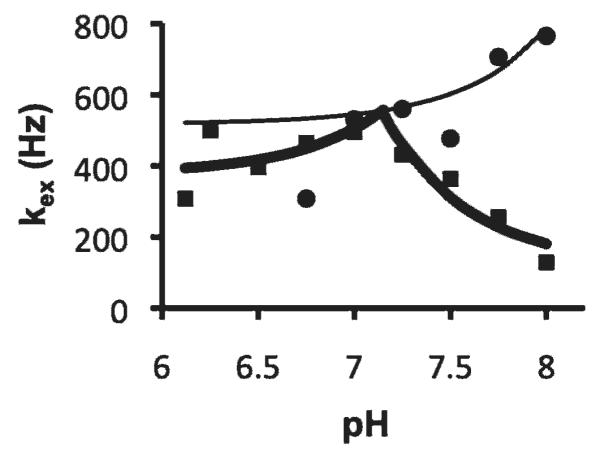
The exchange rate dependencies on pH of the amine and amide. The measured exchange rates of the amide (circles) and the amine (squares) were fit with equation 7 to extract the acid-base-catalyzed exchange constants. The thin line was the modeled behavior for the amide exchange process. The thick line was the modeled behavior for base-catalyzed exchange of amine protons in the pH range of 6.1 to 7.0 and for acid-catalyzed exchange in the pH range of 7.2 to 8.0.
Relationship between the CEST Effects and pH
The pH dependencies of the two CEST effects of Yb-DO3A-oAA were investigated in the pH range of 6.1 to 8.0 (Figure 4A). The amide showed increasingly greater CEST with increasing pH, reaching the greatest effect at pH 8, which was the highest pH tested in our study. The amine showed increasing PARACEST with increasing pH up to 7.1 and decreasing CEST with increasing pH beyond 7.1.
Figure 4.

A, The pH dependencies of amide CEST (diamonds) and amine CEST (squares). B, The ratio of the CEST effects relative to pH. C, The log10 of the CEST ratio relative to pH. The phantoms consisted of 30 mM Yb-DO3A-oAA in phosphate-buffered saline at 37°C, with pH values ranging from 6.1 to 8.0 in increments of 0.25 pH units. The NMR method was the same as described in Figure 2.
The log10 ratio of the CEST effects were linearly correlated with pH as measured with a microelectrode (Figure 4C). The pH measurements with the ratiometric CEST method and the microelectrode were repeated with MRI phantoms that had different concentrations of Yb-DO3A-oAA and under conditions with different T1Wsat relaxation times. These results showed that pH measurements had a mean standard deviation of 0.11 pH units when the concentration was at least 10 mM and the T1Wsat relaxation time was at least 0.5 seconds (Figure 5). However, at lower concentrations or shorter T1Wsat relaxation times, the CEST effects were too weak to be accurately detected, which led to larger errors in measuring pH. In addition, the T1Wsat relaxation time of a sample of Yb-DO3A-oAA (at 40 mM concentration and 300 MHz magnetic field strength) was measured to be 1.15 ± 0.02 s and 1.14 ± 0.01 s with selective saturation applied at +8 ppm or −11 ppm, respectively. This validated the assumption that was used to derive equation 2 and applied to this study of Yb-DO3A-oAA. The T1Wsat relaxation time with selective saturation applied at +50 ppm was 1.48 ± 0.01 s, which suggests that the assumption that was used to derive equation 2 is not necessarily valid for CEST agents that have two CEST effects that are not symmetric about the water MR frequency.
Figure 5.

The precision of pH measurements. A, Solutions of Yb-DO3A-oAA with T1Wsat greater than 1.5 s were used to measure pH at 600 MHz magnetic field strength. The standard deviation was determined from three trials per concentration. B, Solutions of Yb-DO3A-oAA at 40 mM concentration were used to measure pH at 300 MHz magnetic field strength. The standard deviation was determined from three trials per T1Wsat value. The average standard deviation of pH measurements was 0.11 pH units for samples with at least 10 mM concentration and 0.5 s T1Wsat.
In Vivo Tumor pHe Measurement
An in vivo study was conducted by directly injecting a solution of Yb-DO3A-oAA directly into a mature flank tumor in a mouse model of MCF-7 mammary carcinoma. A parametric map of pH was calculated using the correlation shown in Figure 4C by comparing the water signal at 2 minutes after injection (Ms) to the water signal before injection (M0) at saturations applied at +8 ppm and −11 ppm at 21 μT for 5.49 s (Figure 6). The parametric pH map was overlaid on an anatomic MRI to provide an anatomic reference.
Figure 6.

The parametric map of the CEST effect of the amine divided by the CEST effect of the amide (A) was used to create an initial parametric pH map (B). Pixels that showed a statistically significant CEST effect from the amine and amide were retained to create (C) a filtered parametric pH map of a mouse tumor model. The filtered parametric pH map is overlaid on an anatomic MRI. A solution of 60 mM of Yb-DO3A-oAA in 50 μL volume was directly injected into the center of the tumor. The result showed an acidic environment in the tumor region.
The pH map was initially calculated for all pixels (see Figure 6B). Some pixels in this map were dominated by signal noise that caused small fluctuations in water MR signals that can result in a large ratio in equation 2. In addition, pixels along the periphery of the mouse showed a large ratio owing to magnetic susceptibilities at the air-tissue interface, which agrees with other reports of in vivo CEST MRI.31 Pixels that represented the mammary fat pad and other adipose tissues also showed a large ratio, presumably because the higher spin density of this tissue amplifed small fluctuations in MR signals and/or caused magnetic susceptibilities or altered the average MR frequency of the water. To address these problems, only pixels that showed at least a 2.0% CEST effect from the aryl amine and amide were retained in the final parametric pH map. This threshold of 2.0% represented the contrast to noise ratio, or the CEST to noise ratio in this type of experiment, which ensured that the contrast has a 95% probability of being a real effect of the injection of the agent. This filtering criterion retained only pixels in the parametric pH map that represented the tumor and phantom with the agent (see Figure 6C).
Most of the tumor area showed a pHe of 6.5 or lower, whereas the phantom containing the PARACEST agent showed a pH of 6.9, as expected. The parametric map of the phantom with Yb-DO3A-oAA showed a gradient, which was most likely caused by a temperature gradient across the phantom or a gradient of magnetic field inhomogeneities. A second parametric pH map was calculated using the MRIs acquired starting 5 minutes after the injection (not shown). This second pHe map was very similar to the first map, indicating that the concentration of the agent did not change enough to affect the pHe measurement during the first 5 minutes after injection. In addition to the selective saturations at +8 ppm and −11 ppm, selective saturations were also applied at +50 ppm before and after injection of the agent. The difference between images with saturation at +50 ppm before and after injection of the agent showed only noise, which indicated that the comparison of images before and after injection was not different for reasons other than the injection of the agent.
Discussion
Chemical Exchange Saturation Transfer
The MR frequency of the CEST effect of the amide agreed closely with similar studies with amide-containing derivatives of Yb-DOTA.32 The large MR frequency shift of the amine was unexpected and is presumably due to the hydrogen bonding of the oAA ligand that positions the amine near the Yb(III) ion, as shown in the molecular model. This large MR frequency shift is critical for generating a CEST effect from an amine group.
The chemical exchange rate of the amide was measured to be no higher than 765.76 Hz throughout the physiologic pH range, which agreed with previous reports.33 The chemical exchange rate of the aryl amine was measured to be no higher than 494.92 Hz throughout the same pH range, which was slower than previously reported chemical exchange rates for an amine. This slower chemical exchange rate is presumably due to a hydrogen bond that is formed between the aryl amine and a proximal carboxylate ligand, as shown in the molecular model. For comparison, the CEST effect of another amine-containing DOTA derivative, Tm-(α-amino-DOTA), is impractical to detect with 1.5 to 9.4 T MR field strengths owing to a fast kCA that is estimated to approach 2,400 Hz.34 An analogous PARACEST agent, Yb-(α-amino-DOTA), required an unusually slow kCA to generate a CEST effect from the amine.35 Thus, the practical detection of a CEST effect of an amine requires a chemical design that slows kCA.
A comparison of the chemical exchange rates with the acid-base catalyzed exchange model showed that the amide was base-catalyzed throughout the physiologic pH range, as expected.36 The pKa of an aryl amine is expected to be greater than 9.3, so this amine should also undergo base-catalyzed chemical exchange throughout the physiologic pH range.37 However, the chemical exchange catalysis of the aryl amine showed base-catalyzed exchange behavior only below pH 7.1 and did not fit a base-catalyzed exchange model at higher pH. This dichotomy suggests that the QUEST method may not be able to accurately measure fast chemical exchange rates that occur for the aryl amine at high pH. A previous report compared the QUEST method and numerical solutions to the Bloch equations, which reached a similar conclusion that the QUEST method can fail to accurately measure fast exchange rates.24 Thus, a more thorough analysis is required to assess the ability of the QUEST method to evaluate proton exchange catalysis mechanisms.
Measurement of pH with the Two CEST Effects
The log10 ratio of the CEST effects showed a linear correlation with pH (see Figure 6C). This relationship between CEST and pH is empirical. Although a more detailed comparison of the CEST-pH relationship with equations 2 and 7 may provide a more accurate correlation, this empirical relationship showed very good accuracy relative to pH electrode measurements. Furthermore, this empirical relationship covered the entire physiologic pH range.
This relationship generated pH measurements with excellent precision for samples with a concentration greater than 10 mM and for a T1Wsat relaxation time greater than 0.5 seconds, which are conditions required to generate large CEST effects (see Figure 5). This level of precision of Yb-DO3A-oAA is comparable to MR spectroscopy methods that generate coarse parametric pH maps with a standard deviation of 0.1 to 0.2 pH units.38 The ratiometric approach may have contributed to this precision by cancelling effects that similarly influence the chemical exchange of the amide and aryl amine, although additional studies are warranted to confirm that these effects are cancelled by this ratiometric approach. The importance of generating large CEST effects from both the aryl amine and the amide is exemplified by the lower accuracy of measurements at pH 6.1 and 8.0 because these pH values create a small CEST effect from the amine or amide. Yb-DOTA derivatives have been conjugated to dendrimers to generate larger pH-dependent CEST effects on a per-dendrimer basis.39,40 A similar approach of conjugating Yb-DO3A-oAA to dendrimers may improve the precision of pH measurements with this agent.
In Vivo Tumor pHe Measurement
A statistically significant change in image contrast was observed throughout the tumor after injecting the contrast agent into the tumor. Therefore, this change in contrast was attributed to the CEST effects of the agent within the tumor. This change in contrast was achieved with an MR saturation power of 21 μT that was well tolerated by the mouse, which indicates that Yb-DO3A-oAA can generate CEST effects with physiologically acceptable power levels.
The parametric pH map showed a very low pHe at or below 6.5 for the tumor. This xenograft flank tumor was very mature and therefore was expected to exhibit low pHe. Although the magnitudes of the CEST effects between 2.0 and 7.2% indicated that the PARACEST agent may be heterogeneously distributed throughout the tumor, the accuracy of the parametric pH map is inherently unaffected by the concentration of the agent. A precise parametric pH map requires a minimum of 4 mM concentration of the contrast agent. Solution studies have shown that a 4 mM concentration of Yb-DO3A-oAA generates a 2.0% CEST effect.29 Tissue studies may require a greater concentration of a PARACEST agent relative to solution studies to generate the same CEST effect owing to the influence of endogenous magnetization transfer (MT).41 Fortunately, the influence of MT is expected to be similar for CEST effects at +8 and −11 ppm, so the ratiometric approach may cancel or reduce these MT effects on the pH measurement (additional studies are warranted to confirm that MT effects are cancelled by this ratiometric approach). Despite the potential influence of MT, the in vivo detection of a statistically significant CEST effect that was at least 2.0% demonstrates that the CEST effect was sufficiently strong to generate a precise parametric pH map. A precise parametric pH map also requires a minimum of 0.5 second T1Wsat relaxation time of the tumor tissue with the contrast agent. Based on the ≈ 2 second T1 relaxation time of endogenous tumor tissue at 7 T and an 0.0106 mM−1 s−1 T1 relaxivity of a similar amide-containing Yb-DOTA derivative (and assuming that the T1 relaxivity is comparable in vivo and in solution), the injected concentration of a Yb-DOTA derivative cannot cause the T1Wsat relaxation time of the tumor to be less than 0.5 s.42
The M0 and MS values that were used to calculate the in vivo CEST effects were determined from the MR water signal before and after administering the agent. This approach accounts for static effects before and after the injection, including static MT effects and relaxation effects. However, this approach does not account for dynamic effects that may change after injection of the agent. For example, the contrast agent may create a dynamic change in T2 relaxation that may cause broadening of the MR frequency distribution of the water, which may increase direct saturation of water.43 Chemical exchange may also broaden the MR frequency distribution of the water. No significant signal broadening in the NMR spectrum of the water peak was observed during our analyses of the effect of contrast agent concentration, which suggests that the effect of Yb-DO3A-oAA on the direct saturation of water is negligible during the dynamic MR study. Yet additional studies are warranted to confirm this initial observation.
This approach for determining MS and M0 does not account for variances in the chemical shifts of water. Static magnetic field susceptibilities may alter the average chemical shift of water within each voxel, whereas injection of the agent may cause a dynamic change in the water chemical shift within a voxel.44 The empirical calibration of the CEST effects with pH (see Figure 4C) is based on selective saturations applied at MR chemical shifts relative to a water chemical shift at 0 ppm. Thus, static and dynamic magnetic field susceptibilities may affect the parametric pH map. Future in vivo studies should be conducted by applying fast MR CEST spectroscopic imaging methods that acquire a CEST spectrum for each image voxel and analyzed to account for potential changes in chemical shifts.45–47
Conclusion
A new PARACEST MRI contrast agent, Yb-DO3A-oAA, showed two CEST effects that can be used to accurately measure pH with a single MRI contrast agent. The intramolecular dual CEST effect enabled the measurement of pH without the need for a second “control” agent to account for agent concentrations or T1Wsat relaxation. A preliminary in vivo study demonstrated the feasibility of applying this method with MR saturation powers that are safe for in vivo studies of pathologic tissues that require high-resolution maps of pHe. Additional studies are warranted to refine the calibration of the CEST effects with pH, to further investigate the advantages of a ratiometric approach for canceling other phenomena that may influence the in vivo pHe measurement, and to account for variations in magnetic field susceptibility during in vivo MRI studies.
Acknowledgments
The authors would like to thank the Case Center for Imaging Research and the Department of Macromolecular Science and Engineering at Case Western Reserve University for access to an MRI scanner and an NMR spectrometer, respectively.
Financial disclosure of authors: This research was supported by the Northeastern Ohio Small Animal Imaging Resource Center (R24CA110943) and the Arizona Cancer Center through a National Cancer Institute (NCI) Cancer center support grant (CA 023074). M.D.P. was supported through NCI grants CA 017094 and CA 133455-01. V.R.S. was supported through the US Army Medical Research and Materiel Command under grant no. W81XWH-09-1-0053 and in part by the Case Western Reserve University Medical Scientist Training Program under National Institutes of Health grant no. T32 GM007250.
Footnotes
Financial disclosure of reviewers: None reported.
Reference
- 1.Warburg O. On the origin of cancer cells. Science. 1956;123:309–14. doi: 10.1126/science.123.3191.309. [DOI] [PubMed] [Google Scholar]
- 2.Griffiths JR. Are cancer cells acidic? Br J Cancer. 1991;64:425–7. doi: 10.1038/bjc.1991.326. [DOI] [PMC free article] [PubMed] [Google Scholar]
- 3.Russo CA, Weber TK, Volpe CM, et al. An anoxia inducible endonuclease and enhanced DNA breakage as contributors to genomic instability in cancer. Cancer Res. 1995;55:1122–8. [PubMed] [Google Scholar]
- 4.Morita T, Nagaki T, Fukuda I, Okumura K. Clastogenicity of low pH to various cultured mammalian cells. Mutat Res. 1992;268:297–305. doi: 10.1016/0027-5107(92)90235-t. [DOI] [PubMed] [Google Scholar]
- 5.Shi Q, Le X, Wang B, et al. Regulation of vascular endothelial growth factor expression by acidosis in human cancer cells. Oncogene. 2001;20:3751–6. doi: 10.1038/sj.onc.1204500. [DOI] [PubMed] [Google Scholar]
- 6.Martinez-Zaguilan R, Seftor EA, Seftor RE, et al. Acidic pH enhances the invasive behavior of human melanoma cells. Clin Exp Metastasis. 1996;14:176–86. doi: 10.1007/BF00121214. [DOI] [PubMed] [Google Scholar]
- 7.Mahoney BP, Raghunand N, Baggett B, Gillies RJ. Tumor acidity, ion trapping and chemotherapeutics. I. Acid pH affects the distribution of chemotherapeutic agents in vitro. Biochem Pharmacol. 2003;66:1207–18. doi: 10.1016/s0006-2952(03)00467-2. [DOI] [PubMed] [Google Scholar]
- 8.Raghunand N, Mahoney BP, Gillies RJ. Tumor acidity, ion trapping and chemotherapeutics II. pH-dependent partition coefficients predict importance of ion trapping on pharmacokinetics of weakly basic chemotherapeutic agents. Biochem Pharmacol. 2003;66:1219–29. doi: 10.1016/s0006-2952(03)00468-4. [DOI] [PubMed] [Google Scholar]
- 9.Gerweck LE, Seetharaman K. Cellular pH gradient in tumor versus normal tissue: potential exploitation for the treatment of cancer. Cancer Res. 1996;56:1194–8. [PubMed] [Google Scholar]
- 10.Bhujwalla ZM, Artemov D, Aboagye E, et al. The physiological environment in cancer vascularization, invasion, and metastasis. Novartis Found Symp. 2001;240:23–38. doi: 10.1002/0470868716.ch3. [DOI] [PubMed] [Google Scholar]
- 11.Raghunand N, Howison C, Sherry AD, et al. Renal and systemic pH imaging by contrast-enhanced MRI. Magn Reson Med. 2003;49:249–57. doi: 10.1002/mrm.10347. [DOI] [PubMed] [Google Scholar]
- 12.Garcia-Martin ML, Martinez GV, Raghunand N, et al. High resolution pHe imaging of rat glioma using pH-dependent relaxivity. Magn Reson Med. 2006;55:309–15. doi: 10.1002/mrm.20773. [DOI] [PubMed] [Google Scholar]
- 13.Lowe M, Parker D, Reany O, et al. pH-dependent modulation of relaxivity and luminescence in macrocyclic gadolinium and europium complexes based on reversible intramolecular sulfonamide ligation. J Am Chem Soc. 2001;123:7601–9. doi: 10.1021/ja0103647. [DOI] [PubMed] [Google Scholar]
- 14.Martinez GV, Zhang X, Garcia-Martin ML, et al. Imaging the extracellular pH of tumors by MRI after injection of a single cocktail of T1 and T2 contrast agents. NMR Biomed. 2010 doi: 10.1002/nbm.1701. [In press] [DOI] [PMC free article] [PubMed] [Google Scholar]
- 15.Zhou J, Lal B, Wilson DA, et al. Amide proton transfer (APT) contrast for imaging of brain tumors. Magn Reson Med. 2003;50:1120–6. doi: 10.1002/mrm.10651. [DOI] [PubMed] [Google Scholar]
- 16.Zhang S, Wu K, Sherry AD. Novel pH-sensitive MRI contrast agent. Angew Chem Int Ed. 1999;38:3192–4. [PubMed] [Google Scholar]
- 17.Terreno E, Delli Castelli D, Cravotto G, et al. Ln(III)-DOTAMGly complexes: a versatile series to assess the determinants of the efficacy of paramagnetic chemical exchange saturation transfer agents for magnetic resonance imaging applications. Invest Radiol. 2004;39:235–43. doi: 10.1097/01.rli.0000116607.26372.d0. [DOI] [PubMed] [Google Scholar]
- 18.Aime S, Delli Castelli D, Terreno E. Novel pH-reporter MRI contrast agents. Angew Chem Int Ed. 2002;41:4334–6. doi: 10.1002/1521-3773(20021115)41:22<4334::AID-ANIE4334>3.0.CO;2-1. [DOI] [PubMed] [Google Scholar]
- 19.Li Y, Sheth VR, Liu G, Pagel MD. A self-calibrating PARACEST MRI contrast agent that detects esterase enzyme activity. Contrast Media Mol Imaging. 2010 doi: 10.1002/cmmi.421. [In press] [DOI] [PMC free article] [PubMed] [Google Scholar]
- 20.Liu S, He Z, Hsieh W-Y, Fanwick PE. Synthesis, characterization and x-ray crystal structure of In(DOTA-AA) (AA = p-aminoanilide): a model for 111In-labeled DOTA-biomolecule conjugates. Inorg Chem. 2003;42:8831–7. doi: 10.1021/ic0349914. [DOI] [PubMed] [Google Scholar]
- 21.Ward KM, Aletras AH, Balaban RS. A new class of contrast agents for MRI based on proton chemical exchange dependent saturation transfer (CEST) J Magn Reson. 2000;143:79–87. doi: 10.1006/jmre.1999.1956. [DOI] [PubMed] [Google Scholar]
- 22.Henkelman RM, Huang X, Xiang QS, et al. Quantitative interpretation of magnetization transfer. Magn Reson Med. 1993;29:759–66. doi: 10.1002/mrm.1910290607. [DOI] [PubMed] [Google Scholar]
- 23.Zhang S, Merritt M, Woessner DE, et al. PARACEST agents: modulating MRI contrast via water proton exchange. Acc Chem Res. 2003;36:783–90. doi: 10.1021/ar020228m. [DOI] [PubMed] [Google Scholar]
- 24.McMahon MT, Gilad AA, Zhou J, et al. Quantifying exchange rates in chemical exchange saturation transfer agents using the saturation time and saturation power dependencies of the magnetization transfer effect on the magnetic resonance imaging signal (QUEST and QUESP): pH calibration for poly-L-lysine and a starburst dendrimer. Magn Reson Med. 2006;55:836–47. doi: 10.1002/mrm.20818. [DOI] [PMC free article] [PubMed] [Google Scholar]
- 25.Barksdale AD, Rosenberg A. Acquisition and interpretation of hydrogen exchange data from peptides, polymers, and proteins. Methods Biochem Anal. 1982;28:1–113. doi: 10.1002/9780470110485.ch1. [DOI] [PubMed] [Google Scholar]
- 26.Covington AK, Robinson RA, Bates RG. The ionization constant of deuterium oxide from 5 to 50°. J Phys Chem. 1966;70:3820–4. [Google Scholar]
- 27.Gillies RJ, Raghunand N, Karczmar GS, Bhujwalla ZM. MRI of the tumor microenvironment. J Magn Reson Imaging. 2002;16:430–50. doi: 10.1002/jmri.10181. [DOI] [PubMed] [Google Scholar]
- 28.Liu G, Ali M, Yoo B, et al. PARACEST MRI with improved temporal resolution. Magn Reson Med. 2009;61:399–408. doi: 10.1002/mrm.21863. [DOI] [PMC free article] [PubMed] [Google Scholar]
- 29.Liu G, Li Y, Pagel MD. Design and characterization of new irreversible responsive PARACEST MRI contrast agent that detects nitric oxide. Magn Reson Med. 2007;58:1249–56. doi: 10.1002/mrm.21428. [DOI] [PubMed] [Google Scholar]
- 30.Zhou J, Wilson DA, Sun PZ, et al. Quantitative description of proton exchange processes between water and endogenous and exogenous agents for WEX, CEST, and APT experiments. Magn Reson Med. 2004;51:945–52. doi: 10.1002/mrm.20048. [DOI] [PubMed] [Google Scholar]
- 31.Gilad AA, McMahon MT, Walczak P, et al. Artificial reporter gene providing MRI contrast based on proton exchange. Nat Biotechnol. 2007;25:217–9. doi: 10.1038/nbt1277. [DOI] [PubMed] [Google Scholar]
- 32.Aime S, Barge A, Delli Castelli D, et al. Paramagnetic lanthanide(III) complexes as pH-sensitive chemical exchange saturation transfer (CEST) contrast agents for MRI applications. Magn Reson Med. 2002;47:639–48. doi: 10.1002/mrm.10106. [DOI] [PubMed] [Google Scholar]
- 33.Liepinsh E, Otting G. Proton exchange rates from amino acid side chains-implications for image contrast. Magn Reson Med. 1996;35:30–42. doi: 10.1002/mrm.1910350106. [DOI] [PubMed] [Google Scholar]
- 34.Yoo B, Pagel MD. A PARACEST MRI contrast agent to detect enzyme activity. J Am Chem Soc. 2006;128:14032–3. doi: 10.1021/ja063874f. [DOI] [PubMed] [Google Scholar]
- 35.Chauvin T, Durand P, Bernier MI, et al. Detection of enzymatic activity by PARACEST MRI: a general approach to target a large variety of enzymes. Angew Chem Int Ed. 2008;47:4370–2. doi: 10.1002/anie.200800809. [DOI] [PubMed] [Google Scholar]
- 36.Englander SW, Downer NW, Teitelbaum H. Hydrogen exchange. Annu Rev Biochem. 1972;41:903–24. doi: 10.1146/annurev.bi.41.070172.004351. [DOI] [PubMed] [Google Scholar]
- 37.Hall HK. Correlation of the base strengths of amines. J Am Chem Soc. 1957;79:5441–4. [Google Scholar]
- 38.Gillies RJ, Raghunand N, Garcia-Martin ML, Gatenby RA. pH imaging. A review of pH measurement methods and applications in cancers. IEEE Eng Med Biol. 2004;23:57–64. doi: 10.1109/memb.2004.1360409. [DOI] [PubMed] [Google Scholar]
- 39.Pikkemaat JA, Wegh RT, Lamerichs R, et al. Dendritic PARACEST contrast agents for magnetic resonance imaging. Contrast Media Mol Imaging. 2007;2:229–39. doi: 10.1002/cmmi.149. [DOI] [PubMed] [Google Scholar]
- 40.Ali MM, Yoo B, Pagel MD. Tracking the relative in vivo pharmacokinetics of nanoparticles with PARACEST MRI. Mol Pharm. 2009;6:1409–16. doi: 10.1021/mp900040u. [DOI] [PMC free article] [PubMed] [Google Scholar]
- 41.Li AX, Hudson RHE, Barrett JW, et al. Four-pool modeling of proton exchange processes in biological systems in the presence of MRI-paramagnetic chemical exchange saturation transfer (PARACEST) agents. Magn Reson Med. 2008;60:1197–206. doi: 10.1002/mrm.21752. [DOI] [PubMed] [Google Scholar]
- 42.Yoo B. Molecular imaging of breast cancer using paracest MRI [thesis] Case Western Reserve University; Cleveland (OH): 2007. [Google Scholar]
- 43.Haacke EM, Brown RW, Thompson MR, Venkatesan R. Magnetic resonance imaging: physical principles and sequence design. Wiley-Liss; New York: 1999. [Google Scholar]
- 44.Peters JA, Huskens J, Raber DJ. Lanthanide induced shifts and relaxation rate enhancements. Prog Nucl Magn Reson Spect. 1996;28:283–350. [Google Scholar]
- 45.Sun PZ, Farrar CT, Sorensen AG. Correction for artifacts induced by B0 and B1 field inhomogeneities in pH-sensitive chemical exchange saturation transfer (CEST) imaging. Magn Reson Med. 2007;58:1207–15. doi: 10.1002/mrm.21398. [DOI] [PubMed] [Google Scholar]
- 46.Shah T, Lu L, Dell KM, et al. CEST-FISP: A novel Technique for Rapid Chemical Exchange Saturation Transfer MRI at 7 T. Magn Reson Med. 2011;65:432–37. doi: 10.1002/mrm.22637. [DOI] [PMC free article] [PubMed] [Google Scholar]
- 47.Stancanello J, Terreno E, Delli Castelli D, et al. Development and validation of a smoothing-splines-based correction method for improving the analysis of CEST-MR images. Contrast Media Mol Imaging. 2008;3:136–49. doi: 10.1002/cmmi.240. [DOI] [PubMed] [Google Scholar]