Abstract
Despite the magnitude of the Ebola virus disease (EVD) outbreak in West Africa, there is still a fundamental lack of knowledge about the pathophysiology of EVD1. In particular, very little is known about human immune responses to Ebola virus (EBOV)2,3. Here, we have for the first time evaluated the physiology of the human T cell immune response in EVD patients at the time of admission at the Ebola Treatment Center (ETC) in Guinea, and longitudinally until discharge or death. Through the use of multiparametric flow cytometry established by the European Mobile Laboratory in the field, we have identified an immune signature that is unique in EVD fatalities. Fatal EVD was characterized by high percentage of CD4 and CD8 T cells expressing the inhibitory molecules cytotoxic T-lymphocyte-associated protein 4 (CTLA-4) and programmed cell death-1 (PD-1), which was correlated with elevated inflammatory markers and high virus load. Conversely, surviving individuals showed significantly lower expression of CTLA-4 and PD-1 as well as lower inflammation despite comparable overall T cell activation. Concommittant with virus clearance, survivors mounted a robust EBOV-specific T cell response. Our findings suggest that dysregulation of the T cell response is a key component of EVD pathophysiology.
Main Text
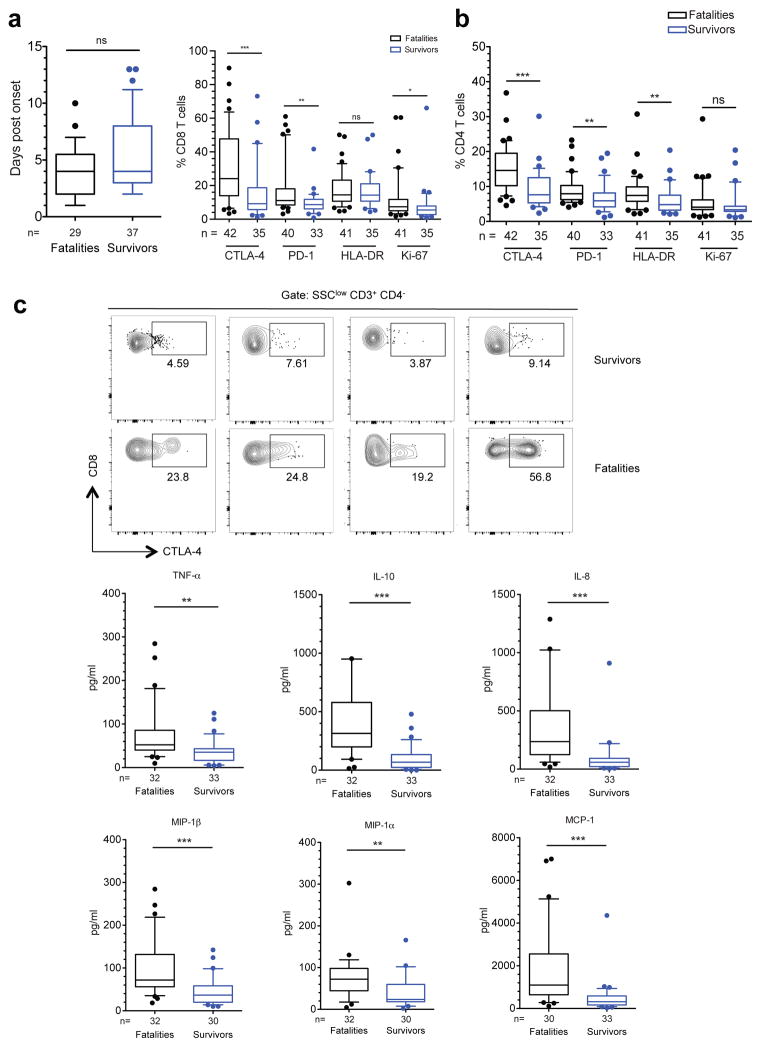
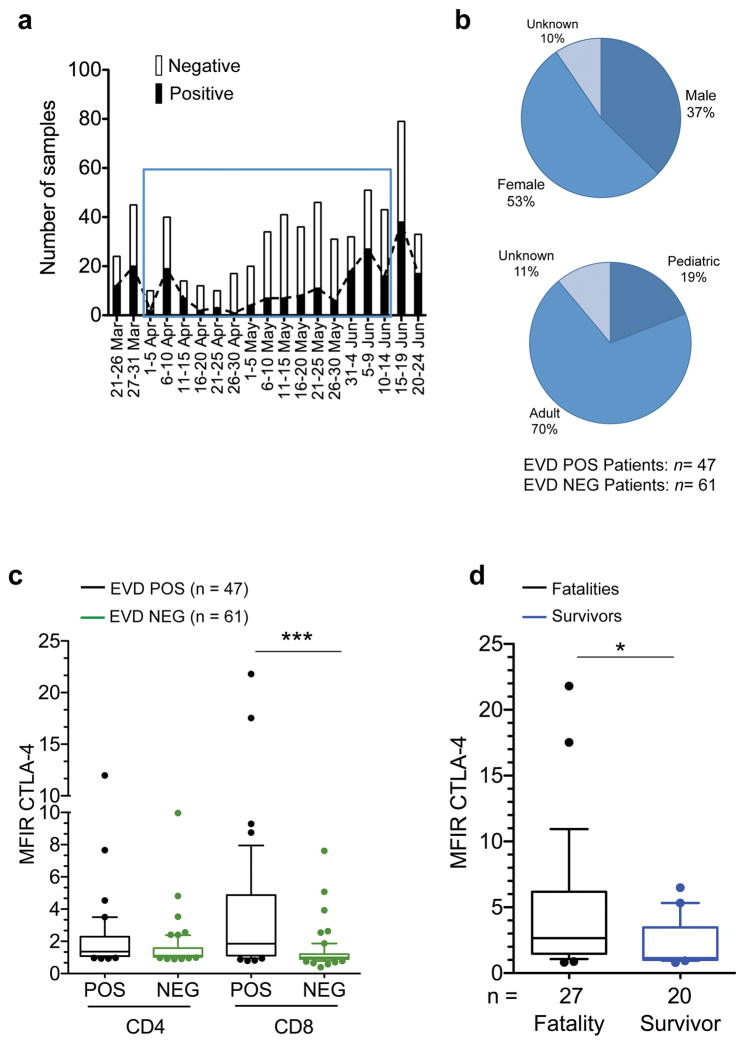
During the initial months of the EVD outbreak in Guinea, we transferred leftover blood samples from EVD patients diagnosed by the EMLab in Guéckédou (n = 47) to Europe (Extended Data Fig. 1a and 1b). Immunophenotyping analysis of these samples, indicated a significantly higher expression of cytotoxic T-lymphocyte-associated protein 4 (CTLA-4) in CD8 T cells from EVD patients compared to non-EVD patients (n = 61) (Extended Data Fig. 1c). The levels of CTLA-4 were significantly higher in CD8 T cells from fatal EVD cases compared to survivors (Extended Data Fig. 1d). CTLA-4 plays an important role in inhibiting T cell function, an immune homeostasis mechanism to control excessive or persistent T cell activation4,5. Due to its regulatory properties, there are licensed therapeutics to either antagonize or enforce CTLA-4 function6,7. Thus, we hypothesized that our findings could reflect a pathophysiological mechanism of EVD that might be amenable to therapeutics. However, we had concerns regarding the quality of the material that arrived at our laboratory after days of transport and therefore, we established flow cytometry directly in Guinea to further evaluate T cell immunity in EVD. Leftover diagnostic blood samples from 157 EVD patients tested by the EMlab at the Coyah ETC were transferred to our laboratory in Conakry within 24 h after collection (Extended Data Fig. 2a, b). The median day of admission at the ETC for both fatalities and survivors was day 4 post-symptom onset and, thus, outcome was not associated with the time elapsed between onset of disease and admission (Fig. 1a).
Figure 1. Immune signature of EVD at the time of admission.
a, Day of symptom onset at admission. b, Frequencies of CD8 T cells (left) and CD4 T cells (right) positive for the indicated markers. Black boxes represent fatal cases and blue boxes represent survivors. c, Plots of four survivors and four fatalities showing frequencies of CTLA-4+ CD8 T cells. d, Levels of plasma cytokines in fatal vs surviving EVD cases. Statistical analysis was performed by Mann-Whitney test: ns, not significant; * p≤0.05; ** p≤0.01; *** p≤0.001.
First, we evaluated the immune status of EVD patients at their arrival to the ETC. Due to the limitation to six parameters in our field analyses (Extended Data Fig. 3), we focused on the evaluation of individual markers of T cell function. We determined the expression levels of human leucocyte antigen (HLA)-DR and Ki-67 as markers of activated T cells8, as well as programmed cell death protein 1 (PD-1) and CTLA-4, which together are key regulators of T cell homeostasis5,9. The percentage of CD4 and CD8 T cells expressing CTLA-4 and PD-1 was significantly higher in fatal cases compared with survivors (Fig. 1b). Sometimes more than 50% of total CD8 T cells expressed CTLA-4 (Fig. 1c). Fatal cases showed also higher frequency of Ki-67+ CD8 T cells and HLA-DR+ CD4 T cells than survivors (Fig. 1b).
High expression of both PD-1 and CTLA-4 has been correlated with functional exhaustion (loss of function) of T cells in chronic inflammatory conditions9–11. However, the role of these molecules during acute infection is less well understood. In previous studies, expression of CTLA-4 and PD-1 in T cells correlated with the extent of pro-inflammatory responses against hantavirus and influenza virus among others12–14. Thus, we next evaluated the levels of pro- and anti-inflammatory cytokines in fatal and non-fatal EVD. In agreement with previous reports15,16, fatal EVD cases had significantly higher levels of serum pro-inflammatory cytokines (tumor necrosis factor [TNF]-α and interleukin [IL]-8) (Fig. 1d). Moreover, the levels of pro-inflammatory chemokines (macrophage inflammatory protein [MIP]-1α, MIP-1β and monocyte chemotactic protein [MCP]-1) were also significantly upregulated in fatalities (Fig. 1d). Levels of anti-inflammatory cytokines such as IL-10 were also higher in fatalities suggesting the onset of compensatory homeostatic mechanisms in response to excessive inflammation, consistent with expression of T cell inhibitory molecules such as CTLA-4 and PD-1.
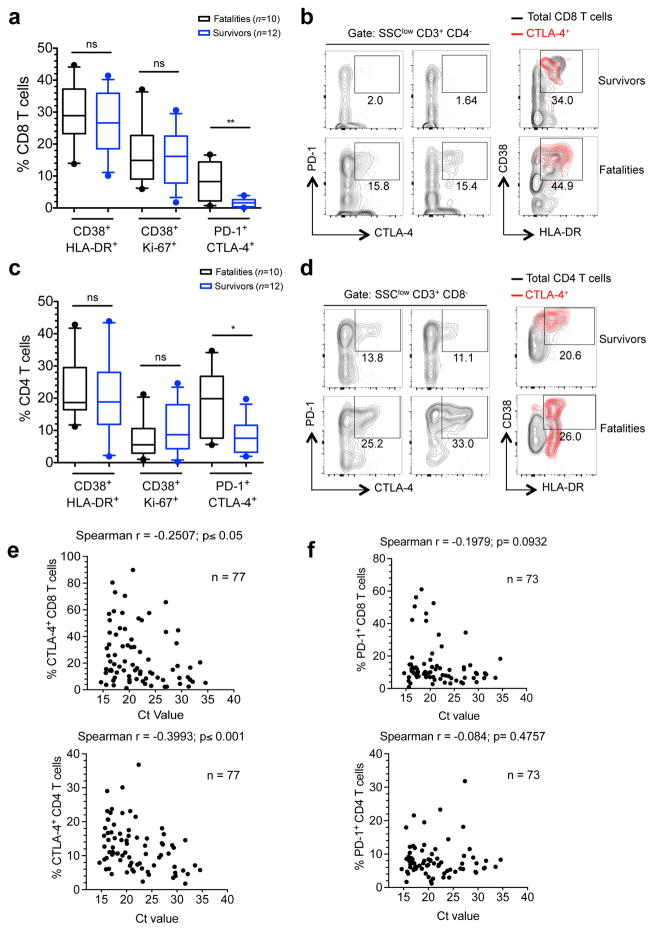
To gain insight into the correlation between CTLA-4 expression and the functional status of T cells in patients we performed analyses of T cells from cryopreserved peripheral blood leukocytes, which allowed evaluation of T cell marker co-expression (Extended Data Fig. 4). We utilized coexpression of CD38 and HLA-DR as well as CD38 and Ki-67 to define activated T cells3,8,13, and coexpression of CTLA-4 and PD-1 to identify effector T cells that had activated inhibitory mechanisms13. Our results indicated robust CD8 T cell activation in both fatal and non-fatal EVD cases with no statistically significant difference between the two groups. The frequency of activated CD8 T cells (around 30% of CD38+ HLA-DR+ and 18% of CD38+ Ki-67+) was similar to that previously reported in acute surviving medevac EVD patients3, and to that described in other acute infections13 and after vaccination8. However, the frequency of CD8 T cells co-expressing PD-1 and CTLA-4 was significantly higher in fatalities (Fig. 2a and b). The results with CD4 T cells corresponded to those of CD8 T cells with no differences in the activation status between fatal and non-fatal EVD but higher frequency of cells co-expressing CTLA-4 and PD-1 in fatalities (Fig. 2c and d). CTLA-4+ T cells in both CD8 and CD4 subsets expressed high levels of CD38 and HLA-DR suggesting a discrete subset of effector T cells that have initiated a compensatory homeostatic mechanism (Fig. 2b and d).
Figure 2. Functional properties of T cells in EVD patients.
a, Frequencies of CD8 T cells co-expressing the indicated markers. b, Plots of two surviving and two fatal EVD patients depicting CD8 T cell populations co-expressing the indicated markers. Overlays indicate activation status of CTLA-4+ CD8 T cells (red). Total CD8 T cells are represented by black contours. c, CD4 T cells co-expressing the indicated markers. d, Plots of two surviving and two fatal patients depicting CD4 T cell populations co-expressing the indicated markers. Overlays indicate activation status of CTLA-4+ CD4 T cells (red). Total CD4 T cells are represented by black contours. e, Correlation between frequency of CD8 T cells (upper graph) and CD4 T cells (lower graph) expressing CTLA-4 and Ct values. f, Correlation between the frequency of CD8 T cells (upper graph) and CD4 T cells (lower graph) positive for PD-1 and Ct values. Statistics was performed by Mann-Whitney test. ns, not significant; * p≤0.05; ** p≤0.01.
Whether or not CTLA-4 overexpression affects T cell-mediated viral clearance is controversial. While some reports have correlated the frequency of CD8 T cells expressing CTLA-4 with poor viral clearance14, others do not support this hypothesis17. To explore the relation between CTLA-4 and PD-1 expression and virus loads during EVD we analyzed whether the percentage of T cells expressing CTLA-4, PD-1, or both, correlated with the threshold cycle (Ct) values of the EBOV real-time PCR. Fatal EVD cases had significantly lower Ct values at the time of admission in agreement with the Ct value being a strong predictor of outcome18–20 (Extended Data Fig. 2c–e). The Ct value negatively correlated with the percentage of T cells expressing CTLA-4 as well as the percentage of CD8 T cells co-expressing CTLA-4 and PD-1 (Fig. 2e and Extended Data Fig. 5a). However, the percentage of T cells expressing PD-1 alone did not correlate with the Ct value (Fig. 2f). In summary, expression of CTLA-4 alone and in combination with PD-1 correlated with high viremia.
Acute lymphopenia triggers proliferation of naïve T cells with very low expression of CTLA-4 and PD-121. Thus, we reasoned that differences in EBOV-induced lymphopenia2, could be a confusion variable in our study. However, there were no differences in circulating peripheral blood T cells between fatal and non-fatal EVD cases (Extended Data Fig. 5b). A recent study comparing infection with the Makona vs. Mayinga variants of EBOV in non-human primates found evidence of initial leukocytosis followed by moderate lymphopenia with no overall differences between both EBOV variants22. Initial leukocytosis in patients infected with the Makona variant of EBOV has been also observed23,24, which indicates the need of longitudinal evaluation of hematological parameters in patients infected with EBOV Makona, an approach that was not possible in our study due to the lack of statistically relevant numbers of fatal cases with longitudinal sampling.
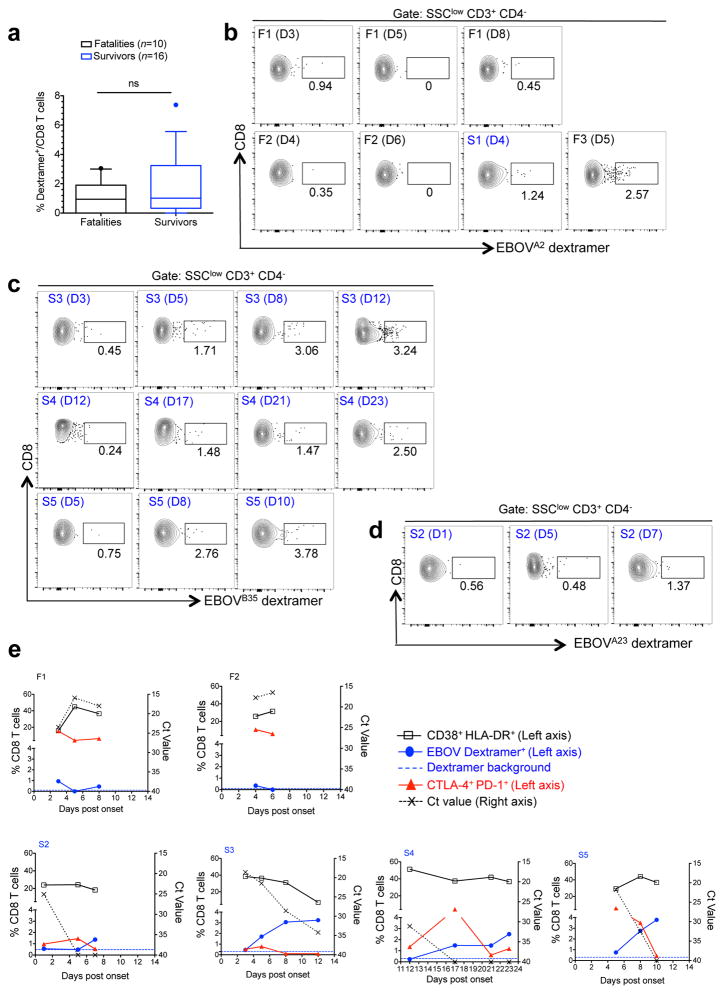
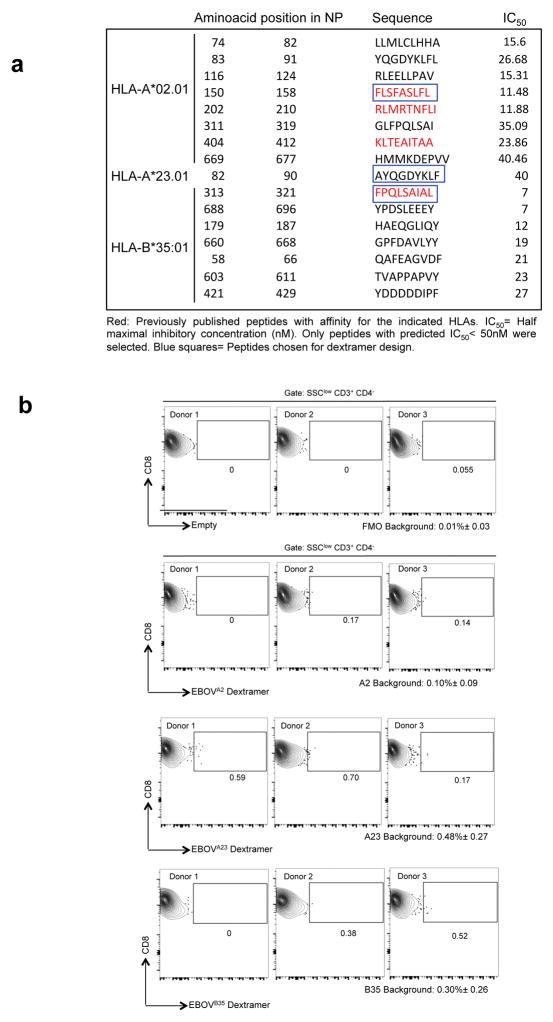
To link the observed activation of CD8 T cells with EBOV-specific responses, we sought to track EBOV-specific CD8 T cells during infection through the use of HLA class I dextramers. We first performed in silico analysis of EBOV nucleoprotein (NP)-derived peptides predicted to bind with high affinity to selected HLA alleles common in West Africa (HLA-A*02:01, HLA-A*23:01 and HLA-B*35:01)25 and designed dextramers (Extended Data Fig. 6). We chose the EBOV NP based on previous reports indicating that NP drives most of the CD8 T cell response26,27. Dextramer-matching HLA alleles were identified in 26 patients via sequencing of the HLA locus. Six patients (2 fatal and 4 survivors) had more than one sample for longitudinal evaluation of EBOV-specific T cell responses. These included two fatal cases (F1 and F2) and four survivors (S2–S5). S3 and S4 were treated with favipiravir, and all the other patients received only supportive therapy. At the time of admission, the differences in the percentage of EBOV-specific T cells between fatalities and survivors were not statistically significant (Fig. 3a). However, differences became evident during later stages of infection. The fatal cases with longitudinal sampling (F1 and F2) showed a high frequency of PD-1+ CTLA-4+ CD8 T cells until death, but barely detectable EBOV-specific CD8 T cells (Fig. 3b and e). In contrast, an increase in the frequency of EBOV-specific CD8 T cells was observed in survivors in coincidence with virus clearance and decrease of the PD-1+ CTLA-4+ CD8 T cell population (Fig. 3c, d and e).
Figure 3. Longitudinal evaluation of EBOV-specific T cell immunity.
a, Frequency of EBOV-specific CD8 T cells in EVD patients at admission. Statistics was performed by Mann-Whitney test: ns, not significant. b, Frequency of CD8 T cells specific for the HLA-A*02:01-restricted peptide FLSFASLFL. Two fatal patients (F1 and F2, see panel d) are shown and day of sample evaluation post-onset is indicated between brackets. A surviving patient (S1) and fatal patient (F3) are shown for positive HLA-A*02:01 dextramer staining. c, Frequencies of CD8 T cells specific for the HLA-B*35:01-restricted FPQLSAIAL peptide are shown in survivors (S3, S4 and S5) with serial sampling. d, Plots of one survivor (S2) showing staining of EBOV-specific CD8 T cells restricted for HLA-A*23:01 AYQGDYKLF. e, Longitudinal patient data at the indicated days after symptom onset. Left axis represents the frequency of CD8 T cells co-expressing CD38 and HLA-DR (black), CTLA-4 and PD-1 (red) and dextramer positive cells (blue). Dextramer background was assessed in HLA-matched healthy donors (Extended Data Fig. 6b), and background dextramer staining is shown as dashed blue lines. The corresponding flow cytometry plots are shown in panels a-d. Ct values are represented for each patient with dashed lines and values depicted in the right axis.
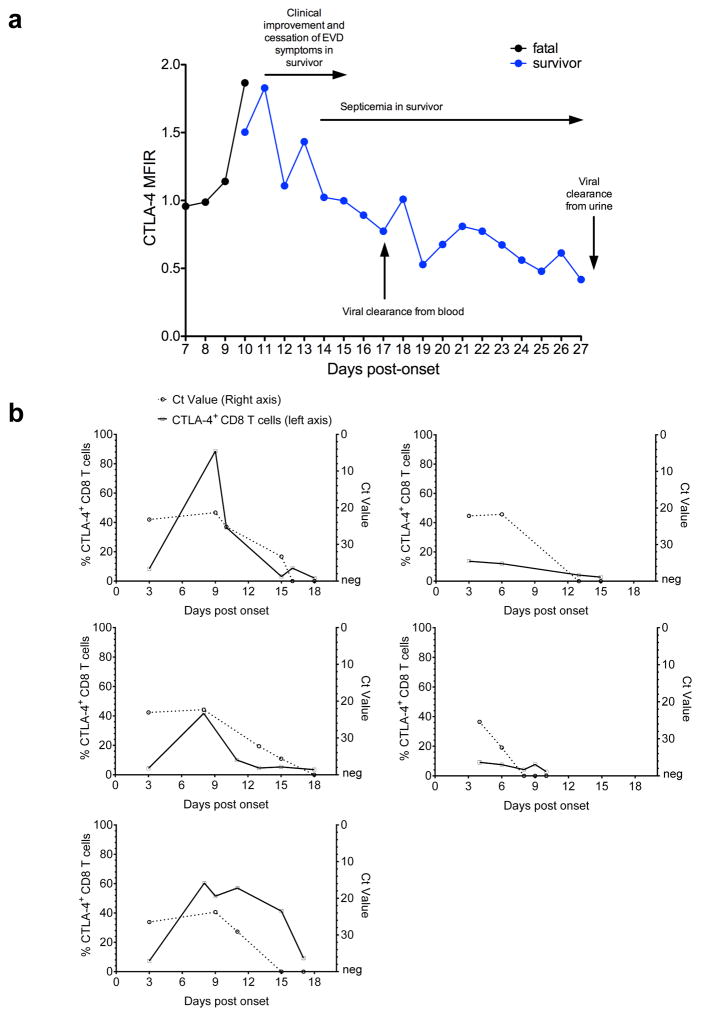
These findings were substantiated by the kinetics of CTLA-4 expression in two EVD patients, one fatality and one survivor, evacuated to Europe as well as five survivors treated in Coyah, Guinea. Longitudinal analysis of these patients revealed persistent upregulation of CTLA-4 in the fatal case and transient upregulation in survivors (Extended Data Fig. 7). Of note, the increase of EBOV-specific T cells in the surviving patients coincided with contraction rather than expansion of the CD38+ HLA-DR+ subset (Fig. 3e). Despite the fact that the phenotype of activated T cells (CD38+ HLA-DR+), suggests engagement of the T cell receptor (TCR) and not bystander T cell activation8, our findings may point to the presence of non-EBOV specific T cells within the CD38+ HLA-DR+ compartment.
The main hypothesis drawn from our data is that differences between the T cell response of fatal and surviving EVD patients are centered in the mechanisms that regulate T cell homeostasis. While all patients showed T cell activation irrespective of outcome, it was the expression of the regulatory molecules CTLA-4 and PD-1 on peripheral blood T cells that marked fatal EVD and correlated with high viremia, a known predictor of poor outcome19,20. We hypothesize that this upregulation reflects a compensatory mechanism to excess inflammatory stimuli, which is consistent with the concomitant expression of pro-inflammatory cytokines in fatal cases. However our findings do not indicate causality between expression of CTLA-4/PD-1 and poor outcome: on one hand it is possible that high viremia triggers overwhelming inflammation thereby causing CTLA-4 and PD-1 upregulation on T cells, and on the other hand, it is plausible to assume that expression of these molecules inhibits T cell function leading to poor viral clearance. Indeed, both possibilities have been reported in the literature13,28 and their elucidation requires evaluation of CTLA-4 function during EVD in adequate infection models. Interestingly, during severe EVD both PD-1 and CTLA-4 are upregulated while in other acute human infections such as hantavirus disease and pediatric influenza only CTLA-4 but not PD-1 was upregulated13,14. These results suggest that different infections trigger specific regulatory mechanisms, the balance of which is vital for optimal T cell function. Robust T cell activation was observed in both fatal and non-fatal EVD cases as reflected by similar levels of discrete CD8 and CD4 T cells co-expressing CD38 and HLA-DR. These results are in agreement with the strong T cell activation observed in surviving US patients3 and strengthens the notion that EVD is characterized by immune activation. Although limited, our dextramer data suggest that both fatal and non-fatal cases are able to mount EBOV-specific T cell responses. However, while in survivors the PD-1+ CTLA-4+ CD8 T cell compartment contracted in conjunction with viral clearance, formation of EBOV-specific T cells and recovery, this did not seem to be the case in fatal EVD. One plausible explanation for this finding is that the high expression of CTLA-4 observed in activated T cells of fatal cases promote cell extrinsic inhibition of EBOV-specific T cells. T cell extrinsic CTLA-4 functions have been demonstrated in vivo and involve different mechanisms such as stripping of T cell co-stimulatory molecules from antigen-presenting cells, stimulation of regulatory T cells and local tryptophan starvation among others5,29,30. Further functional experiments with adequate in vivo models are needed to explore the role of regulatory T cell molecules during EVD and to test whether their modulation may serve as a putative post-exposure therapy against EVD.
Methods
Patients
EVD patients included in the study were managed at the Ebola Treatment Centers in Gueckedou (n = 47) and Coyah (n = 157) under the medical care of Médecins sans Frontières and doctors deployed by the Cuban government, respectively. Patients with malaria co-infection were excluded from the study. Two patients evacuated into Europe for medical treatment were included in the study for longitudinal analysis. One patient was treated at the University Medical Center Hamburg-Eppendorf, Hamburg, Germany, and the other one at the Hospital La Paz, Madrid, Spain. Demographic and outcome data for EVD patients were obtained from databases of the World Health Organization. The National Committee of Ethics in Medical Research of Guinea as well as the Ethics Committee of the Medical Association of Hamburg approved the use of diagnostic leftover samples and corresponding patient data for this study (permits Nº11/CNERS/14 and PV4910). This study was also approved by the protocol review office of the US National Cancer Institute institutional review board. As the samples had been collected as part of the public health response to contain the outbreak in Guinea, informed consent was not obtained from patients. Informed consent was obtained from the two EVD patients treated in Hamburg and Madrid.
Study samples and flow cytometry analysis
Real-time RT-PCR was performed on EDTA-blood of patients with suspected EVD using the RealStar Ebolavirus RT-PCR Kit 1.0 (Altona Diagnostics) at the European Mobile Laboratory (EMLab) units in Gueckedou and Coyah. Malaria was diagnosed using a rapid test. Whole blood samples from Gueckedou were shipped to the biosafety level 4 (BSL-4) laboratory in Hamburg within 1–3 weeks after collection and processed immediately upon arrival via multiparametric flow cytometry.
Leftover samples from Coyah were shipped within 24 h after collection to the EMLab immunology laboratory at Donka Hospital in Conakry. PBMCs were isolated after sedimentation of cells in EDTA whole blood tubes. Red blood cells were lysed with Red Blood Cell Lysing buffer (BD Biosciences). PBMCs were processed immediately upon reception for immunophenotypic analysis or were cryopreserved and transported to the BSL-4 laboratory in Hamburg. Immune phenotyping was achieved via multiparametric flow cytometry panel using a battery of commercially available antibodies as follows: Anti-human (h) anti-hCD3-APCCy7 (clone UCHT1), anti-hCD4-FITC (clone OKT4), anti-hCD8-PeCy7 (clone RPAT8), anti-hCD152 (CTLA-4)-PE (clone L3D10), anti-hCD279 (PD-1)-APC (clone EH12-2HT), anti-hHLA-DR-PerCP Cy5.5 (clone L243), anti-hKi67-PE (clone 16A8), anti-hCD38-APC (clone HB-7). All antibodies were from Biolegend. Single-cell PBMC suspensions were incubated with live/dead discrimination dye (Zombie-NIR from Biolegend) followed by FACS block (Human TruStain Fc receptor blocking antibodies from Biolegend) for 20 min followed by staining with antibodies against extracellular antigens. After extracellular staining samples were inactivated in Cytofix/Cytoperm (BD) buffer in the presence of 4% formaldehyde followed by staining with intracellular antibodies (anti-CD3, Ki-67 and CTLA-4). Sample acquisition was done in a Guava easyCyte 8 Flow Cytometer from Millipore in Guinea. In Hamburg, samples were thawed at 37°C and the sample volume transferred to ice-cold 15ml falcon tubes where 5 ml ice-cold R8 medium (RPMI + 8% FBS) were added. Sample tubes were then centrifuged to remove the cryopreservant (10% DMSO) 1000 rpm for 10 min and resuspended in R8 medium. Samples were centrifuged once more and the pelleted cells were washed with 12 ml of ice-cold R8 medium. Samples were processed as indicated above. In experiments involving dextramer staining, samples were incubated in a volume of 50 μl of PBS with 5μl of the indicate dextramers (1/10 dilution) prior to extracellular antibody staining. All dextramers were purchased from Immudex. Samples were acquired in a LSR Fortessa instrument (BD). Flow cytometry analysis was done with FlowJO software (Treestar).
In silico peptide analysis
Prediction of EBOV NP-derived peptide binding to selected human HLA alleles was achieved using an artificial neural network method at the Immune Epitope Database and Analysis Resource (IEDB) (www.iedb.org). Selected peptides (IC50 <50 nM) were then cross-checked with two additional matrix-prediction algorithms, BIMAS (http://www-bimas.cit.nih.gov) and SYFPEITHI (http://www.syfpeithi.de). Peptides predicted by all three bioinformatic tools were selected and screened for similarity to the human genome using the NIH Blast server. Peptides showing homology to the human proteome were discarded.
Multiplex ELISA
Concentrations of selected cytokines and chemokines were measured in 1:2 diluted plasma samples using Milliplex® Map Human Cytokine/Chemokine Magnetic Bead Panel (EMD Millipore, Missouri, USA) on the Luminex platform LX200 (Luminex, Austin, USA). The procedure was performed according to the manufacturer’s instructions.
HLA genotyping
High-resolution genotyping for HLA class I loci was performed by polymerase chain reaction–sequence-based typing, as recommended by the 13th International Histocompatibility Workshop (available at: http://www.ihwg.org/tmanual/TMcontents.htm). HLA sequences were analyzed using the ASSIGN software (Conexio Genomics).
Statistical analysis
Non-parametric statistics and plots were performed in Graphpad Prism software as described in the figure legends. Sample distribution was illustrated throughout the manuscript via box-and-whisker plots. In all figures the boxes extend from the 25th to 75th percentiles and the horizontal bar is plotted as the median. The bars (whiskers) represent sample distribution down to the 10th percentile (lower bar) and up to the 90th percentile (upper bar).
Extended Data
Extended Data Figure 1. Initial immunophenotyping data from Guéckédou.
a, Graph depicting the number of samples tested by the EMLab unit in Guéckédou by function of time since the beginning of the outbreak. The blue square indicates the period in which leftover whole blood samples from the diagnostic activities were shipped to the BSL-4 laboratory in Hamburg for initial immunophenotyping. b, Demographic data of the Guéckédou EVD patient cohort. Adults were ≥ 18 years of age and pediatric patients were < 18 years of age. c, Comparison of the expression of CTLA-4 assessed by Median Fluorescence Intensity Ratio (MFIR) in CD4 and CD8 T cells of EVD patients (POS, black boxes) and non-EVD controls (NEG, green boxes). MFIR represents the ratio between the CTLA-4-specific signal divided by the Fluorescence Minus One (FMO) signal of the same cell population. d, Comparison between CTLA-4 MFIR values in CD8 T cells from fatal (black) vs. surviving (blue) EVD cases. In all panels the ends of the whiskers in the box-and-whisker plots represent the 10th and 90th percentile, respectively. Statistical analysis was performed by non-parametric Mann-Whitney test. The level of significance is indicated as follows: ns, not significant; * p≤0.05; *** p≤0.0001.
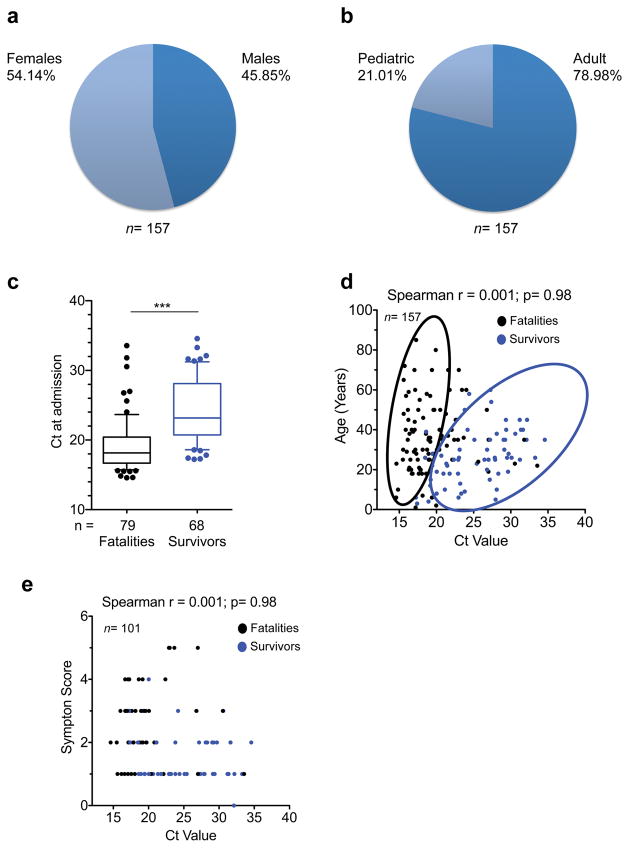
Extended Data Figure 2. Epidemiological data of patients tested by EMLab unit in Coyah.
a and b, Demographic data of the Coyah EVD patient cohort. Adults were ≥ 18 years of age and pediatric patients were < 18 years of age. The median age of the 157 patients in the study was 26 years (interquartile range (IQR) 20–38 years). Percentages of males and females were comparable within all groups, with adults accounting for 79% of patients. c, Box and whisker plots depicting statistical association between Ct values and outcome. The case-fatality ratio (CFR) was 51.6%. Fatalities and survivors were compared via non-parametric Mann-Whitney test; *** p<0.001. d, Correlation between Ct value and age of the patients. The Ct value did not correlate with age. However, survivors clustered in a group characterized by Ct value higher than 18 and by age less than 40 years (cluster encircled in blue). Statistical significance was tested by non-parametric Spearman correlation analysis. e, Ct values correlated negatively with symptom scoring, so that low Ct values were associated with severe disease symptoms. Symptom score was calculated as the summation of individual symptoms (bleeding, liver dysfunction, respiratory distress, kidney failure, neurological symptoms and anorexia) from ‘0’ (no symptoms) to ‘6’ (all symptoms present). In the box and whisker plot the ends of the whiskers represent the 10th and 90th percentile, respectively. Statistical analysis was performed by non-parametric Mann-Whitney test. The level of significance is indicated as follows: ns, not significant; * p≤0.05; *** p≤0.0001.
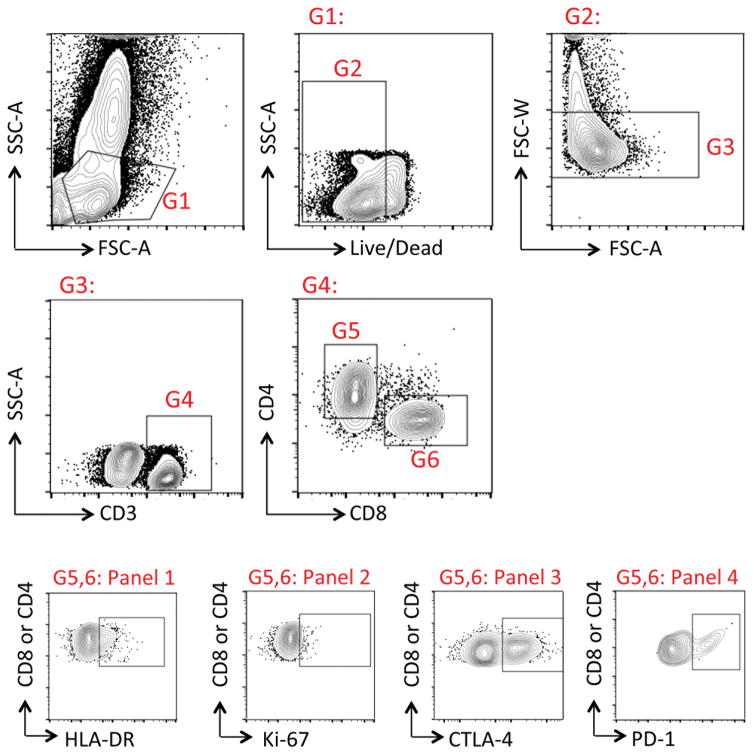
Extended Data Figure 3. Gating strategy for flow cytometry studies in Guinea.
All samples evaluated in the field were aliquoted for four panels. All panels had the following common gating: G1: Lymphocyte gate; G2: Live cells; G3: Singlets; G4: T cells; G5: CD4 T cells; G6: CD8 T cells. Panel 1 Panel 1, 2, 3, and 4 evaluated expression of HLA-DR, Ki-67, CTLA-4, and PD-1, respectively, in either CD4 or CD8 T cells.
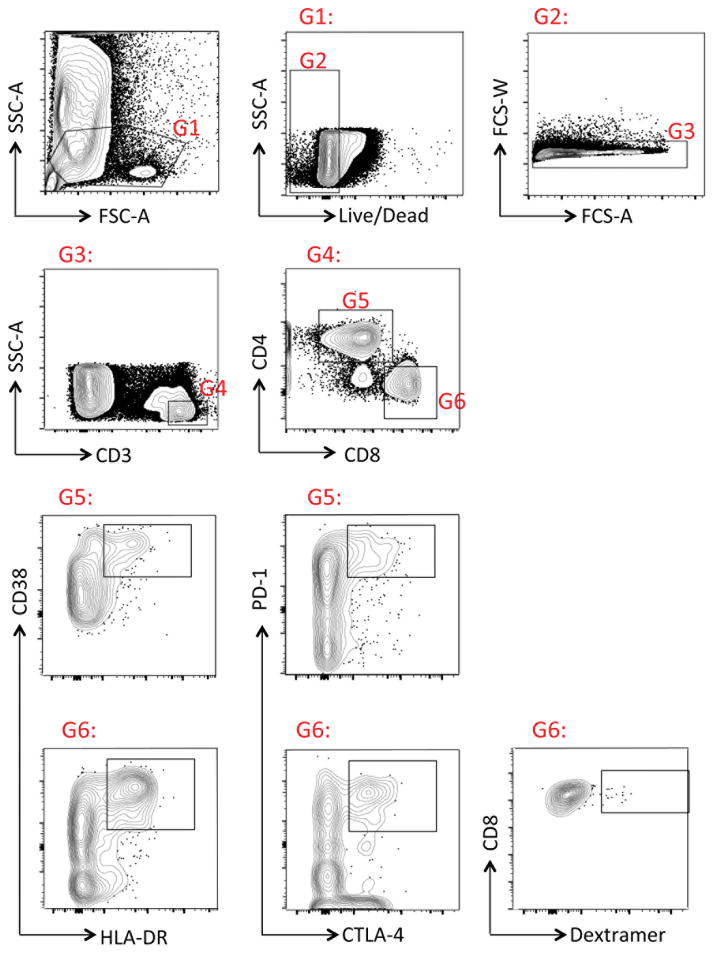
Extended Data Figure 4. Gating strategy for flow cytometry in Hamburg.
Cryopreserved PBMC samples from Coyah were thawed as indicated in the Methods section. The following gates were used for sample analysis: G1: Lymphocyte gate; G2: Live cells; G3: Singlets, G4: T cells; G5: CD4 T cells; G6: CD8 T cells. In G5 or G6, samples were evaluated for co-expression of the indicated cell markers. Dextramer staining was evaluated in G6 following protocols described in the Methods section.
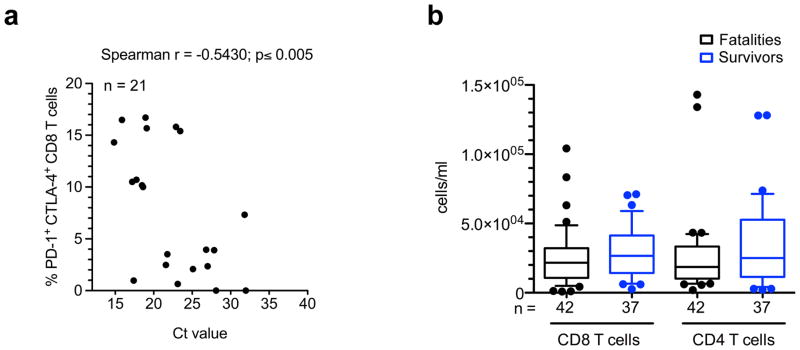
Extended Data Figure 5. Correlation of double positive PD-1+/CTLA-4+ CD8 T cells with Ct values and lymphopenia.
a, Graph showing correlation between the frequency of CD8 T cells co-expressing PD-1 and CTLA-4 and the Ct value. Correlation analysis was done via non-parametric Spearman correlation test. b, Box and whisker plots depicting the concentration of CD4 and CD8 T cells in blood of fatal and surviving EVD patients. The ends of the whiskers in the box-and-whisker plots represent the 10th and 90th percentile, respectively.
Extended Data Figure 6. In silico peptide analysis and dextramer design.
a, Selection of peptides consisting of 9 amino acid residues corresponding to the EBOV NP sequence predicted to bind the indicated HLA alleles. IC50 values for peptide binding to HLA were predicted by the artificial neural network (ANN) at the Immune Epitope Database and Analysis Resource (IEDB) (www.iedb.org). b, Dextramer background was determined by staining of HLA-matched healthy donor peripheral blood leukocyte samples. T cells were gated as indicated in Extended Data Fig. 4. Plots in the upper row represent stainig of a FMO (fluorescent minus one) sample in which the APC channel was left empty. Lower rows show backgroud dextramer staining as indicated. The mean background staining plus minus standard deviation is indicated for each dextramer and the FMO.
Extended Data Figure 7. Longitudinal analysis of CTLA-4 expression in the CD8 T cell compartment during the course of EVD in two patients.
a, Graph depicts the levels of expression of CTLA-4 in CD8 T cells of a fatal vs. a surviving EVD case over the course of disease. Both patients were treated in Europe. Samples were taken at consecutive days starting immediately after patient admission as indicated. MFIR represents the ratio between the CTLA-4-specific signal divided by the Fluorescence Minus One (FMO) signal of the same cell population. b, Longitudinal analysis of CTLA-4 expression in CD8 T cells and Ct values in survivors from Coyah.
Supplementary Material
Acknowledgments
We thank the African Union, MSF and WHO field teams and the Guinean health authorities in Guéckédou, Coyah and Conakry for their commitment and cooperation. We also thank Prof. Jennifer Snyder-Cappione (Boston University) and Prof. Marcus Altfeld (Heinrich Pette Institute) for technical support. The EMLab is a technical partner of the WHO Emerging and Dangerous Pathogens Laboratory Network (EDPLN), and the Global Outbreak Alert and Response Network (GOARN) and the deployments in West Africa have been coordinated and supported by the GOARN Operational Support Team at WHO/HQ. This work was carried out in the context of the project EVIDENT (Ebola virus disease: correlates of protection, determinants of outcome, and clinical management) that received funding from the European Union’s Horizon 2020 research and innovation program under grant agreement No 666100 and in the context of service contract IFS/2011/272-372 funded by Directorate-General for International Cooperation and Development. The project was further supported by grant GU 883/4-1 from the German Research Foundation. This project has been funded in in part with funds from the Spanish National Plan for Research and Development ISCIII and FEDER RD12/0018/006 as well as federal funds from the Frederick National Laboratory for Cancer Research, under Contract No. HHSN261200800001E. The content of this publication does not necessarily reflect the views or policies of the Department of Health and Human Services, nor does mention of trade names, commercial products, or organizations imply endorsement by the U.S. Government. This Research was supported in part by the Intramural Research Program of the NIH, Frederick National Lab, Center for Cancer Research. A. L. is a recipient of a pre-doctoral fellowship from the Leibniz Center of Infection. Z.K. is a recipient of a fellowship from the European Program for Public Health Microbiology Training (EUPHEM).
Footnotes
Supplementary Information is linked to the online version of the paper at www.nature.com/nature
The authors declare no competing financial interests.
Author contributions P.R., L.O, A.L. and B.B-Z. performed all the experiments of this study and contributed equally. Authors affiliated with the Cuban medical teams, Médecins sans Frontières, Infectious Diseases Unit, Internal Medicine Service, Hospital La Paz, and the University Medical Center Hamburg-Eppendorf treated all the patients in this study and provided samples. All authors affiliated with the European Mobile Laboratory Consortium performed EVD diagnostics, collected samples in the field and/or coordinated EMLab operations and sample shipment to Conakry and Hamburg. Authors affiliated with WHO provided the logistics necessary to perform this study. A.S., E.S., P.F., N.O. and B.D. provided patient outcome, epidemiology and demographic data. E.H. and T.J. provided support for data analysis. B.K. provided logistic support for the EVIDENT project teams. G.X. and M.C. performed HLA typing. S.G. coordinated the study. C.M-F. designed the study, performed experiments and wrote the manuscript with S.G. All authors discussed the results and commented on the manuscript.
References
- 1.Messaoudi I, Amarasinghe GK, Basler CF. Filovirus pathogenesis and immune evasion: insights from Ebola virus and Marburg virus. Nat Rev Microbiol. 2015;13:666–676. doi: 10.1038/nrmicro3524. [DOI] [PMC free article] [PubMed] [Google Scholar]
- 2.Baize S, et al. Defective humoral responses and extensive intravascular apoptosis are associated with fatal outcome in Ebola virus-infected patients. Nat Med. 1999;5:423–426. doi: 10.1038/7422. [DOI] [PubMed] [Google Scholar]
- 3.McElroy AK, et al. Human Ebola virus infection results in substantial immune activation. Proc Natl Acad Sci USA. 2015;112:4719–4722. doi: 10.1073/pnas.1502619112. [DOI] [PMC free article] [PubMed] [Google Scholar]
- 4.Best JA, et al. Transcriptional insights into the CD8(+) T cell response to infection and memory T cell formation. Nat Immunol. 2013;14:404–412. doi: 10.1038/ni.2536. [DOI] [PMC free article] [PubMed] [Google Scholar]
- 5.Walker LSK, Sansom DM. The emerging role of CTLA4 as a cell-extrinsic regulator of T cell responses. Nat Rev Immunol. 2011;11:852–863. doi: 10.1038/nri3108. [DOI] [PubMed] [Google Scholar]
- 6.Linsley PS, et al. Immunosuppression in vivo by a soluble form of the CTLA-4 T cell activation molecule. Science. 1992;257:792–795. doi: 10.1126/science.1496399. [DOI] [PubMed] [Google Scholar]
- 7.Kvistborg P, et al. Anti-CTLA-4 therapy broadens the melanoma-reactive CD8+ T cell response. Sci Transl Med. 2014;6:254ra128. doi: 10.1126/scitranslmed.3008918. [DOI] [PubMed] [Google Scholar]
- 8.Miller JD, et al. Human effector and memory CD8+ T cell responses to smallpox and yellow fever vaccines. Immunity. 2008;28:710–722. doi: 10.1016/j.immuni.2008.02.020. [DOI] [PubMed] [Google Scholar]
- 9.Okazaki T, Chikuma S, Iwai Y, Fagarasan S, Honjo T. A rheostat for immune responses: the unique properties of PD-1 and their advantages for clinical application. Nat Immunol. 2013;14:1212–1218. doi: 10.1038/ni.2762. [DOI] [PubMed] [Google Scholar]
- 10.Kaufmann DE, et al. Upregulation of CTLA-4 by HIV-specific CD4+ T cells correlates with disease progression and defines a reversible immune dysfunction. Nat Immunol. 2007;8:1246–1254. doi: 10.1038/ni1515. [DOI] [PubMed] [Google Scholar]
- 11.Wherry EJ. T cell exhaustion. Nat Immunol. 2011;12:492–499. doi: 10.1038/ni.2035. [DOI] [PubMed] [Google Scholar]
- 12.Hafalla JCR, et al. The CTLA-4 and PD-1/PD-L1 inhibitory pathways independently regulate host resistance to Plasmodium-induced acute immune pathology. PLoS Pathog. 2012;8:e1002504. doi: 10.1371/journal.ppat.1002504. [DOI] [PMC free article] [PubMed] [Google Scholar]
- 13.Lindgren T, et al. Longitudinal analysis of the human T cell response during acute hantavirus infection. J Virol. 2011;85:10252–10260. doi: 10.1128/JVI.05548-11. [DOI] [PMC free article] [PubMed] [Google Scholar]
- 14.Ayukawa H, et al. Expression of CTLA-4 (CD152) in peripheral blood T cells of children with influenza virus infection including encephalopathy in comparison with respiratory syncytial virus infection. Clin Exp Immunol. 2004;137:151–155. doi: 10.1111/j.1365-2249.2004.02502.x. [DOI] [PMC free article] [PubMed] [Google Scholar]
- 15.Hutchinson KL, Rollin PE. Cytokine and chemokine expression in humans infected with Sudan Ebola virus. J Infect Dis. 2007;196(Suppl 2):S357–63. doi: 10.1086/520611. [DOI] [PubMed] [Google Scholar]
- 16.McElroy AK, et al. Ebola hemorrhagic fever: novel biomarker correlates of clinical outcome. J Infect Dis. 2014;210:558–566. doi: 10.1093/infdis/jiu088. [DOI] [PMC free article] [PubMed] [Google Scholar]
- 17.Raué HP, Slifka MK. Pivotal advance: CTLA-4+ T cells exhibit normal antiviral functions during acute viral infection. J Leukoc Biol. 2007;81:1165–1175. doi: 10.1189/jlb.0806535. [DOI] [PubMed] [Google Scholar]
- 18.Schieffelin JS, et al. Clinical Illness and Outcomes in Patients with Ebola in Sierra Leone. N Engl J Med. 2014;371:2092–2100. doi: 10.1056/NEJMoa1411680. [DOI] [PMC free article] [PubMed] [Google Scholar]
- 19.Lanini S, et al. Blood kinetics of Ebola virus in survivors and nonsurvivors. J Clin Invest. 2015;125:4692–4698. doi: 10.1172/JCI83111. [DOI] [PMC free article] [PubMed] [Google Scholar]
- 20.de La Vega M-A, et al. Ebola viral load at diagnosis associates with patient outcome and outbreak evolution. J Clin Invest. 2015;125:4421–4428. doi: 10.1172/JCI83162. [DOI] [PMC free article] [PubMed] [Google Scholar]
- 21.Shvets A, et al. Impaired negative regulation of homeostatically proliferating T cells. Blood. 2009;113:622–625. doi: 10.1182/blood-2008-03-139964. [DOI] [PMC free article] [PubMed] [Google Scholar]
- 22.Marzi A, et al. Delayed Disease Progression in Cynomolgus Macaques Infected with Ebola Virus Makona Strain. Emerging Infect Dis. 2015;21:1777–1783. doi: 10.3201/eid2110.150259. [DOI] [PMC free article] [PubMed] [Google Scholar]
- 23.Kreuels B, et al. A Case of Severe Ebola Virus Infection Complicated by Gram-Negative Septicemia. N Engl J Med. 2014;371:2394–2401. doi: 10.1056/NEJMoa1411677. [DOI] [PubMed] [Google Scholar]
- 24.Wolf T, et al. Severe Ebola virus disease with vascular leakage and multiorgan failure: treatment of a patient in intensive care. Lancet. 2014;385:1428–1435. doi: 10.1016/S0140-6736(14)62384-9. [DOI] [PubMed] [Google Scholar]
- 25.Modiano D, et al. HLA class I in three West African ethnic groups: genetic distances from sub-Saharan and Caucasoid populations. Tissue Antigens. 2001;57:128–137. doi: 10.1034/j.1399-0039.2001.057002128.x. [DOI] [PubMed] [Google Scholar]
- 26.Sundar K, Boesen A, Coico R. Computational prediction and identification of HLA-A2.1-specific Ebola virus CTL epitopes. Virology. 2007;360:257–263. doi: 10.1016/j.virol.2006.09.042. [DOI] [PubMed] [Google Scholar]
- 27.Simmons G, et al. Identification of murine T-cell epitopes in Ebola virus nucleoprotein. Virology. 2004;318:224–230. doi: 10.1016/j.virol.2003.09.016. [DOI] [PubMed] [Google Scholar]
- 28.de la Fuente H, Cibrián D, Sánchez-Madrid F. Immunoregulatory molecules are master regulators of inflammation during the immune response. FEBS Lett. 2012;586:2897–2905. doi: 10.1016/j.febslet.2012.07.032. [DOI] [PMC free article] [PubMed] [Google Scholar]
- 29.Qureshi OS, et al. Trans-endocytosis of CD80 and CD86: a molecular basis for the cell-extrinsic function of CTLA-4. Science. 2011;332:600–603. doi: 10.1126/science.1202947. [DOI] [PMC free article] [PubMed] [Google Scholar]
- 30.Corse E, Allison JP. Cutting edge: CTLA-4 on effector T cells inhibits in trans. J Immunol. 2012;189:1123–1127. doi: 10.4049/jimmunol.1200695. [DOI] [PubMed] [Google Scholar]
Associated Data
This section collects any data citations, data availability statements, or supplementary materials included in this article.


