

Abstract
A Chemical Exchange Saturation Transfer (CEST) MRI contrast agent has been developed that detects sulfatase enzyme activity. The agent produces a CEST signal at 5.0 ppm before enzyme activity, and a second CEST signal appears at 9.0 ppm after the enzyme cleaves a sulfate group from the agent. The comparison of the two signals improved detection of sulfatase activity.
Keywords: NMR imaging, diagnostic agents, enzyme kinetics, sulfatases, kinetics
Graphical Abstract
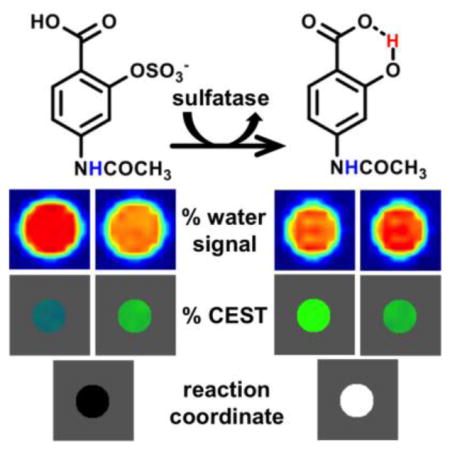
Chemical Exchange Saturation Transfer (CEST) combines the advantages of NMR chemical shifts and MR imaging to visualize enzyme activity. The % water signal is imaged as saturation frequencies are applied over a range of NMR chemical shifts, which are used to measure % CEST signals. The % CEST signal that appears from the salicylic acid moiety after sulfatase removes the sulfate group is compared to an enzyme-unresponsive % CEST signal from the aryl amide proton, which measures the reaction coordinate of enzyme activity.
Sulfatases are involved with various physiological conditions including developmental abnormalities, hormone-dependent cancer and bacterial pathogenesis.[1] Although sulfatase activities have been studied in vitro, the biological roles of sulfatases within in vivo animal models and patients are poorly understood. Fluorescent contrast agents have been developed that detect sulfatase activity,[2,3] but optical imaging methods suffer from a limited depth of view and poor spatial resolution when imaging in vivo tissues. Therefore, a new noninvasive imaging method is needed to interrogate sulfatase enzyme activity in vivo.
Magnetic resonance imaging (MRI) may potentially address this unmet need by imaging soft tissues at high resolution throughout the body.[4] Chemical Exchange Saturation Transfer (CEST) MRI is a relatively new method that generates image contrast by selectively saturating the magnetization of a proton on a CEST agent, then waiting for the proton to undergo chemical exchange with water, which transfers the saturation to water.[5,6] The chemical exchange rate of the proton on a CEST agent must be slow to generate CEST contrast, or else the great majority of the proton population leaves the agent before it can be saturated. CEST agents have been developed with protons that modulate chemical exchange rate after enzyme catalysis, which causes the CEST signal of the agent to appear or disappear. This change in CEST signal is used to detect enzyme activity, which is known as catalyCEST MRI.[7,8]
We proposed to develop a catalyCEST MRI contrast agent that can detect sulfatase enzyme activity (Figure 1a, left side). We decided to use a diamagnetic CEST agent to avoid potential toxicities that have been encountered with paramagnetic MRI contrast agents that incorporate lanthanide metals.[9] In particular, salicylic acid has been shown to generate a CEST signal at a remarkably high ~9 ppm MR frequency relative to the frequency of water (also known as the chemical shift, where the chemical shift of water is defined as 0 ppm in MRI studies).[10,11] We hypothesized that derivatizing the salicylic acid moiety with a sulfate group would eliminate the CEST signal from the salicylic acid proton, and subsequent cleavage of the sulfate group by sulfatase would cause the salicylic acid moiety to appear and produce a CEST signal (Figure 1a, right side). This “activation” of the CEST signal could then be used to detect sulfatase enzyme activity. To improve detection specificity, we included an aryl amide ligand that would be unresponsive to sulfatase activity and thereby serve as an internal control.
Figure 1.

CatalyCEST MRI of sulfatase activity. a) The aryl sulfate ligand of the substrate is cleaved by sulfatase, generating a salicylic acid moiety. The aryl amide ligand is not changed by the enzyme. b) The CEST spectra of the substrate (blue dots and lines) and product (red dots and lines) shows the appearance of a CEST signal at 9.0 ppm after the enzyme was added to the substrate, while the CEST signal at 5.0 ppm was largely unchanged. The results of Lorentzian line fitting of the CEST spectra are shown as thick lines, and represent the % CEST signal from the CEST spectra. c) MR images of the substrate and product show normalized water signals when saturation was applied at 9.0, 5.0, −5.0, or −9.0 ppm (images shown in blue-to-red scale, labeled with the saturation frequency). These images were used to produce parametric maps of % CEST signal based on Eq. [1] (blue-to-green scale). The CEST maps were then used to produce parametric maps of the reaction coordinate for the enzyme based on Eq. [2] (black-to-white scale). The CEST maps and reaction coordinate maps are masked to show the center of the sample tubes, because the edges and exterior of the tube have MR signals that are too low for meaningful analyses. Unmasked and masked images are shown in Figure S1 to provide assurance that the masking is a reasonable representation.
We synthesized 4-acedamido-2-(sulfoxy)benzoic acid (Scheme S1). The carboxylic acid and hydroxyl groups in 4-amino salicylic acid (compound 1) were functionalized to benzyl ester and benzyl alcohol to generate compound 2.[12] Then acylation of the amino group generated compound 3. Selective debenzylation of the alcohol moiety with trifluoroacetic acid produced compound 4.[13] Chlorosulfuric acid 2,2,2-trichloroethylester (TCE sulfate) was synthesized using reported procedures, and was used as the sulfating agent to generate compound 5.[14] A stepwise deprotection of the TCE group with Zn dust generated compound 6, followed by debenzylation using H2/Pd(OH)2,[15] to obtain the final compound 7 in 71% overall yield. We refer to compound 7 as the substrate for the remainder of this report.
A CEST spectrum of 45 mM of the substrate in 200 μL of Tris buffer at pH 7.2 was acquired using a standard CEST MRI procedure (Figure 1b). This spectrum showed a single CEST signal at 5.0 ppm that was assigned to the amide proton, based on the chemical shift of similar aryl amide groups.[16] Five units of sulfatase enzyme from the H. pomatia mollusk (the snail in escargot) were added to the sample and incubated for 24 h at 37°C. The sample dropped to pH 5.4, indicating that a reaction had occurred. The pH of the sample was adjusted to 7.2 to simulate buffering capacity in vivo. A CEST spectrum was acquired after enzyme reaction, and the product generated a new CEST signal at 9.0 ppm from the salicylic acid moiety while the CEST signal at 5.0 ppm from the amide ligand was largely unchanged. These results were also represented by images of the samples before and after incubation with the enzyme, which were used to create parametric maps of % CEST signal based on Eq. [1], and parametric maps of the enzyme reaction coordinate based on Eq. [2] (Figure 1c; Figure S1).
| Eq. [1] |
Where M− and M+ are the water signal amplitudes with saturation applied at at a negative and positive chemical shift value, respectively (e.g, −9 and +9 ppm).
| Eq. [2] |
The same study was performed with sulfatase enzyme from abalone mollusk (a sea snail) and A. aerogenes (a bacterial coliform), which also resulted in the appearance of a CEST signal at 9.0 ppm without changing the CEST signal at 5.0 ppm (Figure S2). The CEST spectra from these additional reactions were identical to Figure 1b, although the reaction with A. aerogenes had a broader CEST peak at 0 ppm from the direct saturation of water due to the addition of glycerol that was packaged with this enzyme by the commercial source. These additional studies demonstrated that catalyCEST MRI with this new agent could detect multiple isoforms of sulfatase.
Importantly, the ratio of the enzyme-responsive CEST signal at 9.0 ppm and the unresponsive signal at 5.0 ppm can be used to detect the sulfatase enzyme activity in a concentration-independent manner. In addition, we have shown in past studies that this ratiometric approach eliminates complications from variable T1 relaxation time and incomplete saturation during the CEST MRI protocol, and can reduce the influence of temperature to negligible levels.[17] Therefore, ratiometric catalyCEST MRI can detect sulfatase activity with this new CEST agent with good specificity for enzyme activity relative to other effects that can influence MRI contrast.
Using the substrate and the product generated with sulfatase from H. pomatia, we studied the effects of MRI saturation conditions on the CEST signal to determine clinical translatability of this approach. We used a RL-QUEST analysis method [18] to evaluate the effect of saturation time, which showed that a saturation for 4 seconds was sufficient to generate strong CEST signals from the substrate and product. (Figure 2a, Figure S3a). We then used a HW-QUESP[19] analysis method to evaluate the effect of saturation power (Figure 2b, Figure S3b). The amide for both the substrate and product could generate strong CEST signals with 3 μT that were 80% and 50% of maximum CEST signal amplitude. Although stronger CEST signals could be generated with higher saturation powers, we performed subsequent studies at 3 μT saturation power because this power level has been used for clinical studies, and the CEST signal amplitudes were sufficiently strong with 3 μT saturation. The chemical exchange rates calculated from the QUESP results for the amide proton of the substrate and product were 560 Hz and 1050 Hz. This acceleration in exchange rate was expected due to the electron withdrawing potential of the aryl carboxylate on the agent after enzyme cleavage. This increase in exchange rate was less than 2-fold, which only caused a minor change in CEST signal amplitude of the amide (Figure 1b), so that the amide’s CEST signal could still be considered largely unresponsive to sulfatase activity. The chemical exchange rate of the salicylic acid of the product was 1500 Hz, which matched previous reports of the exchange rate from similar compounds. [9]
Figure 2.

Evaluation of CEST MRI. CEST signal amplitudes from the amide of the substrate, the amide of the product, and the salicylic acid moiety of the product are shown as circles, squares, and diamonds, respectively. a) A saturation time of 4 seconds was sufficient to generate a strong CEST signal from the substrate and product. b) A saturation power of 3 μT generated sufficiently strong CEST signal for detection. c) Extrapolation of the CEST-concentration relationship for the substrate showed that 1.3 mM of substrate can generate a 1% CEST signal. d) The CEST signal amplitude of the amides are dependent on pH, while the CEST signal from the salicylic acid moiety is relatively independent of pH.
To determine the detection sensitivity of the substrate, we used a linear HW-Conc analysis method to correlate CEST signal amplitude with concentration (Figure 2c, Figure S3c). This nonlinear correlation can be extrapolated to lower concentration, which showed that a minimum of 1.3 mM of the reactant could generate a 1% CEST signal. Therefore, a concentration of CEST agent can detect sulfatase activity that is well below the 17 mM concentrations that cause cell toxicity with these types of compounds.[20]
To investigate if the CEST signals are dependent on pH, we acquired CEST spectra for 25 mM solutions at pH values ranging from 6.40 to 7.60 units for the substrate and the product from incubation with sulfatase from H. pomatia. The CEST signal of the amide proton of the substrate and product increased with increasing pH, which confirmed that the chemical exchange of this proton was base-catalyzed as expected.[16] The CEST signal from the salicylic acid proton of the product was relatively insensitive to pH (Figure 2d). Therefore, the ratio of the CEST signals of the product is pH-dependent, which should be taken into consideration during in vivo studies. In particular, the tumor microenvironment can be acidic and reach pH values between 6.4 and 7.0,[21,22] that would cause the ratio of CEST signals from salicylic acid vs. amide to be overestimated.
More recently, paramagnetic CEST agents have been shown to cause T2 relaxation due to their large chemical shifts and fast chemical exchange rates that can cause a T2 exchange relaxation process.[23] The salicylic acid moiety of the product has a remarkably high chemical shift relative to other diamagnetic CEST agents, and also has a fast exchange rate. We performed T1 and T2 MR studies with 30 mM of the substrate and the product, which was synthesized to ensure purity rather than relying on a product of an enzyme reaction (Figure S4). However the T2 relaxivities for both compounds were negligible, and the T1 relaxivities were too low to be reliably measured. Therefore this contrast agent only acts as a CEST agent.
To demonstrate the utility of this agent to detect sulfatase enzyme activity from mammalian species, we performed catalyCEST studies with HEK293 and BT549 cells. The HEK293 human embryonic cell line is known to express extracellular sulfatase enzymes,[2] while the BT549 human breast cancer cell line does not show sulfatase expression.[26] We added 100 μL of each cell suspension to 200 μL solutions of the substrate in Tris buffer at pH 7.3 and incubated for 24 h at 37°C. The pH of the solution was adjusted to 7.2 and CEST spectra were acquired for the product from incubation with both cell lines. We observed the appearance of CEST signal at 9.0 ppm after incubation with HEK293 suspension, indicating the detection of extracellular sulfatase activity from this cell line (Figure 3a). Conversely, no CEST signal appeared after incubation with BT549 suspension, demonstrating that this cell line did not express extracellular sulfatase (Figure 3b). For comparison, optical imaging agents that have been developed to detect sulfatase activity were shown to detect sulfatase activity only in bacterial cell suspensions, and could not detect sulfatase activities with HEK293 and BT549 mammalian cell suspensions.[4] This comparison suggests that the aryl sulfate esters for optical imaging could be specific for only a subset of sulfatase isoforms, while the CEST agent has more ubiquitous detection of sulfatase activity.
Figure 3.

Detection of sulfatase activity from mammalian cells. a) The CEST spectra before (blue) and after (red) incubation of the agent with HEK293 cell suspension showed the appearance of a CEST signal at 9.0 ppm. b) The same CEST MRI study with BT549 cell suspension showed no appearance of a CEST signal at 9.0 ppm. In both studies, the CEST signal at 5.0 ppm was largely unresponsive to enzyme activity. The broader linewidths of the direct saturation of water in these samples were attributed to the biological milleau of the cell suspension that typically shortens the T2 relaxation time of the sample. c, d) The CEST signals determined from fitting Lorentzian line shapes to the CEST spectra shown in panels (a) and (b) further demonstrate the detection of sulfatase activity from HEK293 cells and no sulfatase activity was detected from BT529 cells. The Lorentzian line shapes in panel (d) are almost exactly overlapped.
Our previous studies have conjugated an enzyme-cleavable ligand to the amine of compound 1 to form an amide.[16,24] Enzyme cleavage of this ligand converted the amide to an amine, causing a loss of the CEST signal from the amide, thereby causing this agent to be “deactivated”. Our CEST agent in this study improves on this previous design by “activating” the CEST signal in response to enzyme activity. Furthermore, our CEST agent in this study demonstrates that the salicylic acid moiety can be derivatized while an aryl amine can generate an enzyme-unresponsive CEST signal. This new approach expands the chemical design of catalyCEST MRI contrast agents, and the modular approach of derivatizing one or more positions of the substrate constitutes a platform technology that may be easily redesigned to detect other enzyme activities.
In conclusion, we have synthesized and characterized the first diamagnetic CEST MRI contrast agent that can detect sulfatase enzyme activity. This substrate employed the use of enzyme-responsive and unresponsive CEST signals that could be detected at potentially nontoxic concentrations and saturation conditions that are clinically translatable. This substrate can detect sulfatase activity from mammalian cells as well as from other species. Based on these preliminary studies, in vivo studies with small animal models appear warranted to facilitate the translation of catalyCEST MRI to the radiology clinic.
Experimental Section
Synthesis
Compounds 2, 3 and 4 were synthesized following reported procedures. Synthesis procedures for compounds 5, 6, and 7, and characterizations of compounds 2-7, are reported in the Supporting Information.
CEST MRI acquisition
MRI studies were performed with a Biospec MRI scanner operating at 7 T (300 MHz) magnetic field strength with a 72 mm volume transceiver coil (Bruker Biospin, Inc., Billerica, MA). The samples were maintained at 37.0±0.2 °C. The CEST-FISP acquisition protocol used the following parameters TR: 3.196 ms; TE: 1.598 ms; excitation flip angle: 30°; centric encoding during acquisition; matrix: 128 × 128; field of view: 8 × 8 cm; in-plane spatial resolution: 625 × 625 μm; slice thickness: 1 mm; number of slices: 1; number of averages: 1.[25] We acquired a series of 85 images with selective saturation applied at 3 μT for 5 seconds at saturation frequencies in 0.25 ppm increments from 15 ppm to −3 ppm and 1 ppm increments from −4 ppm to −15 ppm, for a total scan time of 7:42 min.
CEST MRI analysis
Images were processed using ParaVision v5.1, and image analyses were performed with Matlab v8.4 (Mathworks, Natick, MA). To measure amplitudes, each CEST spectrum from a region of interest in an image of a sample was analyzed by fitting the spectrum to a sum of three Lorentzian line shapes to account for two CEST signals and direct saturation of water. The center, width, and amplitude of each Lorentzian line was allowed to change to optimize the fit.
T1 and T2 MRI acquisition
T1 and T2 studies were performed using the same MRI scanner. A 25 mM solution of substrate and the chemically synthesized product, in PBS at pH 7.2, were used for these studies. All MRI experiments were performed at 37.0 °C. A spin echo MRI protocol was then employed to measure R1 relaxation rates with a 12.7 ms TE; 10 TR times between 18.339 and 10000 msec; 1 mm slice thickness; 782 × 782 mm in-plane resolution; 5 × 2.5 cm field of view; and 64 × 32 matrix. The same protocol was used to measure R2 relaxation rates with a 15–960 ms TE in increments of 15 ms; 40 sec TR time; 1.07 mm slice thickness; 400 × 400 mm in-plane resolution; 5.12 × 2.56 cm field of view; and 128 × 64 matrix size. To calculate the R1 and R2 relaxation rate, the signal amplitudes were fitted with a monoexponential function with a constant to account for a possible DC offset using ParaVision® PV5.1 (Bruker Biospin, Inc., Billerica, MA).
Supplementary Material
Acknowledgments
The authors thank the Experimental Mouse Shared Resource of the University of Arizona Cancer Center for assistance with cell preparation. The research was supported by through the NIH through grants R01CA169774 and P30CA023074.
References
- 1.Hanson SR, Best MD, Wong CH. Angew Chem Int Ed. 2004;43:5736–5763. doi: 10.1002/anie.200300632. [DOI] [PubMed] [Google Scholar]
- 2.Rush JS, Beatty KE, Bertozzi CR. Chem Bio Chem. 2010;11:2096–2099. doi: 10.1002/cbic.201000115. [DOI] [PMC free article] [PubMed] [Google Scholar]
- 3.Smith EL, Bertozzi CR, Beatty KE. Chem Bio Chem. 2014;15:1101–1105. doi: 10.1002/cbic.201400032. [DOI] [PMC free article] [PubMed] [Google Scholar]
- 4.Yoo B, Pagel MD. Front Biosci. 2008;13:1733–1752. doi: 10.2741/2796. [DOI] [PubMed] [Google Scholar]
- 5.Hancu I, Dixon WT, Woods M, Vinogradov E, Sherry DA, Lenkinski ER. Acta radiol. 2010;51:910–923. doi: 10.3109/02841851.2010.502126. [DOI] [PMC free article] [PubMed] [Google Scholar]
- 6.Liu G, Song X, Chan KW, McMahon MT. NMR Biomed. 2010;26:810. doi: 10.1002/nbm.2899. [DOI] [PMC free article] [PubMed] [Google Scholar]
- 7.Chauvin T, Durand P, Bernier M, Meudal H, Doan BT, Noury F, Tóth E. Angew Chem Int Ed. 2008;47:4370–4372. doi: 10.1002/anie.200800809. [DOI] [PubMed] [Google Scholar]
- 8.Yoo B, Sheth VR, Howison CM, Douglas MJ, Pineda CT, Maine EA, Baker AF, Pagel MD. Magn Reson Med. 2014;71:1221–1230. doi: 10.1002/mrm.24763. [DOI] [PMC free article] [PubMed] [Google Scholar]
- 9.Kuo PH, Kanal E, Abu-Alfa AK, Cowper SE. Radiol. 2007;242:647–649. doi: 10.1148/radiol.2423061640. [DOI] [PubMed] [Google Scholar]
- 10.Yang X, Yadav NN, Song X, Ray Banerjee S, Edelman H, Minn I, van Zijl P, Pomper MG, McMahon MT. Chem Eur J. 2014;20:15824–15832. doi: 10.1002/chem.201403943. [DOI] [PMC free article] [PubMed] [Google Scholar]
- 11.Li J, Feng X, Zhu W, Oskolkov N, Zhou T, Kim BK, Baig N, McMahon MT, Oldfield E. Chem Eur J. 2016;22:264–271. doi: 10.1002/chem.201503942. [DOI] [PMC free article] [PubMed] [Google Scholar]
- 12.Haftchenary S, Luchman HA, Jouk AO, Veloso AJ, Page BD, Cheng XR, Dawson SS, Grinshtein N, Shahani VM, Kerman K, Kaplan DR. ACS Med Chem Lett. 2013;4:1102–1107. doi: 10.1021/ml4003138. [DOI] [PMC free article] [PubMed] [Google Scholar]
- 13.Fletcher S, Gunning PT. Tet Lett. 2008;49:4817–4819. [Google Scholar]
- 14.Mikula H, Sohr B, Skrinjar P, Weber J, Hametner C, Berthiller F, Krska R, Adam G, Fröhlich J. Tet Lett. 2008;54:3290–3293. [Google Scholar]
- 15.Liu Y, Lien IFF, Ruttgaizer S, Dove P, Taylor SD. Org lett. 2004;6:209–212. doi: 10.1021/ol036157o. [DOI] [PubMed] [Google Scholar]
- 16.Hingorani DV, Montano LA, Randtke EA, Lee YS, Cárdenas-Rodríguez J, Pagel MD. Contrast media mol I. 2015 doi: 10.1002/cmmi.1672. [DOI] [PMC free article] [PubMed] [Google Scholar]
- 17.Li Y, Sheth VR, Liu G, Pagel MD. Contrast media Mol I. 2011;6:219–228. doi: 10.1002/cmmi.421. [DOI] [PMC free article] [PubMed] [Google Scholar]
- 18.Randtke EA, Chen LQ, Pagel MD. Contrast Media Mol I. 2014;9:252–258. doi: 10.1002/cmmi.1566. [DOI] [PMC free article] [PubMed] [Google Scholar]
- 19.Randtke EA, Chen LQ, Corrales LR, Pagel MD. Magn Reson Med. 2014;71:1603–1612. doi: 10.1002/mrm.24792. [DOI] [PMC free article] [PubMed] [Google Scholar]
- 20.Noble E, Janssen L, Dierickx PJ. Cell Biol Toxicol. 1997;13:445–451. doi: 10.1023/a:1007423911613. [DOI] [PubMed] [Google Scholar]
- 21.Warburg O. Science. 1956;123:309–314. doi: 10.1126/science.123.3191.309. [DOI] [PubMed] [Google Scholar]
- 22.Vander Heiden MG, Cantley LC, Thompson CB. Science. 2009;324:1029–1033. doi: 10.1126/science.1160809. [DOI] [PMC free article] [PubMed] [Google Scholar]
- 23.Soesbe TE, Merritt ME, Green KN, Rojas-Quijano FA, Sherry AD. Magn Reson Med. 2011;66:1697–1703. doi: 10.1002/mrm.22938. [DOI] [PMC free article] [PubMed] [Google Scholar]
- 24.Yoo B, Pagel MD. J Am Chem Soc. 2006;128:14032–14033. doi: 10.1021/ja063874f. [DOI] [PubMed] [Google Scholar]
- 25.Shah T, Lu L, Dell KM, Pagel MD, Griswold MA, Flask CA. Magn Reson Med. 2011;65:432–437. doi: 10.1002/mrm.22637. [DOI] [PMC free article] [PubMed] [Google Scholar]
- 26.Zhu C, He L, Zhou X, Nie X, Gu Y. Oncol Rep. 2016;35:1318–1328. doi: 10.3892/or.2015.4525. [DOI] [PMC free article] [PubMed] [Google Scholar]
Associated Data
This section collects any data citations, data availability statements, or supplementary materials included in this article.