Abstract
Hippocampal prosthetic devices have been developed to bridge the gap between functioning portions of the hippocampus, in order to restore lost memory functionality in those suffering from brain injury or diseases. One approach taken in recent neuroprosthetic design is to use a multi-input, multi-output device that reads data from the CA3 in the hippocampus and electrically stimulates the CA1 in an attempt to mimic the appropriate firing pattern that would occur naturally between the two areas. However, further study needs to be conducted in order to optimize electrode placement, pulse magnitude, and shape for creating the appropriate firing pattern. This paper describes the creation and implementation of an anatomically correct 3D model of the hippocampus to simulate the electric field patterns and axonal activation from electrical stimulation due to an implanted electrode array. The activating function was applied to the voltage results to determine the firing patterns in possible axon locations within the CA1.
I. Introduction
The hippocampus is the segment of the brain associated with consolidating short-term memory into long-term memory. Damage to the hippocampus can cause detrimental memory-loss and decreased cognitive function [1]. This is particularly relevant for those suffering from Alzheimer’s disease, dementia, cerebrovascular disease, or traumatic brain injury. While there exists a wide range in the severity of these diseases, they often result in long-term physical, emotional, and behavioral effects, with an accompanying decrease in quality of life.
Memories are encoded in spatio-temporal patterns through the hippocampus, progressing from the Dentate Gyrus (DG) through the CA3 to the CA1 [2]. A disconnect between the CA3 and CA1 results in severe memory loss and long-term disruption of memory formation [3]. For example, when rodent hippocampi are impaired, rodents show a lack of spatial learning and recall [4]. A Hippocampal Prosthetic Device (HPD) to enhance and restore memory was subsequently developed and tested in this experimental study [3]. The HPD was built by creating a multi-input multi-output model to extract and estimate the firing pattern transformations between the CA1 and CA3. With a supplied input from CA3 recording electrodes and a known transformation for creating associated output firing in the CA1, the CA1 can be electrically stimulated appropriately. This model is instantiated using software or custom VLSI hardware that is attached to upstream recording electrodes and downstream stimulating electrodes. In this configuration, the HPD can substitute for biomimetic communication [3].
While HPDs have shown success in restoring memory, [5] there are still factors that need to be resolved. One aspect that is not well understood is the optimal stimulation magnitudes and resulting firing patterns required to effectively replicate memory function and specific memory codes. Before HPDs can transition in a widespread manner to humans, it is crucial to understand the threshold for electrical current levels. With this understanding, the minimum current necessary to cause a neural activation can be accurately predicted, and damage to surrounding neural tissue can be understood and minimized.
In this work, we propose a complex 3D computational model incorporating a HPD implanted in a heterogeneous hippocampus. The model was segmented such that the more resistive cell bodies were modeled appropriately in comparison with the rest of the morphology. This was necessary due to the future inclusion of real morphological data. A model discretized based on the varying resistivity throughout the hippocampus and surrounding tissue was created. A 2 × 8 micro electrode array was then incorporated into the model with a recording row of electrodes and the stimulating row positioned in the CA1. The model was implanted near the septal pole so each row was parallel to the mediolateral plane. A multi-resolution admittance method was used to convert the discretized model to a circuital network and solve for the fields and potentials from current stimulation at each of the electrodes. The activating function was applied to the resulting potentials to determine the stimulation patterns parallel to the rostrocaudal plane. The significance of this model is the introduction of a toolset for the design of power efficient and low dimension neural prostheses.
A previous study using a multi-scale 2D layered slice model and surface electrodes, incorporating a large-scale model of DG neural networks, ensured that this modeling methodology had the ability to produce accurate results [6]. This study expands on this work, leading to a 3D model with the means for incorporating the entire HPD, and allowing for the study of the effects of different design parameters and prediction of how their roles affect the output firing patterns.
II. Materials and Methods
A. Model
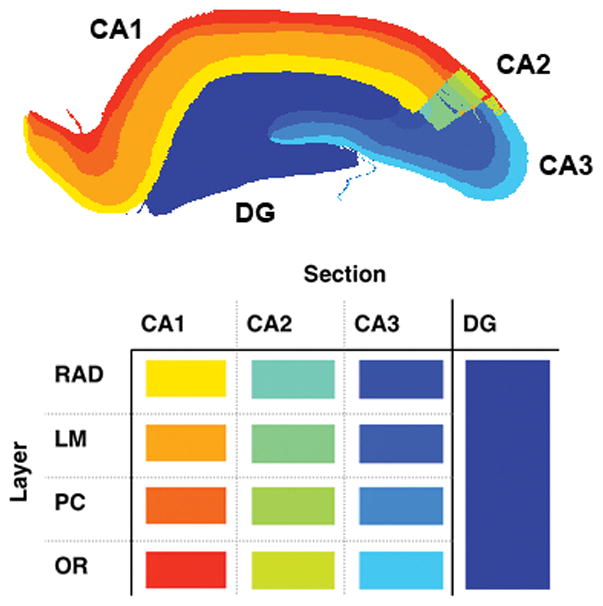
The hippocampus model used in this paper was created from a dataset based on MRI images of a rat hippocampus, classifying 10 × 106 different points according to their position, section of hippocampus, and layer [7] [8]. Software was written to convert the data into a 16 μm resolution 3D matrix of cubic voxels. Each voxel was assigned a material index which corresponded to its section and layer, where the section refers to CA1, CA2, CA3, or DG, and the layer refers to either the the Lacunosum-Moleculare (LM), Radiatum (RAD), Pyramidal Cell (PC), or Oriens (OR) [7]. This segmentation is shown in Fig. 1. Each material index was then assigned an electrical conductivity value based on its layer as shown in Table I [6] [9]. In this case, the tissue was modeled as purely resistive because the dominant frequency of the stimulation pulse lies in the low frequency range (below 1 kHz). Further, the model can be extended to include the capacitive element of the tissue-electrode interface. The surrounding tissue was classified with homogeneous dielectric properties.
Fig. 1.

Slice of the hippocampus model in the rostrocaudal plane showing the separate sections (DG, CA1, CA2, CA3) and layers (LM, RAD, PC, and OR).
TABLE I.
Material resistivity values [6]
| Section | Resistivity Ω-m |
|---|---|
| LM | 2.6045 |
| RAD | 6.4291 |
| PC | 2.8792 |
| OR | 3.215 |
| Surrounding Tissue | 3.215 |
Voxels that were undefined in the original dataset were interpolated and assigned a tissue type based on the surrounding material. However, this method did not eliminate larger natural spaces that occur in the hippocampus due to irregularities or connections to surrounding tissue. The initial dataset also contained voxels that were separated by as little as 4 μm in the x and y dimensions and 16 μm in the z dimension. To increase computational speed and maintain uniform dimensions, the resolution was set to 16 μm in all dimensions. The final model size was 475x500x288 voxels.
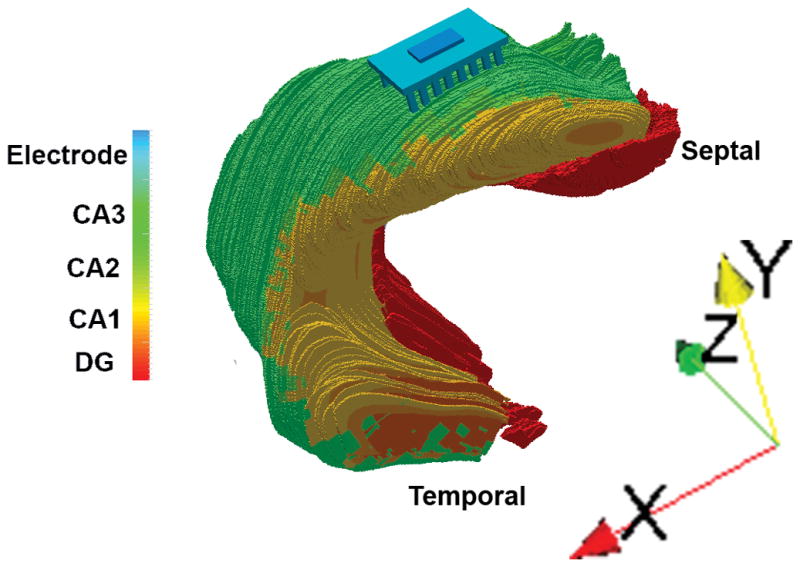
An electrode model was constructed to replicate the physical device [4], including a row of 8 recording microwire electrodes and a row of 8 stimulating microwire electrodes. The diameter of each electrode was set to be 48 μm. The electrode model was inserted into the hippocampus model so the stimulating row ended in the CA1, near the cell body layers. A conductive plate was inserted above the electrode array to serve as a common ground for simulations. The 3D model of the hippocampus with the electrode array implanted is shown in Fig. 2. Model and electrode creation methods were implemented in Python while merging methods were implemented with C++.
Fig. 2.

Image of the 3D model of the Hippocampus constructed for this study. X corresponds to the coronal or rostrocaudal axis, Y to the sagittal or dorsoventral axis, and Z to the horizontal or mediolateral axis.
B. Simulation Tool
A multi-resolution admittance method was used to solve for the voltages throughout the model given predefined current source(s). However, several steps were taken before simulations were run. First, a meshing algorithm was applied to the model. Large sections of the model comprised of the same material were combined into larger voxels. The meshing algorithm increases computational speed but maintains the model detail at material boundaries where a high resolution is important for accurate simulation [10]. By increasing the voxel size by up to 64 voxels, the number of nodes in the model decreases.
Second, the meshed model was used to generate a circuit network. Each vertex became a node, and all of the nodes were connected with an admittance value determined from the positional relationship of the nodes, the average conductivities of the materials in neighboring voxels, and the distance between them. For example, the impedance for a node at i, j, k in the x direction is shown in Equation 1 where σ refers to the calculated conductivity [10] [11].
| (1) |
Current sources were inserted into the model at a node inside each of the electrodes. In this study, bipolar stimulation was used, applying the current sources across adjacent electrodes along the stimulating row resulting in four total i sources [12]. The admittances were combined into an admittance matrix G, and currents into a current vector I, which together defined the relationship between all nodes in the network. The voltages (V) at each node in the circuit can then be solved using G, I, and Equation 2 [10] [11].
| (2) |
After the simulation, the voltages at each node were obtained. These results were then run through an interpolation routine to find the voltages in the center of each voxel based on the surrounding nodes. The electric field throughout the model was then determined from the first spacial derivative of the voltage. This field was used to solve for current density through the model using Equation 3 [10] [12].
| (3) |
C. Activating Function
The activating function was applied to the resulting voltages obtained throughout the model. The activating function characterizes the response of an axon due to electrical stimulation to predict neural stimulation. It is calculated as shown in Equation 4 where Ve defines the voltage along the axon and f is the resulting activating function [13].
| (4) |
For Equation 4, positive values correlate to axonal activation. The activating function was included to give an initial estimation for the magnitude of current needed to stimulate axons passing through the CA. First, the location of an axon was defined to be parallel to the electrode array, passing through the CA1 molecular layer across the z-axis. Coordinates for a line approximating center locations for nodes in the axon were defined. Second, trilinear interpolation was applied to the Ve values along the desired line, resulting in voltages at locations close together. This was done to create a smoother response without changing the shape of the second derivative. Next, a central difference approximation for a derivative was applied to approximate the solution for the activating function across the axon. Interpolation and approximation routines were implemented in Python.
III. Results
A. Field Distribution
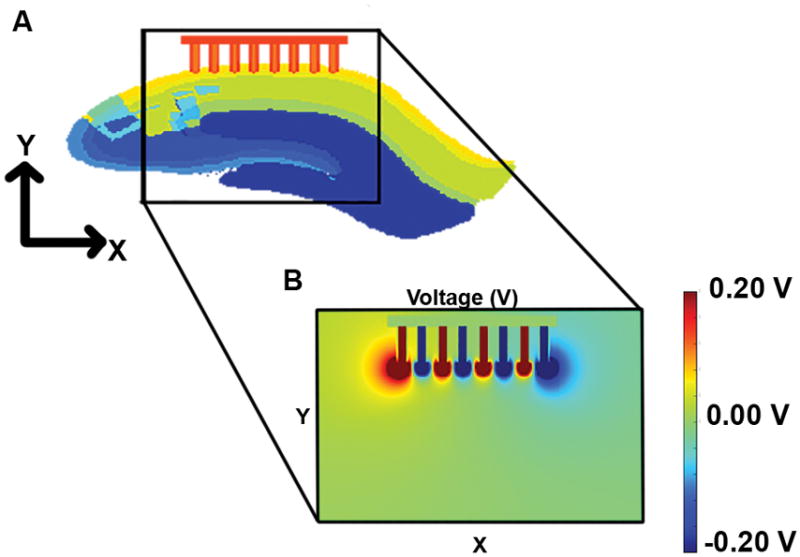
Each pair of electrodes was initialized with a current source magnitude of 100 μA, and a static simulation was run. Fig. 3 shows a plot of the resulting voltages along the mediolateral plane through the center of the electrodes. This slice was chosen to show the maximum voltage levels and relationship between the electrodes. The voltage was high directly beneath the electrode surface, with a high electric field between each bipolar pair as was expected, and a focused strength that faded quickly in the surrounding material. The current density showed a similar pattern. The voltage was higher at the outside electrodes compared to those in the middle because of the lack of an oppositely polarized electrodes on both sides.
Fig. 3.

A) Slice of the model in the mediolateral plane cutting through the electrodes. B) The resulting voltages at the slice in A.
B. Activating Function Calculations
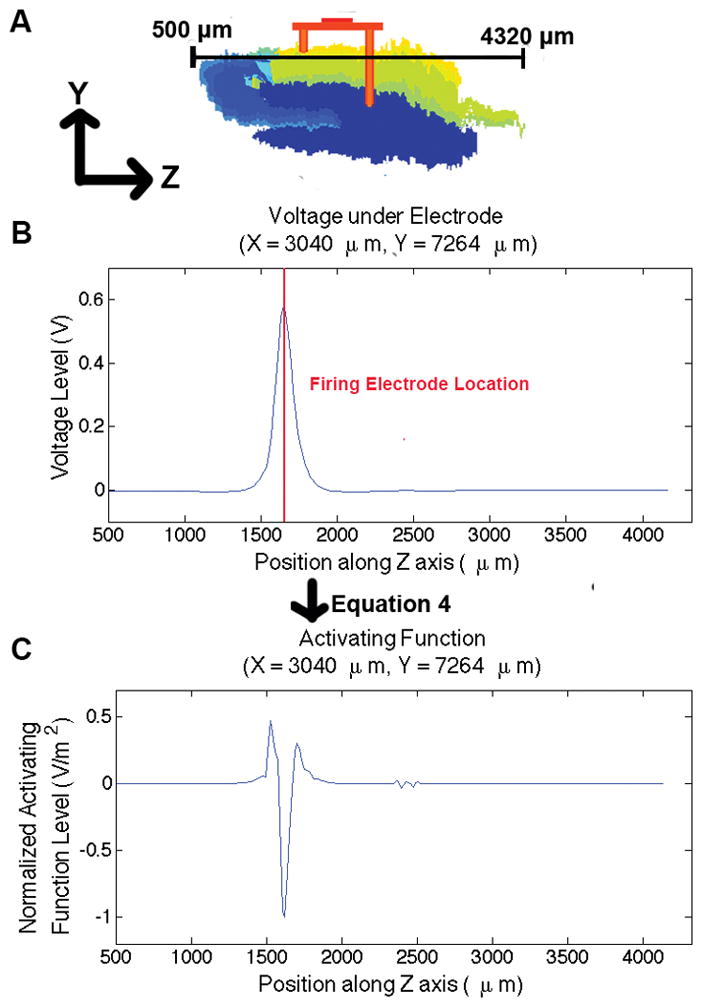
For this simulation, the activating equation was characterized along a path cutting through just below a middle electrode as shown in Fig. 4A. The voltage along this path is shown in Fig. 4B. As expected there was a large spike just beneath the electrode. The path was chosen because it runs parallel to typical axon morphology in the hippocampus [14].
Fig. 4.

Activating function across axon located underneath the micro-electrode array. A) Slice of hippocampus model showing the location of the axon: just beneath the electrode array in the mediolateral plane, B) the voltage across the line in A, along typical axon morphology in the hippocampus, and C) the activating function applied to the voltage, showing stimulation beneath the electrode.
In order to normalize the activating function, each value was divided by the maximum, scaling the results from −1 to 1. The resulting normalized activation pattern is shown in Fig. 4C. This study showed activation beneath the electrode. The activating function was applied again for an anodic current pulse and inverse results were obtained.
IV. Discussion
The model presented in this paper used the admittance method to simulate an HPD with a micro-electrode array implanted near the septal pole of the rat hippocampus. Simulations were run with an anodic and cathodic pulse to determine voltage. The voltage was then applied to the activating function to find stimulation patterns. Results showed stimulation beneath the electrode.
Additional steps can be taken to extend the model in this study. The activating function shows whether a stimulation occurred but not how the resulting pulse would affect connecting neurons. Modeling the neural networks with variants of transmission line equations using tools such as NEURON [15] can simulate the complex behavior of synapses and the ionic mechanisms and synaptic behavior in these cells to show neuron firing patterns. It is possible to combine the admittance method and explicit neuron simulation by applying the voltages found at each time step as extracellular voltages on a cellular model. The model described in this study is currently being expanded into a multi-scale model as was implemented in [6] and [12], applying previously published multi-compartmental cable models of CA1 pyramidal cells and passing axons placed within the 3D model. By applying the external voltages calculated as described in this paper, sources of varying magnitude and pulse width can be considered. [12].
Creating this multi-scale model of the hippocampus is just one of the methods that could be implemented to improve understanding of hippocampus function and future direction of the cognitive prosthetic. Through this study, we hope to conclude with a set of predictive tools to help with progressing an HPD to full functionality and safety. Having a set of simulation models with the complexity necessary for accurately predicting the behavior resulting from an applied stimulus from a hippocampus prosthetic device can help with efficiently modifying existing designs and optimizing stimuli prior to experimentation.
Acknowledgments
Research reported in this paper was supported by the National Institute of the General Medical Sciences of the National Institutes of Health under grant 1U01GM104604-01
References
- 1.Gray DS. Slow to recover severe traumatic brain injury: a review of outcomes and rehabilitation. Brain Injury. 2000;14(11):1003–1014. doi: 10.1080/02699050050191940. [DOI] [PubMed] [Google Scholar]
- 2.Yu G, Robinson BS, Hendrickson P, Song D, Berger TW. Implementation of topographically constrained connectivity for a large-scale biologically realistic model of the hippocampus. 34th Annual International Conference of the IEEE EMBS; San Diego, CA. 2012. [DOI] [PMC free article] [PubMed] [Google Scholar]
- 3.Berger TW, Song D, Chan R, Marmarelis V, LaCoss J, Hampson R, Deadwyler S, Granacki J. A hippocampal cognitive prosthesis: Multi-input, multi-output nonlinear modeling and vlsi implementation. IEEE Transactions and Rehabilitation Engineering. 2012 Mar;20(2) doi: 10.1109/TNSRE.2012.2189133. [DOI] [PMC free article] [PubMed] [Google Scholar]
- 4.Xu H, Hsiao M, Song D, Berger TW. Recording place cells from multiple sub-regions of the rat hippocampus with a customized micro-electrode array. Annual International Conference of the IEEE EMBS; Chicago, Il. 2014. [DOI] [PubMed] [Google Scholar]
- 5.Berger TW, Hampson RE, Song D, Goonawardena A, Marmarelis VZ, Deadwyler SA. A cortical neural prosthesis for restoring and enhancing memory. Journal of Neural Engineering. 2011 Jun;8 doi: 10.1088/1741-2560/8/4/046017. [DOI] [PMC free article] [PubMed] [Google Scholar]
- 6.Bingham C, Loizos K, Guo Y, Yu GJ, Hendrickson P, Bouteiller J-MC, Lazzi G, Berger T. Society for Neuroscience. Washington D. C: 2013. Multi-scale simulation of extracellular electrode stimulation in the dentate gyrus. [Google Scholar]
- 7.Ropireddy D, Scorcioni R, Lasher1 B, Buzsáki G, Ascoli GA. Axonal morphometry of hippocampal pyramidal neurons semi-automatically reconstructed after in-vivo labeling in different ca3 locations. Brain Structure and Function. 2011 Mar;216(1) doi: 10.1007/s00429-010-0291-8. [DOI] [PMC free article] [PubMed] [Google Scholar]
- 8.Ropireddy D, Bachus SE, Ascoli GA. Non-homogeneous stereological properties of the rat hippocampus from high-resolution 3d serial reconstruction of thin histological sections. Neuroscience. 2012;205:91–111. doi: 10.1016/j.neuroscience.2011.12.055. [DOI] [PMC free article] [PubMed] [Google Scholar]
- 9.Johnson GA, Calabrese E, Badea A, Paxinos G, Watson C. E. a multidimensional magnetic resonance histology atlas of the rat brain. Neuroimage. 2012 Sep;62(3):1848–1856. doi: 10.1016/j.neuroimage.2012.05.041. [DOI] [PMC free article] [PubMed] [Google Scholar]
- 10.Cela C. PhD dissertation. North Carolina State University; 2010. A multiresolution admittance method for large-scale bio-electromagnetic interactions. [Google Scholar]
- 11.Cela CJ, Lee RC, Lazzi G. Modeling cellular lysis in skeletal muscle due to electric shock. Biomedical Engineering, IEEE Transactions on. 2011;58(5):1286–1293. doi: 10.1109/TBME.2010.2103362. [DOI] [PubMed] [Google Scholar]
- 12.Loizos K, Lazzi G, Lauritzen JS, Anderson J, Jones BW, Marc R. A multi-scale computational model for the study of retinal prosthetic stimulation. Annual International Conference of the IEEE EMBS; Chicago, Il. Aug 2014; [DOI] [PMC free article] [PubMed] [Google Scholar]
- 13.Rattay F. Analysis of models for external stimulation of axons. Biomedical Engineering, IEEE Transactions on. 1986;10:974–977. doi: 10.1109/TBME.1986.325670. [DOI] [PubMed] [Google Scholar]
- 14.Ropireddy D, Ascoli GA. Potential synaptic connectivity of different neurons onto pyramidal cells in a 3d reconstruction of the rat hippocampus. Frontiers in neuroinformatics. 2011;5 doi: 10.3389/fninf.2011.00005. [DOI] [PMC free article] [PubMed] [Google Scholar]
- 15.Carnevale NT, Hines ML. The NEURON book. Cambridge University Press; 2006. [Google Scholar]


