Abstract
Due to rapidly rising rates of diabetes and prediabetic conditions worldwide and the associated lethal complications, it is imperative to devise new diagnostic tools that reliably and directly measure insulin levels in clinical samples. Herein, we report a simple and sensitive direct imaging of insulin levels in diabetic patient samples using a surface plasmon resonance microarray imager (SPRi). To enhance sensitivity, we utilized magnetic nanoparticles (MNPs) to capture insulin from serum samples either directly or via a capture antibody immobilized on MNPs. The insulin-captured nanoparticles were allowed to bind surface insulin-antibody for detection from pixel intensity increase using a charge coupled device (CCD) built-in with the SPRi. We have compared the analytical figures-of-merit of the SPRi immunoarray on detecting insulin prepared in various percentages of serum solutions. A four parameter logistic model was used to obtain the best fit of microarray responses with insulin concentration and indicated the cooperative binding of insulin–nanoparticle conjugates to surface antibody in both the buffer insulin and the serum insulin conjugates with MNPs. The cooperativity effect is attributed to the greater association of magnetic nanoparticle-bound insulin molecules with increasing concentration of insulin binding to surface antibody. This is the first report of an SPRi immunoarray to accomplish clinical diagnosis of diabetic and prediabetic conditions based on insulin levels with serum matrix effect analysis and comparison between direct and sandwich insulin assay formats.
Keywords: microarray imager, insulin, serum matrix effect, magnetic nanoparticles, type of diabetes, clinical diagnosis, surface plasmon resonance, sigmoidal response
Graphical Abstract
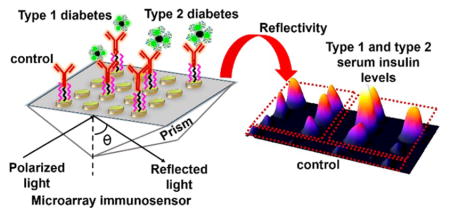
Diabetes mellitus, commonly known as diabetes, is a condition characterized by abnormally high blood glucose levels. Insulin is a peptide hormone that is responsible for the cellular uptake of glucose. Since glucose metabolism acts as the main source of energy in humans, insulin plays a crucial role in sustaining normal function of cells.1–3 Diabetes is caused either by deficient insulin secretion by the pancreas that limits glucose metabolism or by lack of response by cells to available insulin. The deficiency of insulin leads to type 1 diabetes (T1D, also called juvenile or insulin-dependent) while the presence of elevated insulin levels not recognized by cells for glucose metabolism indicate the condition of type 2 diabetes (T2D, insulin-resistant). Therefore, timely identification of the type of diabetes based on insulin levels by novel imaging-based immunoarrays can facilitate better treatment procedures.
Under fasting conditions, the level of insulin in blood serum of T1D patients has been shown to be less than 50 pM, and it is above 70 pM for T2D patients during onset, while the normal range for insulin is between these two values.4–7 Recently, the existence of type 3 diabetes related to Alzheimer’s disease has been identified; this disease results from resistance to insulin in the brain.8 Another type of diabetic condition called gestational diabetes has been known to occur in women during pregnancy.9
A recent study found that there has been a significant rise in the number of patients with diabetic disorders from 5.5% to 9.3% of the US population over the last two decades; this rise has been shown to correlate with the increase in obesity conditions.10 Rapid diagnosis of the type of diabetes to prevent associated chronic disorders, such as heart diseases, kidney failure, eye and nerve diseases, and Alzheimer’s, requires an assay that directly measures insulin levels in serum. Detection of insulin abuse by athletes is one other area of application.11,12
Our laboratory recently demonstrated an electrochemical mass sensor (eQCM) and a voltammetric immunosensor for detecting picomolar serum insulin levels by a direct immunoassay based on oscillation frequency, electrochemical impedance signals, and redox currents.13,14 A number of other analytical methods for detection of insulin such as radioimmunoassay (RIA), enzyme linked immunoassay (ELISA), chemiluminescence immunoassay, electrochemiluminescence, and column immunoassay have also been reported.15,16 These methods have the advantage of offering low detection limit in the picomolar range but the major drawbacks of these methods are (1) larger sample volumes, (2) longer assay times, and (3) no feature of real time monitoring coupled with a sensitive array image output as in SPRi. Moreover, array image-based diagnostic platform with simplicity of operation, high sensitivity, and selectivity is clinically advantageous. Herein, we present the first SPRi-based immunoarray that can detect picomolar insulin levels in patient serum with a less tedious procedure and short assay time.
Surface plasmon resonance (SPR) spectroscopy has been shown to measure changes in refractive index signals upon the binding of biomolecules to SPR sensor surface for up to ~300 nm distance from the surface.17–19 Nanoparticle strategies to improve detection sensitivity of analytes in SPR biosensors have received significant attention recently.20–22 Discrepancies still exist in the literature on the claim of terming label-free or labeled approach for sensors involving nanoparticle conjugation with detection analytes.23,24 We propose that nanoparticles be considered as high-density molecular carriers to facilitate signal amplification rather than representing any form of detection probes or detection labels required to perform an assay protocol.
Of the known SPR biosensors for insulin detection, Gobi et al. reported a self-assembled PEG monolayer-modified SPR-immunosensor for serum insulin with a limit of detection (LOD) of ~1 nM.25 Recently, an SPR sensor utilizing gold nanoparticles with a dendrimer-modified surface was demonstrated to have an LOD of 0.8 pM for insulin in a 10-fold diluted serum.24 Application of the SPR approach to detect insulin autoantibodies has also been demonstrated.26 However, there has been no report on diagnosis of insulin levels in patient serum samples by SPR microarray imager. The imager developed was additionally used in assessing and comparing the matrix effects between buffer and serum medium in both direct and sandwich assay formats.
EXPERIMENTAL SECTION
Materials and Methods
Insulin (recombinant human) and monoclonal surface anti-insulin antibody (Abinsulin) were purchased from Sigma (St. Louis, MO, USA). Capture polyclonal anti-insulin antibody (Ab(insulin)2) was purchased from Abcam (Cambridge, MA, USA). Insulin-depleted human serum was purchased from Fitzgerald (Acton, MA) to prepare standard serum insulin samples and obtain calibration plots. Fluorescein isothiocyanate labeled insulin (FITC-insulin) was purchased from Nanocs Inc. (New York, NY). Type 1 diabetes (T1D) and type 2 diabetes (T2D) patient serum samples were purchased from BioreclamationIVT (Westbury, NY). Commercial serum insulin enzyme linked immunosorbent assay (ELISA) kit based on secondary antibody labeled with a peroxidase enzyme was purchased from Mercodia (Uppsala, Sweden). Poly(acrylic acid)-functionalized magnetic nanoparticles (MNP, 100 nm hydrodynamic diameter) were obtained from Chemicell GmbH (Berlin, Germany). 1-Ethyl-3-[3-(dimethylamino)propyl] carbodiimide hydrochloride (EDC) and N-hydroxysuccinimide (NHS) were purchased from Thermo Scientific (Waltham, MA, USA). All other chemicals were analytical grade.
High performance particle sizer (HPPS 5001, Malvern Instruments, Worcestershire, UK) was used for performing particle size measurements and a Cary Eclipse fluorescence spectrophotometer (Agilent Technologies, Santa Clara, CA) was used to generate fluorescence emission spectra. The SPR microarray imager (SPRi) was purchased from GWC Technologies (Madison, WI, USA) with a light source of operating wavelength 800 nm and a charge coupled device (CCD) camera. Prior to use, the SPRi gold array chip (SpotReady 16 from GWC Technologies, each spot is 1 mm in diameter) was cleaned in piranha solution (3:1 mixture of concentrated H2SO4 and 30% H2O2. Caution: Piranha solution is highly corrosive and organic matter reactive solution) for 10 s. Mixed self-assembled monolayers (SAMs) of thiols consist of 90% (11-mercaptoundecyl)triethylene glycol (PEG3–OH), and 10% (11-mercaptoundecyl)hexaethylene glycol-carboxylate (PEG6-COOH) (SensoPath Technologies, Bozeman, MT, USA) were formed on the Au-array spots by immersing the chips overnight in the mixed thiol solution in ethanol.27
Preparation of Insulin-Magnetic Nanoparticle (Insulin-MNP) and Insulin-Capture Antibody-Magnetic Nanoparticle (Insulin-Ab(insulin)2-MNP) Conjugates
The preparation and characterization of buffer (0% serum) and serum insulin-MNP conjugate were similar to our recent report.14 Briefly, a freshly prepared 150 μL of aqueous solution of 0.35 M EDC and 0.1 M NHS was added to 0.5 mg of MNP (~9 × 10¹¹ nanoparticles, Chemicell Inc.) and incubated for 10 min to convert the carboxylic acid groups of MNP into amine reactive succinimidyl ester groups. To MNP-succinimidyl ester suspensions in separate vials, 250 μL of various pM concentrations of spiked insulin in human serum were added and the resulting serum composition in the final MNP reaction mixture was 12.5%, 25%, 50%, or 100%.
After reacting for 2 h at room temperature under constant mixing in a rotator, the insulin-bound MNP was separated from the free serum solution by using a magnet, was washed twice in phosphate buffer saline (PBS) containing 1% BSA (PBS-BSA), and was then resuspended in 100 μL of fresh PBS-BSA. Similarly, insulin-free human serum without any spiked insulin was reacted with –COOH activated MNP and used as a control sample to obtain background signals. The serum insulin-Ab(insulin)2-MNP conjugates were also prepared in a similar fashion. The activated MNP (0.5 mg) were first treated with 300 μL of Ab(insulin)2 (0.2 mg mL−1 in mixed phosphate buffer, pH 6.5) and reacted for 2 h in a rotator at room temperature. The Ab(insulin)2 bound MNP was separated by a magnet, washed in PBS buffer, and then pM concentrations of insulin in human serum were added (final serum concentration of 50%) and allowed to bind for 15 min. The conjugates were then washed with PBS-BSA, resuspended in 100 μL of 1% PBS-BSA, and immediately used for the sandwich SPRi immunoassay.
Detection of Insulin-MNP by a Direct or Sandwich Immunoassay
The SAMs of gold microarray spots were covered with a freshly prepared solution of 0.35 M EDC and 0.1 M NHS to activate the carboxylic acid surface groups of PEG6-COOH monolayer by reacting for 10 min. After a quick rinse of the chip in deionized water and drying under N2, monoclonal anti-insulin antibody solution (0.25 mg mL−1 in pH 5.0 acetate buffer) was added to each array spot (~300 nL per spot, much smaller than other assay methods, such as ELISA, that need larger sample volumes of 25–100 μL per sample) and incubated for 45 min at 4 °C to covalently attach the antibody via lysine residues to activated surface –COOH groups as described previously.13 The antibody-immobilized SPRi gold array spots were exposed to 2% BSA in PBS for 30 min at 4 °C to minimize nonspecific binding of insulin-MNP sample to the free sensor surface in the following step.28 Then, various concentrations of buffer (0% serum) insulin and serum insulin attached to Ab(insulin)2-MNP or MNP were allowed to bind the surface antibody on the gold microarray spots for 20 min by manual spotting of insulin-MNP solutions on gold array spots. After washing the array spots with PBS-BSA solution, the SPR images of the array chips were captured using a high-resolution CCD-camera mounted with the instrument. The changes in reflectivity corresponding to spiked buffer insulin-MNP, serum insulin-Ab(insulin)2-MNP, or serum insulin-MNP and the respective control samples were determined using the analysis software provided with the instrument.
RESULTS AND DISCUSSION
The low molecular weight of insulin (~5800 Da) present in a complex serum matrix makes it challenging to detect at picomolar levels. We have overcome this bottleneck by the designed magnetic nanoparticles strategy to capture insulin in serum directly or via a capture insulin-antibody.
For the evaluation of matrix effect neat serum (100%), 2 (50%), 4 (25%), and 8 (12.5%) -fold diluted serum solutions in phosphate buffer saline (PBS, pH 7.4) were tested along with buffer insulin conjugated to MNP. Sandwich assay was performed by conjugating a capture anti-insulin antibody (Ab(insulin)2) to MNPs. Figure 1 shows the schematic representation of the SPR immunoarrays designed in this work.
Figure 1.
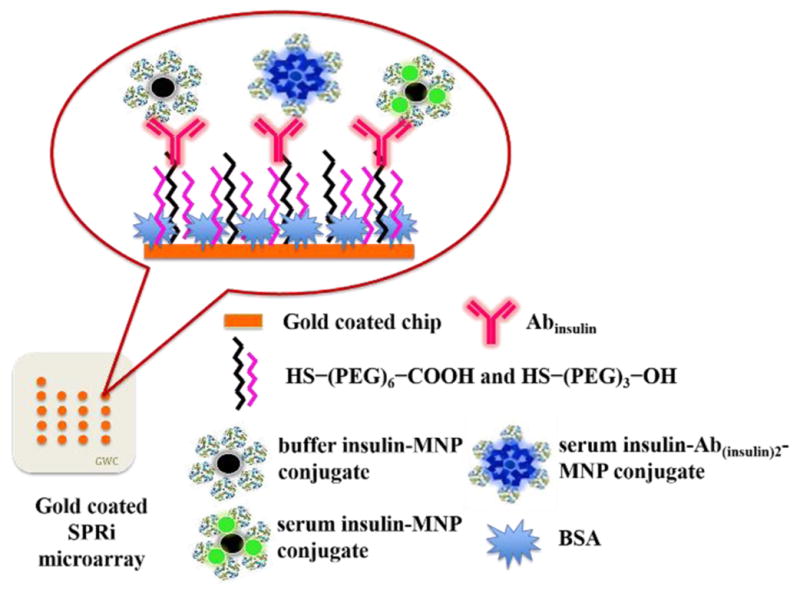
Schematic representation of SPR immunoarray imager designed in this study for measuring insulin levels (figure not drawn to scale).
The number of Ab(insulin)2 molecules bound to MNP [0.5 mg of MNP (~9 × 10¹¹ nanoparticles)] was estimated from the difference in absorbance of 300 μL of free antibody solution (pH 6.5, phosphate buffer) before and after conjugation to MNP by the standard Bradford protein assay.29 The number of serum insulin molecules conjugated to MNPs was estimated by enzyme linked immunosorbent assay (serum insulin ELISA kit, Mercodia, Sweden) similar to our voltammetry sensor report.14 The number of free antibody molecules before and after conjugation to MNP were 4.4 (±0.2) × 1013 and 1.6 (±0.1) × 1013, respectively, which indicates about 63% reaction efficiency. Estimation of the amount of serum insulin bound to Ab(insulin)2-MNP yielded ~2.7 (±0.1) × 1010 serum insulin bound to Ab(insulin)2-MNP (500 μL of 50% serum solution with 100 pM insulin corresponding to 3.0 × 10¹⁰ insulin molecules) [N = 3 replicates]. This suggests about 90% insulin capturing efficiency by the prepared Ab(insulin)2-MNP conjugate.
On the other hand, the number of insulin molecules attached directly to MNP in 2, 4, and 8-fold diluted serum solutions were 2.1 (±0.2) × 1010, 2.3 (±0.1) × 1010, and 2.7 (±0.1) × 1010 indicating a conjugation efficiency of 70%, 77%, and 88%, respectively, upon using 500 μL of 100 pM serum insulin solutions (i.e., 3.0 × 10¹⁰ molecules). In the case of 100 pM insulin in a 100% serum solution the conjugation efficiency with MNPs ranged from 35% to 65%. This large deviation with diminished % insulin conjugation may be due to the predominant contributions of serum proteins, in a solution having the maximum level of serum proteins (i.e., 100%). Intrinsic fluorescence of buffer insulin from tyrosine residues30,31 were not measurable at pM levels by fluorescence. Moreover, the ELISA kit was useful only for serum insulin measurements. Therefore, for the estimation of buffer insulin conjugated to MNPs, the difference in fluorescence of fluorescein isothiocyanate (FITC)-tagged insulin solution, excitation at 490 nm and emission at 520 nm, was measured before and after conjugation with MNPs (Figure S1). This estimation suggested that almost all of the buffer insulin molecules were attached from the solution to MNPs (3.0 × 10¹⁰ FITC-tagged insulin molecules reacted with 0.5 mg MNP) under the conditions followed.
Based on the above estimations and the ability of MNP to capture insulin present in a buffer or serum medium, it is possible that the two surface exposed lysine residues of insulin (PDB: 3V19) along with other serum proteins (e.g., albumin) containing surface lysine groups could undergo covalent attachment with carbodiimide activated –COOH groups of MNP. Also, additional electrostatic binding of insulin and serum proteins with MNP cannot be ruled out. In agreement with this, our recent confocal microscopy characterization confirmed the attachment of FITC-tagged insulin molecules with MNP reacted in a 50% serum medium solution.14
The reflectivity changes for the covalent immobilization of insulin-antibody on the array spots followed by blocking the free array sites by bovine serum albumin (BSA) are represented in Table S1. Neat serum, and 2, 4, and 8-fold serum diluted insulin–MNP conjugates were tested for assessing matrix interference in detection limit and sensitivity. The corresponding changes in the reflectivity obtained for the binding of various concentrations of spiked buffer insulin-MNP, serum insulin-Ab(insulin)2-MNP, and serum insulin-MNP conjugates (both prepared in 50% serum solutions) to the surface antibody are represented in Figure 2. The difference microarray images (ImageJ software, National Institutes of Health) are represented in Figure S2.
Figure 2.
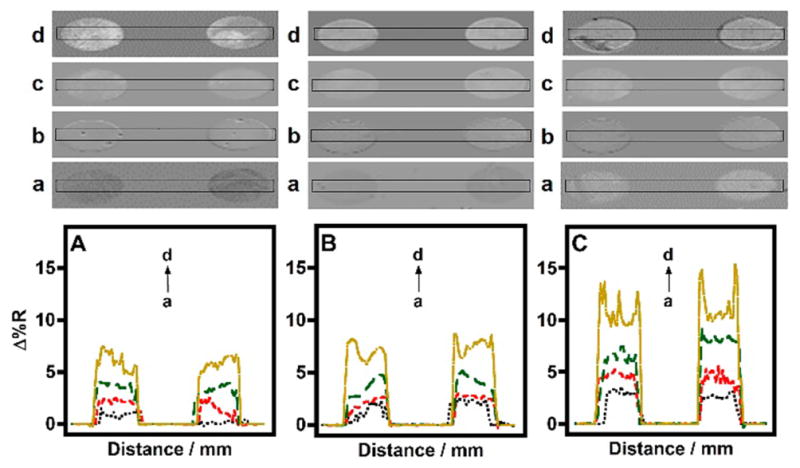
SPRi line profiles of (a) control, and (b) 5, (c) 50, and (d) 250 pM spiked (A) 0% serum insulin-MNP, (B) insulin-Ab(insulin)2-MNP, and (C) insulin-MNP conjugates in 50% serum binding to BSA blocked antibody microarray surface.
As shown in Figure 2, the background signal (control) from the buffer insulin-MNP conjugate was less when compared to the serum insulin-MNP conjugates. This is because in the case of serum insulin-MNP conjugates the serum proteins can bind nonspecifically to surface insulin-antibody on the microarray. In comparison, the control Ab(insulin)2-MNP conjugates (insulin-free 50% serum in PBS treated with Ab(insulin)2-MNP) showed a smaller signal possibly due to the occupation of MNP surface by the covalently attached Ab(insulin)2 molecules in buffer followed by a blocking step used (1% BSA in PBS) to minimize subsequent nonspecific binding of serum proteins. Figure 3 demonstrates the combined detection of 100 pM serum insulin-Ab(insulin)2-MNP and 100 pM serum insulin-MNP conjugates when captured by BSA blocked surface immobilized antibody. The trend in reflectivity were similar to that illustrated in Figure 2.
Figure 3.
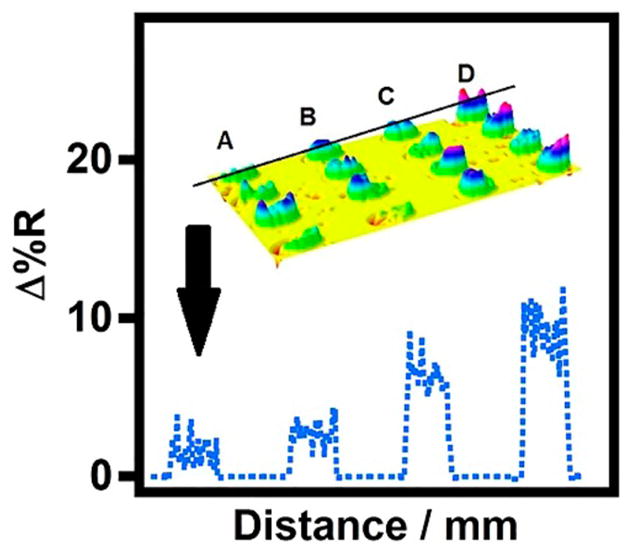
Representative SPR difference microarray image and corresponding line profile, across the first row, for binding of (A) control serum insulin-Ab(insulin)2-MNP, (B) control serum insulin-MNP, (C) 100 pM 50% serum insulin-Ab(insulin)2-MNP, and (D) 100 pM 50% serum insulin-MNP conjugates to the surface immobilized antibody.
Figure 4 presents the semilogarithmic plot of SPRi reflectivity as a function of 0% and 50% serum insulin concentration involving both direct and sandwich immunoassays of serum insulin. We hypothesized that serum matrix would negatively affect detection sensitivity by contributing to nonspecific signals. If this was the case, then more diluted serum would provide greater sensitivity. In agreement with this, the buffer insulin-MNP conjugates (0% serum) showed the highest sensitivity among all conjugates studied (Figure 4). In contrast, among serum insulin-MNP conjugates, we found that 50% serum insulin-MNP conjugates provided better sensitivity than the corresponding 25% and 12.5% serum insulin-MNP conjugates (Figure S3).
Figure 4.
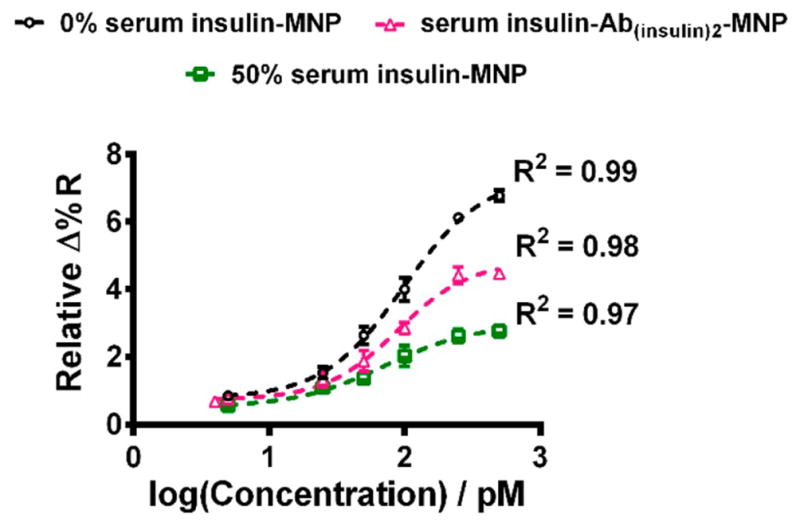
4-PL model fitted sigmoidal curves showing the increase in reflectivity as a logarithmic function of buffer insulin and 50% serum insulin concentrations (mean ± standard deviation for N = 3 replicates).
The comparative SPRi responses of the conjugates with different % of serum is shown in Figure S4. Based on particle size measurements (Figure S5), we suggest that the greater and optimal level of aggregation of insulin-MNP conjugates prepared from 50% serum solution offered a smaller limit of detection (LOD) in comparison to the relatively less aggregated forms of serum insulin-MNP conjugates prepared from 12.5% and 25% serum solutions. In addition, the LOD for buffer insulin-MNP conjugate is similar to that of 50% serum insulin-MNP conjugates. The comparative LODs can be attributed to the greater density of buffer insulin molecules bound to MNP surface and the absence of serum proteins that are likely compensated by the extended aggregation of 50% serum insulin-MNP conjugates toward signal enhancements.
Since the LOD for 12.5% and 25% serum insulin-MNP conjugates was higher than 50% serum insulin-MNP conjugates, these conjugates did not fit well in the sigmoidal plot (Figure S4). We obtained the best fit curves by using a 4-Parameter Logistic (4-PL) model that displayed the cooperative binding of the insulin-MNP conjugates onto the antibody microarray surface. The sigmoidal response can be attributed to the greater association of MNPs in the insulin conjugates with increasing concentration of insulin binding to surface antibody.
Undiluted serum insulin-MNP conjugates showed random particle sizes in the range of 915–1150 nm. Due to the high probability of binding of serum proteins and large variability in insulin binding to MNP (ELISA quantitation), undiluted serum insulin-MNP conjugates could not detect concentration dependent insulin levels and also exhibited negative SPRi response (Figure S6). We suppose the negative reflectivity may be due to the steric hindrance from the highly dense serum coated nanoparticles, which prevented binding of the insulin-MNP conjugates to surface antibody (Figure S7).
The 4-PL model used in this study best described the measured SPR response and the insulin concentration with good accuracy. The equation which describes the model is
where Y is the relative reflectivity, D is the minima value at the bottom plateau, A is the maxima value at the top plateau, x is the insulin concentration, C is the inflection point on the calibration curve (EC50), and B is the slope factor or the Hill slope which defines the steepness of the curve, a measure of sensitivity.32 Since the best fit was sigmoidal in shape the slope at EC50 for the conjugates was calculated using the formula B(D − A)/4C.32 The respective parameters generated by the reference model (GraphPad Prism 6 software) after fitting the relative change in reflectivities and the slope in this study are tabulated in Table S2. The positive Hill slope (>1.0) values indicate that the curves are steeper for all three conjugates.
Two ways of reporting LOD have been documented in the literature: one based on experimental estimation over controls26,33 and the second calculated from the calibration plots.24,34,35 Experimentally we obtained an LOD of 5 pM for both the 50% serum insulin-MNP and buffer insulin-MNP samples. 50% serum insulin-Ab(insulin)2-MNP samples provided an LOD of 4 pM. On the other hand, 12.5% and 25% serum insulin samples provided relatively higher LODs of 50 and 25 pM, respectively (Figure S4). We additionally calculated the LODs from the sigmoidal plots using the expression, LOD = mean ±3 × standard deviation of blank.36,37 The calculated LODs were 3.2, 3.7, and 1.4 pM for buffer insulin-MNP, 50% serum insulin-MNP, and serum insulin-Ab(insulin)2-MNP conjugates. The LODs are comparable to the reported detection limits for serum insulin by other techniques24,33–35 and previously reported SPR methods not having the array imaging feature.24,25 Previous SPR-based detection devices24,25 utilized serum diluted by 5 to 10-fold, and in the recently reported field effect transistor (FET)-based insulin sensor,33 a 10 000-fold serum dilution was used that might be in order to get better detector performance by eliminating salt effects. The larger extent of serum dilution requirement for detection of protein biomarkers lowers the protein concentration and further decreases the clinically required detection concentrations and thus challenges a diagnostic method in view of LOD. Considering this factor, the SPRi approach presented here has less nonspecific signal interferences and improved sensitivity for insulin at the optimal 50% serum composition and we show below the ease of implementing the array for patient samples.
The clinical applicability of the demonstrated immunoarray imager was confirmed by analysis of serum samples from patients with either type 1 or type 2 diabetes (BioreclamationIVT, Westbury, NY). Patient serum samples were attached to MNPs similar to the spiked serum insulin samples (serum composition was 50%) and the SPR immunoassay was performed as described in the Experimental Section. Figure 5 shows the line profiles of SPR image intensities for the binding of insulin-MNP and insulin-Ab(insulin)2-MNP conjugates of control human serum (insulin-free), T1D, and T2D patient samples to surface Abinsulin on the microarray chip. The greater change in reflectivity for the T1D and T2D samples over the control spots can be seen from the array images shown in Figure 5 and the trend observed in the patient samples was similar to that seen in the standard spiked serum insulin-MNP conjugates (Figures 2 and 3).
Figure 5.
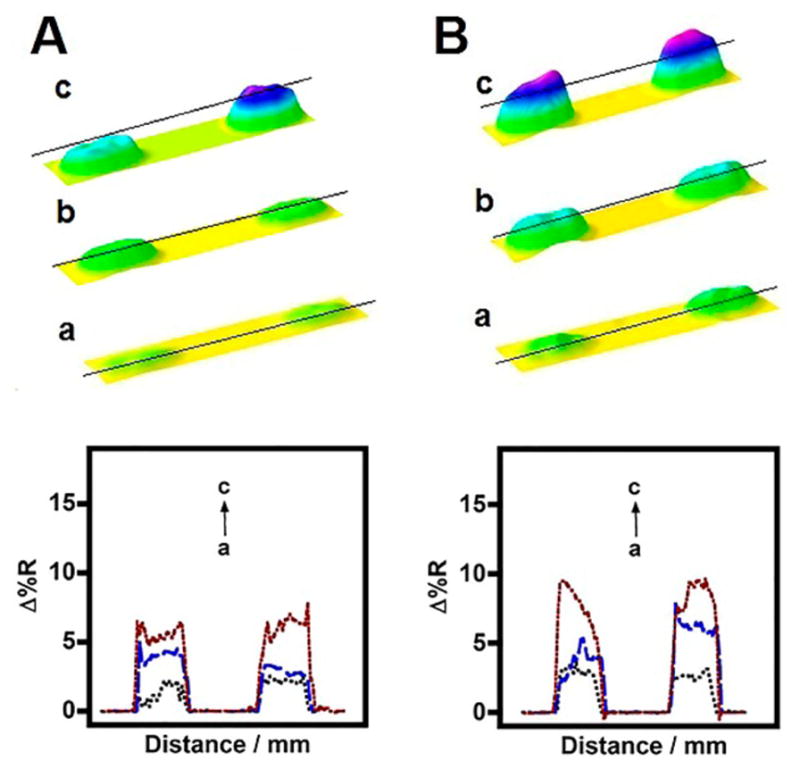
SPR difference immunoarray images and line profiles for (a) control, (b) T1D, and (c) T2D patient serum insulin samples captured by (A) Ab(insulin)2-MNP conjugates or (B) directly attached to MNP.
It is noteworthy to mention that the selective response of the presented SPRi immunoarray to serum insulin is unique in detecting insulin in the presence of nonspecific serum proteins (e.g., a large proportion of albumin). Most importantly, the clinically relevant insulin levels in diabetes patients (type 1 < 50 pM and type 2 > 70 pM in blood serum under fasting conditions)4–7 are within the observed maximum and minimum range of the fit (Figure 4). Furthermore, we determined that the insulin concentrations measured in the T1D and T2D patient serum samples by the SPRi immunoarray correlated well with that estimated using a commercial antibody-labeled ELISA (Figure 6). This validates the applicability of the designed SPRi immunoarray for the diagnosis of type of diabetes based on serum insulin levels in patients. Statistical analysis of the measured serum insulin levels between ELISA and SPRi was done using paired t test from SigmaStat software, which confirmed that the measured average insulin concentrations between the two methods are not statistically different at a 95% confidence level (Table S3).
Figure 6.
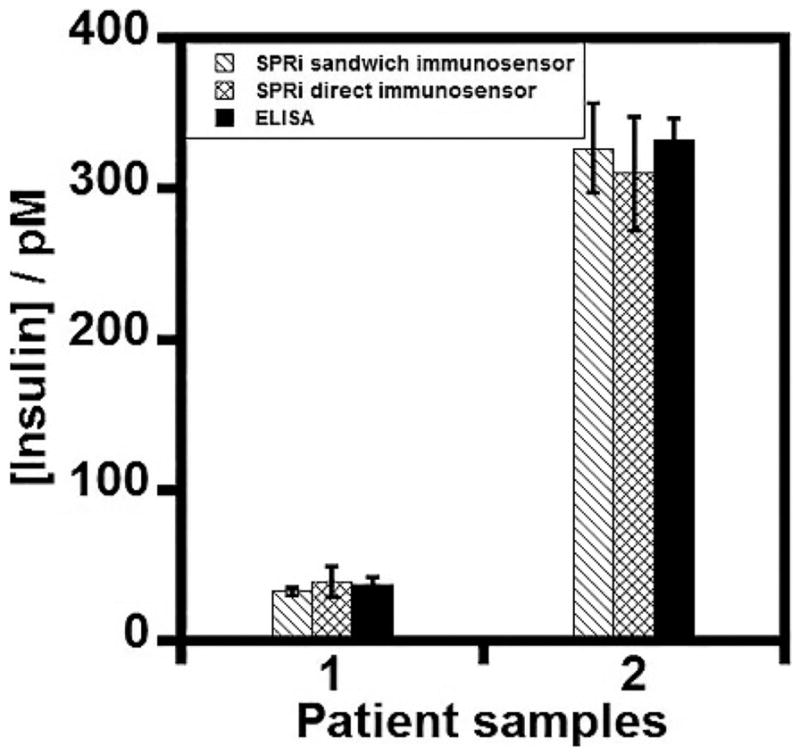
Correlation plot between the SPR immunoarray imager and the commercial antibody-labeled ELISA kit for serum insulin measurements in (1) type 1 and (2) type 2 diabetes patient serum samples.
CONCLUSIONS
The SPR microarray imager developed successfully detected clinically relevant pM insulin levels in patient serum samples and also compared direct immunoassay with a sandwich format at an optimum serum concentration. The second insulin-antibody conjugation to MNPs to capture insulin present in serum improved the sensitivity due to the added mass from the second antibody and selectivity from the antibody-enabled capturing of serum insulin molecules. However, direct capture of serum insulin molecules by MNPs was also successful in giving comparable pM detection limits. Also, comparing these assays further with buffer insulin samples suggested the effect of serum matrix in reducing the microarray sensitivity but not the LOD. The concentrations in diabetic patient samples determined using the presented immunoarray exhibited good correlation with the commercial antibody-labeled serum insulin ELISA kit. The unique advantage of the presented SPR immunoarray method is that the assay procedure does not need chemical or enzymatic labels to detect insulin levels while most of the commercially available serum insulin assays require expensive, tedious to make labeled antibodies and specific detection reagents and instruments.15 In conclusion, the SPRi method described here is potentially useful clinically for measuring insulin levels and distinguishing type 1 from the onset of type 2 diabetic disorders.
Supplementary Material
Acknowledgments
Research supported in this publication was supported by the National Institute of Diabetes and Digestive and Kidney Diseases of the National Institutes of Health under Award Number R15DK103386. The content is solely the responsibility of the authors and does not necessarily represent the official views of the National Institutes of Health. We thank Dr. K. Sudhakara Prasad for initial help with the SPR measurements.
Footnotes
Notes
The authors declare no competing financial interest.
The Supporting Information is available free of charge on the ACS Publications website at DOI: 10.1021/acssensors.5b00273.
Fluorescence spectra of buffer insulin-MNP conjugates, stepwise change in reflectivity of fabrication of SPR immunoarray chip, SPR difference microarray images of conjugates, line profile diagrams and relative changes in reflectivities of 12.5%, 25%, and 100% serum insulin-MNP conjugates, sensogram for 100% serum insulin conjugate and hydrodynamic sizes of conjugates. Parameters generated from 4PL model and comparison of SPRi responses with ELISA. (PDF)
References
- 1.Aschenbrenner DS, Venable SJ. In: Drug Therapy in Nursing. Aschenbrenner DS, editor. Lippincott Williams & Wilkins; 2008. pp. 1002–1030. [Google Scholar]
- 2.Saltiel AR, Kahn CR. Insulin signalling and the regulation of glucose and lipid metabolism. Nature. 2001;414:799–806. doi: 10.1038/414799a. [DOI] [PubMed] [Google Scholar]
- 3.Duckworth WC, Bennett RG, Hamel FG. Insulin degradation: progress and potential. Endocr Rev. 1998;19:608–624. doi: 10.1210/edrv.19.5.0349. [DOI] [PubMed] [Google Scholar]
- 4.Freckmann G, Hagenlocher S, Baumstark A, Jendrike N, Gillen RC, Rössner K, Haug C. Continuous glucose pro files in healthy subjects under everyday life conditions and after different meals. J Diabetes Sci Technol. 2007;1:695–703. doi: 10.1177/193229680700100513. [DOI] [PMC free article] [PubMed] [Google Scholar]
- 5.Muoio DM, Newgard CB. Mechanisms of disease: Molecular and metabolic mechanisms of insulin resistance and beta-cell failure in type 2 diabetes. Nat Rev Mol Cell Biol. 2008;9:193–205. doi: 10.1038/nrm2327. [DOI] [PubMed] [Google Scholar]
- 6.Weyer C, Hanson RL, Tataranni PA, Bogardus C, Pratley RE. A high fasting plasma insulin concentration predicts type 2 diabetes independent of insulin resistance: evidence for a pathogenic role of relative hyperinsulinemia. Diabetes. 2000;49:2094–2101. doi: 10.2337/diabetes.49.12.2094. [DOI] [PubMed] [Google Scholar]
- 7.Goetz FC, French LR, Thomas W, Gingerich RL, Clements JP. Are specific serum insulin levels low in impaired glucose tolerance and type II diabetes?: Measurement with a radioimmunoassay blind to proinsulin, in the popula tion of Wadena, Minnesota. Metab, Clin Exp. 1995;44:1371–1376. doi: 10.1016/0026-0495(95)90045-4. [DOI] [PubMed] [Google Scholar]
- 8.de la Monte SM, Wands JR. Alzheimer’s Disease is Type 3 Diabetes – Evidence Reviewed. J Diabetes Sci Technol. 2008;2:1101–1113. doi: 10.1177/193229680800200619. [DOI] [PMC free article] [PubMed] [Google Scholar]
- 9.Reece EA, Moore T. The diagnostic criteria for gestational diabetes: to change or not to change? Am J Obstet Gynecol. 2013;208:255–259. doi: 10.1016/j.ajog.2012.10.887. [DOI] [PubMed] [Google Scholar]
- 10.Selvin E, Parrinello CM, Sacks DB, Coresh J. Trends in prevalence and control of diabetes in United States, 1988–1994 and 1999–2010. Ann Intern Med. 2014;160:517–525. doi: 10.7326/M13-2411. [DOI] [PMC free article] [PubMed] [Google Scholar]
- 11.Holt RIJ, Sonksen PH. Growth hormone, IGF-1 and insulin and their abuse in sport. Br J Pharmacol. 2008;154:542–556. doi: 10.1038/bjp.2008.99. [DOI] [PMC free article] [PubMed] [Google Scholar]
- 12.Graham MR, Evans P, Davies B, Baker J. AAS, growth hormone and insulin abuse: psychological and neuroendo crine effects. Ther Clin Risk Manag. 2008;4:587–597. doi: 10.2147/tcrm.s2495. [DOI] [PMC free article] [PubMed] [Google Scholar]
- 13.Singh V, Krishnan S. An electrochemical mass sensor for diagnosing diabetes in human serum. Analyst. 2014;139:724–728. doi: 10.1039/c3an01542d. [DOI] [PubMed] [Google Scholar]
- 14.Singh V, Krishnan S. Voltammetric immunosensor assem bled on carbon-pyrenyl nanostructures for clinical diagnosis of type of diabetes. Anal Chem. 2015;87:2648–2654. doi: 10.1021/acs.analchem.5b00016. [DOI] [PMC free article] [PubMed] [Google Scholar]
- 15.Manley SE, Stratton IM, Clark PM, Luzio SD. Com parison of 11 human insulin assays: implications for clinical investigation and research. Clin Chem. 2007;53:922–932. doi: 10.1373/clinchem.2006.077784. [DOI] [PubMed] [Google Scholar]
- 16.Shen H, Aspinwall CA, Kennedy RT. Dual microcolumn immunoassay applied to determination of insulin secretion from single islets of Langerhans and insulin in serum. J Chromatogr, Biomed Appl. 1997;689:295–303. doi: 10.1016/s0378-4347(96)00336-2. [DOI] [PubMed] [Google Scholar]
- 17.Homola J, Yee SS, Gauglitz G. Surface plasmon resonance sensors: review. Sens Actuators, B. 1999;54:3–15. [Google Scholar]
- 18.Helmerhorst E, Chandler DJ, Nussio M, Mamotte CD. Real time and label free biosensing of molecular interactions by surface plasmon resonance: a laboratory medicine per spective. Clin Biochem Rev. 2012;33:161–173. [PMC free article] [PubMed] [Google Scholar]
- 19.Lee HJ, Nedelkov D, Corn RM. Surface plasmon resonance imaging measurements of antibody arrays for the mul tiplexed detection of low molecular weight protein biomarkers. Anal Chem. 2006;78:6504–6510. doi: 10.1021/ac060881d. [DOI] [PubMed] [Google Scholar]
- 20.Wang J, Munir A, Zhu Z, Zhou HS. Magnetic nanoparticle enhanced surface plasmon resonance sensing and its application for the ultrasensitive detection of magnetic nanoparticle-enriched small molecules. Anal Chem. 2010;82:6782–6789. doi: 10.1021/ac100812c. [DOI] [PubMed] [Google Scholar]
- 21.Jain PK, Huang X, El-Sayed IH, El-Sayed MA. Review of Some Interesting Surface Plasmon Resonance-enhanced Properties of Noble Metal Nanoparticles and Their Applications to Biosystems. Plasmonics. 2007;2:107–118. [Google Scholar]
- 22.Baek SH, Wark AW, Lee HJ. Dual nanoparticle amplified surface plasmon resonance detection of thrombin at subattomolar concentrations. Anal Chem. 2014;86:9824–9829. doi: 10.1021/ac5024183. [DOI] [PubMed] [Google Scholar]
- 23.Li G, Li X, Yang M, Chen M–M, Chen L-C, Xiong X–L. A gold nanoparticles enhanced surface plasmon resonance immunosensor for highly sensitive detection of ischemia modi fied albumin. Sensors. 2013;13:12794–12803. doi: 10.3390/s131012794. [DOI] [PMC free article] [PubMed] [Google Scholar]
- 24.Frasconi M, Tortolini C, Botre F, Mazzei F. Multifunctional Au nanoparticle dendrimer-based surface plasmon resonance bio-sensor and its application for improved insulin detection. Anal Chem. 2010;82:7335–7342. doi: 10.1021/ac101319k. [DOI] [PubMed] [Google Scholar]
- 25.Gobi KV, Iwasaka H, Miura N. Self-assembled PEG monolayer based SPR immunosensor for label-free detection of insulin. Biosens Bioelectron. 2007;22:1382–1389. doi: 10.1016/j.bios.2006.06.012. [DOI] [PubMed] [Google Scholar]
- 26.Carlsson J, Gullstrand C, Westermark GT, Ludvigsson J, Enander K, Liedberg B. An indirect competitive im muneassay for insulin autoantibodies based on surface plasmon resonance. Biosens Bioelectron. 2008;24:876–881. doi: 10.1016/j.bios.2008.07.018. [DOI] [PubMed] [Google Scholar]
- 27.Lahiri J, Isaacs L, Tien J, Whitesides GM. A strategy for the generation of surfaces presenting ligands for studies of binding based on an active ester as a common reactive intermediate: A surface plasmon resonance study. Anal Chem. 1999;71:777–790. doi: 10.1021/ac980959t. [DOI] [PubMed] [Google Scholar]
- 28.Krishnan S, Mani V, Wasalathanthri D, Kumar CV, Rusling JF. Attomolar detection of a cancer biomarker protein in serum by surface plasmon resonance using superpar amagnetic particle labels. Angew Chem, Int Ed. 2011;50:1175–1178. doi: 10.1002/anie.201005607. [DOI] [PMC free article] [PubMed] [Google Scholar]
- 29.Kruger NJ. The protein protocols handbook. Humana Press; 2009. pp. 17–24. [Google Scholar]
- 30.Bekard IB, Dunstan DE. Tyrosine autofluorescence as a measure of bovine insulin fibrillation. Biophys J. 2009;97:2521–2531. doi: 10.1016/j.bpj.2009.07.064. [DOI] [PMC free article] [PubMed] [Google Scholar]
- 31.Iwamoto GK, Van Wagenen RA, Andrade JD. Insulin adsorption. Intrinsic tyrosine interfacial fluorescence. J Colloid Interface Sci. 1982;86:581–585. [Google Scholar]
- 32.Findlay JWA, Dillard RF. Appropriate calibration curve fitting in ligand binding assays. AAPS J. 2007;9:E260–E267. doi: 10.1208/aapsj0902029. [DOI] [PMC free article] [PubMed] [Google Scholar]
- 33.Regonda S, Tian R, Gao J, Greene S, Ding J, Hu W. Sili con nanowire field-effect-transistor based biosensors: From sensitive to ultrasensitive. Biosens Bioelectron. 2013;45:245–251. doi: 10.1016/j.bios.2013.01.027. [DOI] [PubMed] [Google Scholar]
- 34.Xu M, Luo X, Davis JJ. The label free picomolar detec tion of insulin in blood serum. Biosens Bioelectron. 2013;39:21–25. doi: 10.1016/j.bios.2012.06.014. [DOI] [PubMed] [Google Scholar]
- 35.Luo X, Xu M, Freeman C, James T, Davis JJ. Ultrasensi tive label free electrical detection of insulin in neat blood serum. Anal Chem. 2013;85:4129–4134. doi: 10.1021/ac4002657. [DOI] [PubMed] [Google Scholar]
- 36.Szekeres PG, Leong K, Day TA, Kingston AE, Karran EH. Development of homogeneous 384-well high-throughput screening assays for Abeta1–40 and Abeta1–42 using AlphaScreen technology. J Biomol Screening. 2008;13:101–111. doi: 10.1177/1087057107312778. [DOI] [PubMed] [Google Scholar]
- 37.Morón B, Cebolla A, Manyani H, Álvarez-Maqueda M, Megías M, Thomas MC, López MC, Sousa C. Sensitive detection of cereal fractions that are toxic to celiac disease patients by using monoclonal antibodies to a main immunegenic wheat peptide. Am J Clin Nutr. 2008;87:405–414. doi: 10.1093/ajcn/87.2.405. [DOI] [PubMed] [Google Scholar]
Associated Data
This section collects any data citations, data availability statements, or supplementary materials included in this article.


