

Abstract
Here we report a facile strategy to the synthesis of silica-coated quantum dots (QDs) for in vivo imaging. All the QD synthesis and silanization steps are conducted in water and methanol under mild conditions without involving any organometallic precursors and high temperature, oxygen-free environments. The as-prepared silica-coated QDs possess high quantum yields and are extremely stable in mouse serum. In addition, the silanization method developed here produces nanoparticles (NPs) with small sizes that are difficult to achieve via conventional silanization methods. The silica coating helps to prevent the exposure of QD surface to the biological milieu and therefore increases the biocompatibility of QDs for in vivo applications. Interestingly, the silica-coated QDs exhibit a different biodistribution pattern than commercially available Invitrogen QD605 (carboxylate) with a similar size and emission wavelength. The Invitrogen QD605 exhibited predominant liver (57.2% ID g-1) and spleen (46.1% ID g-1) uptakes 30 mins after intravenous injection, whereas the silica-coated QDs exhibited much lower liver (16.2% ID g-1) and spleen (3.67% ID g-1) uptakes but higher kidney uptake (8.82% ID g-1), blood retention (15.0% ID g-1) and partial renal clearance. Overall, this straightforward synthetic strategy paves the way for routine and customized synthesis of silica-coated QDs for biological use.
Keywords: quantum dot, in vivo imaging, biodistribution, silica coating, biocompatible
1. Introduction
Quantum Dots are highly luminescent semiconductor nanocrystals possessing unique size-dependent optical and electronic properties.[1] These materials have recently been demonstrated to be very promising tools for non-invasive in vivo imaging and targeting[2-5] owing to their high photostabilities, broad absorption spectra, and large extinction coefficients over organic dyes.[6,7] However, the widespread use of QDs for in vivo applications is still restricted by a number of drawbacks. Current in vivo imaging using QDs suffers from the rapid clearance by the reticuloendothelial system (RES),[8,9] which significantly reduces the effective QD concentration in blood circulation and results in potential long-term toxicities. On the other hand, there is a lack of facile synthetic routes to generate highly biocompatible QDs. Given that most QDs are composed of toxic heavy metal ions, the surface coating is a critical parameter to ensure their biocompatibilities.[10,11] QDs encapsulated in robust non-toxic polymeric materials are recently shown to be non-toxic in vivo.[12] Current synthetic strategies of biocompatible QDs for in vivo studies usually involve high-temperature organometallic approaches[13] and the subsequent solubilization in aqueous solution using amphiphilic polymers[3,14] or phospholipid micelles.[2] The stringent reaction conditions and synthetic complexity not only hinder the routine and customized synthesis of QDs by the end users, but also make it difficult to prepare QDs with new surface coatings that may offer improved properties for in vivo applications. Another concern is the clearance of QDs from the body within a reasonable period before decomposition occurs. The renal system is considered the most efficient pathway for nanoparticle clearance. A recent study showed that zwitterionic cysteine-capped QDs with sub-5.5 nm hydrodynamic diameter (HD) could be excreted rapidly via urine,[15] while some other studies demonstrated the renal clearance of other nanomaterials with larger dimensions.[16,17]
Amorphous silica is a type of highly biocompatible material that is regularly used as food additives. Encapsulating QDs within silica is an ideal means to prevent the release of toxic QDs components into the biological milieu.[18] Different techniques such as microemulsion[19] and sol-gel[20] have been developed to generate silica-coated QDs, however, most of which are processed from those synthesized in organic solvents via organometallic routes. In addition, current applications of silica-coated QDs are primarily focused on in vitro cellular studies.[21-23] In view of potential in vivo applications, the biodistribution profile needs to be first elucidated to evaluate the usefulness and safety of these materials. The emerging water-based QDs synthesis presents a greener and more straightforward route to generate high-quality QDs for biological use. These QDs are usually synthesized and stabilized with monovalent thiol-ligands which can be further conjugated with biomolecules for cell labeling.[24] However, the dynamic dissociation and association of monovalent ligands could lead to the exposure and leaching of QD surface to the biological milieu and compromise the biocompatibility for in vivo applications. Direct processing of QDs prepared in water to generate biocompatible QDs has not been extensively studied. In this study we describe a facile strategy for consecutive synthesis and silanization of CdTe QDs in water and methanol. The as-prepared silica-coated QDs were fully characterized, and further evaluated for the first time for in vivo live animal imaging. A systemic study was conducted to elucidate the biodistribution profile of the silica-coated QDs in comparison with the commercially available Invitrogen QD605 (carboxylate).
2. Results and Discussion
2.1. Synthesis and characterization of silica-coated CdTe QDs
The synthesis of glutathione (GSH)-capped QDs was adapted from a previous reported protocol[25] with modifications. The reaction was conducted in 1.5 mL eppendorf tubes incubated on a heat block preheated to 100 °C. No complicated instruments or high-temperature oxygen-free environments are required for the synthesis. Prolonged heating of the reaction solution promoted the growth of nanocrystals which was accompanied by an increase in the emission maximum from 530 nm to 710 nm (Figure 1A). The QDs with 610 nm emission maxima possess the highest quantum yield (QY) (20%) and were used for the biodistribution study. Synthesis of CdTe QDs with other water-soluble thiol-containing ligands such as 3-mercaptopropionic acid (3-MPA) generated products with similar QYs. Argon protection didn't affect the QY. The hydrodynamic diameter (HD) of as-prepared QDs (λmax=610 nm) was determined via size exclusion chromatography (SEC) using a Superose 6 10/300 GL column calibrated with a series of protein standards (Supporting Information Figure S1). The materials exhibited a single narrow peak corresponding to a diameter of 11.5 nm (Figure 1D), indicating that monodisperse NPs were produced. High-resolution transmission electron microscopy (HRTEM) was also used to characterize GSH-capped CdTe QDs, showing spherical nanocrystallines with a 5 nm mean diameter (Figure 2A).
Figure 1.
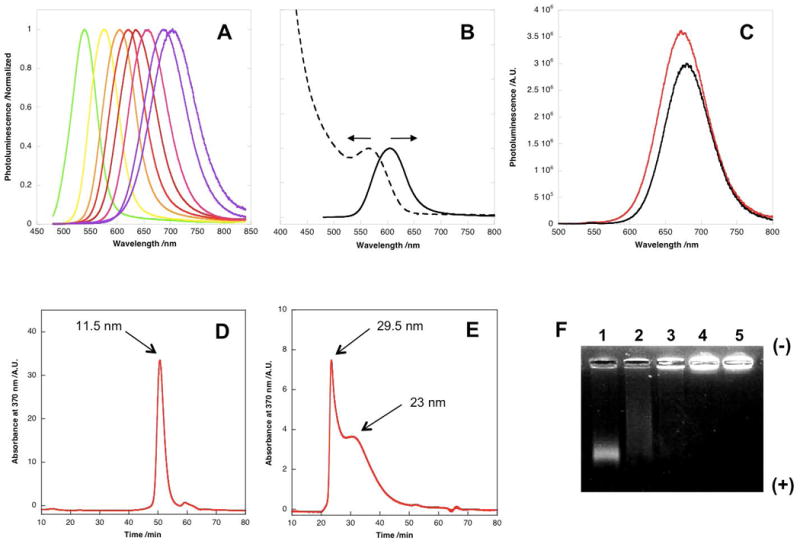
Characterization of CdTe QDs before and after silanization. (A) Normalized photoluminescence of glutathione-capped CdTe QDs with different sizes. The QD size is controlled by the reaction time. (B) Absorption (dashed line) and emission (solid line) spectra of GSH-capped QDs (λmax=610 nm). (C) Representative photoluminescence spectra of CdTe QDs before (black) and after (red) silanization. (D) Size exclusion chromatography of GSH-capped QDs shows monodisperse material with 11.5 nm in diameter. (E) Size exclusion chromatography of silica-coated QDs. Two peaks are observed corresponding to 23 nm and 29.5 nm in diameters respectively. The disappearance of the peak of 11.5 nm suggests the completion of silanization reaction. (F) Agarose gel (1%) electrophoresis of silica-coated QDs generated under different reaction conditions. Lane 1 shows the products of a well-controlled silanization reaction. A single tight band with high mobility is visualized, indicating that the materials are nearly monodispersed and negatively charged due to surface phosphonate groups. As the silanization reaction rate increases from lane 2 to 5 (controlled by the amount of TMAOH), the products show less defined bands and retarded mobilities as a result of increased overall QDs sizes.
Figure 2.
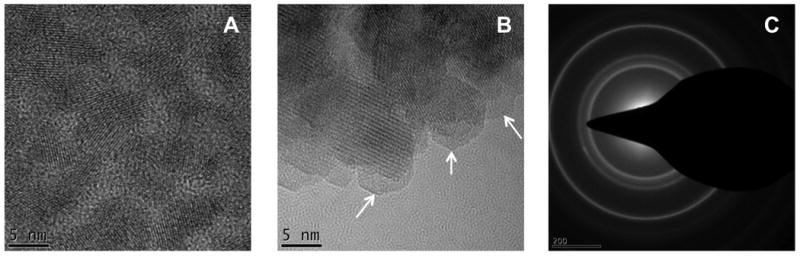
Nanocharacterization of CdTe QDs. High resolution transmission electron microscopy of CdTe QDs before and after silanization. (A) Monodisperse CdTe QDs with 5 nm mean diameter are visualized before silanization. (B) After silanization, the silica shells are identified by the low contrast amorphous outer layers (pointed by the arrows). (C) Selected area diffraction of silica-coated CdTe QDs confirms the formation of nanocrystalline materials.
QDs silanization was conducted consecutively post synthesis according to a method previously reported by Alivisatos et al. for TOPO (trioctylphosphine oxide)-capped QDs.[26] This method involves two steps. The first step is to displace the GSH molecules with a thiol-containing silane precursor – (3-mercaptopropyl)trimethoxysilane (MPS). The second step is to promote the polycondensation reaction of silane precursors along the QD surfaces (Scheme 1). Although the ligand exchange of TOPO with thiol-containing molecules is favorable, it remains a challenge for an efficient exchange between GSH and MPS molecules because both contain thiol groups. The exchange efficiency was enhanced by i) the addition of excess MPS molecules, and ii) the additive affinity of condensed MPS oligomers in the solution. The polycondensation of MPS was facilitated in the presence of tetramethylammonium hydroxide (TMAOH) at 60 °C, which leaded to the formation of a primary siloxane monolayer containing unreacted silanol groups for further condensation. A second silane precursor was subsequently reacted with the primary layer to form a multi-layered silica shell and introduced additional functional groups onto silica shell surface (Scheme 1). The silica-coated QDs generated from phosphonate silane (trihydroxysilyl-propyl methylphosphonate monosodium salt) are the most stable among tested. These QDs can be readily dispersed in H2O after silanization to form a clear solution. In comparison, the silica-coated QDs with primary amine groups are only stable under acidic condition (MES buffer pH 5.0∼6.5). The polyethylene glycol (PEG, n=6∼9) – terminated silica-coated QDs displayed moderate stability in H2O by forming an opaque suspension after intense sonication.
Scheme 1.
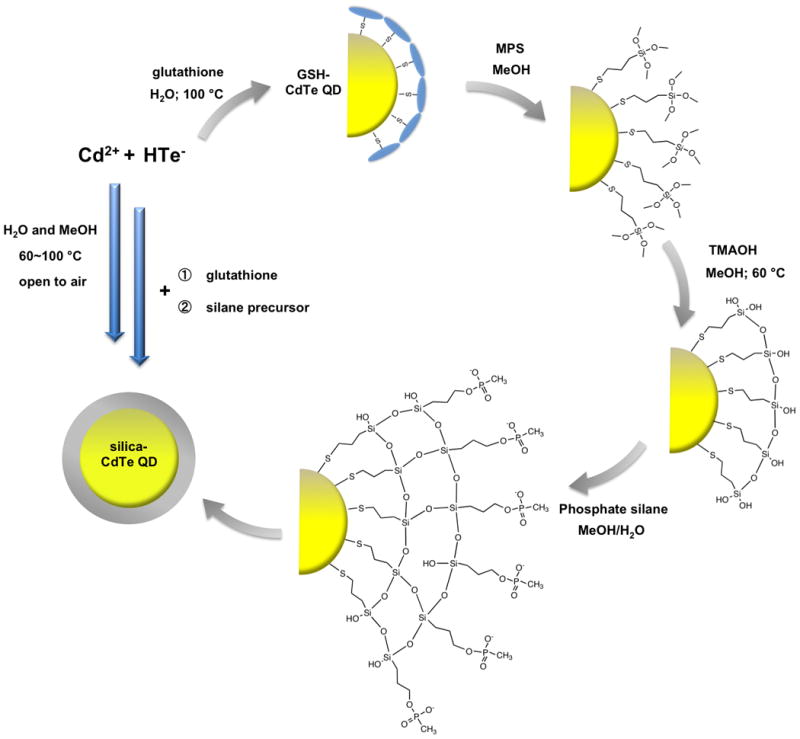
Schematic illustration of synthesis and silanization of CdTe QDs. All the reactions are completed in water and methanol under mild conditions and open to air. Glutathione is used as the original ligands during QD synthesis. Two silane precursors (MPS and phosphate silane) are used sequentially to generate the silica shell.
The phosphonate-terminated silica-coated QDs with robust stability and good solubility were characterized in detail before applied to biodistribution studies. As shown in Figure 1E, the HD of QDs increased from 11.5 nm to 23 ∼ 29.5 nm after silanization as a result of the formation of bulky silica shells. The SEC peak at 11.5 nm nearly disappeared, indicating the silanization was almost complete. It should be noted that the sub-30 nm NPs with a silica coating are usually difficult to produce via microemulsion. The QDs emission spectrum was slightly blue-shifted after silanization, suggesting possible surface atom leaching during the reaction. The QY of silica-coated QDs is 15%, higher than the values (8-10%) reported for the silica-coated QDs originally synthesized in organic solvents.[22,23] We used agarose gel (1%) electrophoresis to monitor the QD surface charge and the effects of reaction condition on the silica shell formation. As shown in Figure 1F, the silica-coated QDs displayed a single tight band with high mobility towards the anode, suggesting the materials are uniform and highly negatively charged as a result of the incorporation of phosphonate groups at the QD surfaces. Interestingly, the luminescence of GSH-capped QDs was completely quenched during electrophoresis (data not shown); this is likely caused by the disassociation of monovalent GSH molecules from the QD surface. The polycondensation reaction is facilitated under basic conditions using TMAOH as a catalyst and the reaction rate is highly dependent on the TMAOH concentration. A high concentration of TMAOH leads to a fast, uncontrolled reaction by forming visible aggregates in the solution. These materials exhibited retarded mobility in agarsoe gel compared to those generated under optimized conditions (Figure 1F). The silica-coated QDs were further characterized by HRTEM. As shown in Figure 2B, the silica shell can be identified by the low contrast amorphous outer layers (white arrows).
2.2. Evaluation of QDs stabilities and cytotoxicity
The purified GSH-capped and silica-coated QDs were separately incubated in mouse serum at 37 °C over a time course of 72 hours, and their stability was determined by measuring the change of QD luminescence intensity. As shown in Figure 3, little change of luminescence was observed for GSH-capped QDs and a gradual increase of luminescence was observed for silica-coated QDs, indicating that both types of QDs remained stable in mouse serum without decomposing or aggregating. A gradual increase of luminescence was also observed for slica-coated QDs incubated in pure water during 72 hours (Supporting Information Figure S2), suggesting that the increased luminescence is due to a better passivation from the silica shell itself but not from the components in serum. This improved passivation is likely caused by the continuous polycondensation within the silica shell, leading to a denser passivation layer.[27]
Figure 3.
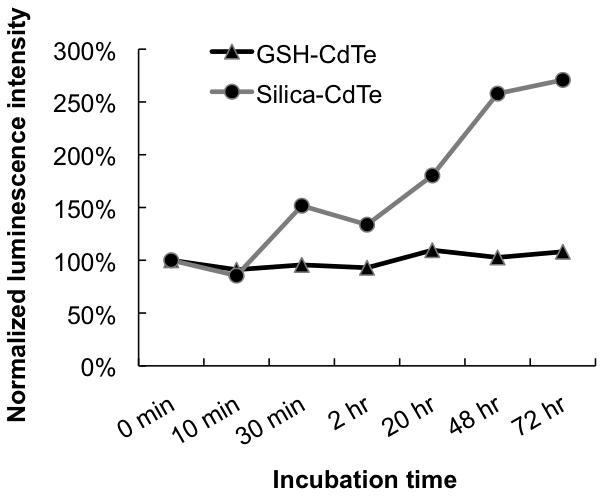
Stability of GSH-capped and silica-coated CdTe QDs in mouse serum. QDs are incubated in mouse serum at 37 °C over a 72hr time course. The stabilities of QDs are evaluated by monitoring the change of luminescence intensity during incubation. Minimal change of luminescence is observed for GSH-capped QDs and a gradual increase of luminescence is observed for silica-coated QDs, indicating both types of QDs remain stable in mouse serum without decomposing or aggregating. The increased luminescence of silica-coated QDs is likely due to the continuous polycondensation within the silica shell which leads to a denser passivation layer.
The cytotoxicity of silica-coated QDs were evaluated by incubating 100 nM and 500 nM QDs with live HeLa cells for 4 hours and 24 hours at 37 °C. The cell viabilities were determined using a commercial assay kit CCK-8. For all the conditions tested the cell viabilities were above 90%, suggesting the silica-coated QDs are non-toxic (Supporting Information Figure S3). Additionally, no free cadmium was detected in silica-coated QDs solution after 72 hours incubation using inductively coupled plasma atomic emission spectroscopy (ICP-AES), indicating that the release of Cd2+ from the CdTe core of the silica-coated QDs is negligible in 72 hours.
2.3. Biodistribution of silica-coated CdTe QDs
Encapsulating heavy-metal containing QDs in a non-toxic polymeric matrix is an ideal means to prevent the release of QD components into biological milieu which is a major safety concern of QDs for clinical uses. Currently, the applications of silica-coated QDs are only demonstrated for in vitro cell imaging and targeting. Very few studies have been conducted for in vivo imaging. We present here the first systemic study on the biodistribution of silica-coated QDs in a nude mouse model. The commercially available QDs – Invitrogen QD605 with an amphiphilic polymer coating that presents carboxylate groups at the surface were used for comparison. 200 pmole of QDs were injected intravenously into each mouse via tail vein. The mice were sacrificed after 30 min and the major organs and blood were collected for biodistribution analyses. We used ICP-AES to quantify the cadmium level in each organ after the complete digestion of QDs with nitric acid. As shown in Figure 4A, the silica-coated QDs were mainly distributed in liver (16.2% ID g-1), blood (15.0% ID g-1), kidney (8.82% ID g-1), spleen (3.67% ID g-1), lung (6.77% ID g-1), and heart (5.14% ID g-1), whereas the Invitrogen QD605 exhibited predominant spleen (46.1% ID g-1) and liver (57.2% ID g-1) uptakes, and negligible kidney uptake (0.971% ID g-1) and blood retention (0.0639% ID g-1). Another important difference of biodistribution is the much higher kidney uptake observed for silica-coated QDs, which indicates that the renal clearance of silica-coated QDs could possibly occur.
Figure 4.
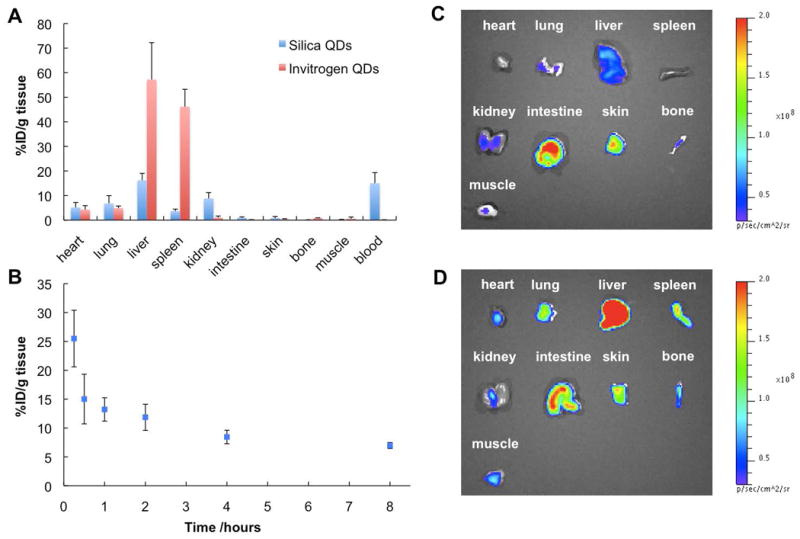
Biodistribution study of silica-coated QDs (λmax=610 nm) and Invitrogen QD605 (carboxylate). (A) Quantitative analysis of biodistribution of silica-coated QDs and Invitrogen QDs using ICP-AES. The nude mice were sacrificed 30 min after tail vein injection of QDs. QDs were completely digested using concentrated nitric acid before ICP-AES measurements. Silica-coated QDs exhibit less liver and spleen uptakes but higher kidney uptake and blood retention compared to Invitrogen QDs. Five mice were examined for each type QDs. (B) Blood retention kinetics of silica-coated QDs. Three mice were examined at each time point. (C) Fluorescence image of organs and tissues excised from the mouse injected with silica-coated QDs (shown in Figure 5A). The high signals in intestine and skin are due to autofluorescence. (D) Fluorescence image of organs and tissues excised from the mouse injected with Invitrogen QDs (shown in Figure 5B). It should be noticed that the fluorescence images are not quantitative considering the depth of tissues where QDs localized and different quantum yields of silica-coated and Invitrogen QDs.
It is believed that the liver and spleen uptakes are caused by the adsorption of opsonizing proteins onto NP surface which in turn makes the NPs more prone to be recognized and cleared by RES.[9] Therefore, the decreased spleen and liver uptakes and prolonged blood circulation of silica-coated QDs suggest that the silica coating is more resistant to opsonization and RES clearance than the amphiphilic polymer coated Invitrogen QDs. We therefore conducted in vitro experiments to investigate the non-specific adsorption of silica-coated QDs and Invitrogen QDs with serum proteins. The QDs were incubated in 50% fetal bovine serum (FBS) at 37 °C for 4 hours and the size changes were characterized by SEC. As shown in Figure S4 (Supporting Information), only a small portion of silica-coated QDs exhibit protein adsorption after incubation. In contrast, all the Invitrogen QDs exhibit protein adsorption with a clear shift in the peak on SEC. These results are consistent with the less RES clearance of silica-coated QDs observed in vivo.
The blood retention kinetics of silica-coated QDs was studied with six different time points. As shown in Figure 4B, the QDs level in blood was found to be highest at 15 min (25.5% ID g-1) and decrease gradually afterwards (30 min (15.0% ID g-1), 1 hr (13.2% ID g-1), 2 hr (11.9% ID g-1), 4 hr (8.45% ID g-1), 8 hr (6.96% ID g-1)). The long blood retention time of silica-coated QDs is quite favorable for in vivo imaging which usually requires long-term accumulation in the target site.
The organs excised from the mice injected with silica-coated QDs and Invitrogen QD605 were imaged using the IVIS imaging system. The GFP excitation filter and DsRed emission filter were used to collect the fluorescence signals in the range of 575 to 650 nm. As shown in Figure 4C and 4D, the fluorescence signals from liver, spleen, and kidney are in good agreement with the results from the ICP-AES quantification. It should be noted that the fluorescence-based imaging is not fully quantitative given that fluorescence intensity is tissue depth-dependent and that the silica-coated QDs and Invitrogen QD605 have different QYs. The strong fluorescence signals in intestine and skin are due to the autofluorescence rather than QDs, as revealed from the control mice injected with 1X PBS (Supporting Information Figure S5).
Next, we performed the whole-body imaging of the mice injected with silica-coated QDs and Invitrogen QD605 over a 30 min time course. The mouse injected with 1X PBS was also imaged to detect the background fluorescence. As shown in Figure 5A, a gradual increase of fluorescence in bladder was detected over the first 30 min after injection with silica-coated QDs, while the bladder signals in the control mice remained unchanged (Supporting Information Figure S6). This indicates that the silica-coated QDs were likely excreted into bladder via the renal system. The urine samples were then collected and analyzed using SEC. While the control urine sample didn't show any peak larger than 10 nm, the urine collected from the mouse injected with silica-coated QDs exhibited a peak corresponding to a size of 30 nm, which indicated the presence of QDs (Figure 5C). The percentage of excreted QDs was estimated by the SEC peak integration, which was about 2% of total injected silica-coated QDs (13% ID g-1). Previous studies by Bawendi and Frangioni reported that the 5.5 nm HD is a threshold for rapid and efficient urinary excretion.[15] The silica-coated QDs have significantly bigger HD and are therefore cleared at a lower rate. In fact, the urine excretion of bigger sized silica NPs (above 50 nm) was previously reported.[17,28] Since the biomolecule-functionalized nanoparticles are typically above 20 nm, the clearance of these particles is of great interest to the biomedical applications in future. The mouse injected with Invitrogen QD605 was also imaged for comparison. As shown in Figure 5B, a strong QD signal was detected in the liver 1 min after tail vein injection, suggesting rapid RES clearance of Invitrogen QD605. This result is in consistent with the biodistribution studies of Invitrogen carboxyl QD525 and QD800 monitored by microPET.[29] No QD signals were detected from the urine sample collected from the mouse injected with QD605.
Figure 5.
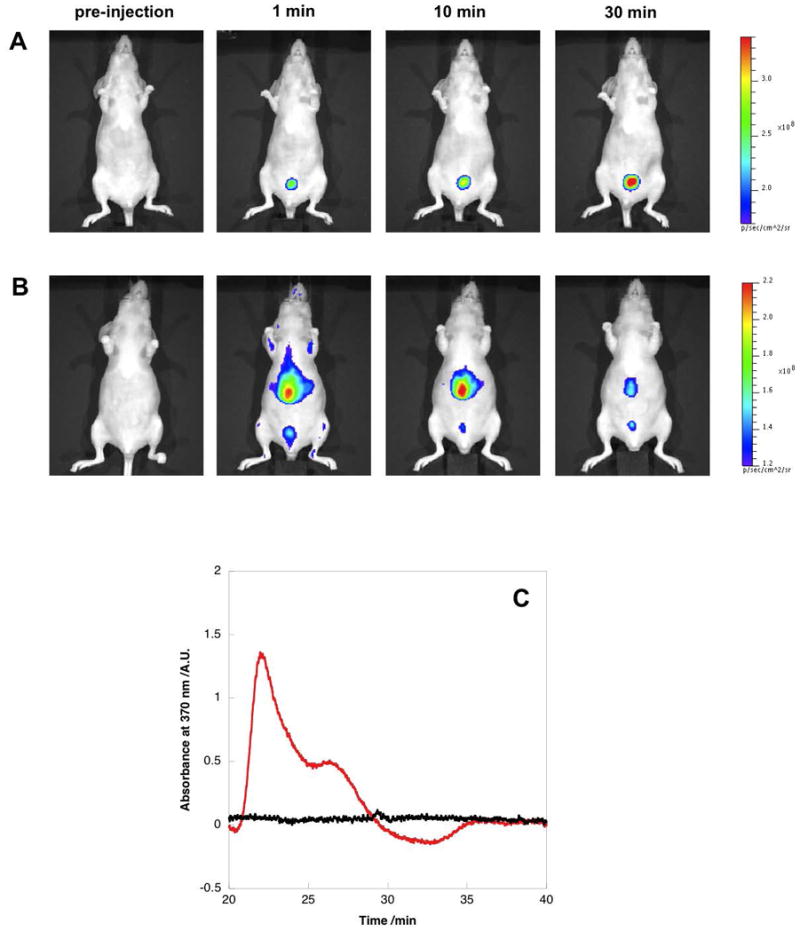
Whole-body imaging and renal clearance of silica-coated QDs. (A) Representative whole-body fluorescence images of a nude mouse injected with silica-coated QDs during 30 min time course. A strong signal from bladder was observed, indicating the possible renal clearance of silica-coated QDs. (Five mice were examined for the study and the results remain consistent.) (B) Representative whole-body fluorescence images of a nude mouse injected with Invitrogen QD605 during 30 min time course. The main signal comes from the liver. (Five mice were examined for the study and the results remain consistent.) (C) Size exclusion chromatography analysis of urine samples collected from nude mice injected with silica-coated QDs (red line) and 1X PBS (black line). The peak at 30 nm correlates with QDs signal. The amount of urinarily excreted silica-coated QDs is about 2% of the totally injected dose.
The biodistribution study is a crucial step to evaluate the usefulness of contrast agents for in vivo imaging. Rapid RES clearance of NPs will limit their applications to site-specific targeting and imaging which requires prolonged circulation of NPs in the body. The silica coating presents a promising strategy to suppress RES clearance and enhance the blood retention. Moreover, the partial renal clearance observed with our silica-coated QDs further signifies their biocompatibility for in vivo applications.
3. Conclusions
We develop a facile strategy for the synthesis of biocompatible silica-coated QDs of which all the steps are conducted in water and methanol under ambient conditions. The protocol is much simplified and environmentally friendly against conventional organometallic routes. The as-prepared QDs exhibit good water solubility and high serum stability. Given the increasing examples of different QDs prepared in water, this approach may serve as a general strategy to prepare biocompatible QDs with various compositions and wavelengths and should greatly expand the routine use of QDs for in vivo experiments. In addition, the silica-coated QDs exhibit a more favorable biodistribution pattern over the commercially available QDs including low liver and spleen uptakes and prolonged blood circulation, which further enhances their compatibility for in vivo targeting and imaging.
4. Experimental Section
Materials
All the chemicals are from Sigma-Aldrich unless otherwise noted. Nude mice (female, 6 weeks old) are from Charles River Breeding Laboratories. Animal use protocols were reviewed and approved by the Institutional Animal Care Use Committee of Stanford University.
Synthesis of GSH-capped CdTe QDs
The GSH-capped CdTe QDs were synthesized according to a previously reported protocol with modifications.[25] Briefly, to prepare NaHTe solution, NaBH4 (25 mg) was dissolved in H2O (1 mL) and then mixed with 40 mg tellurium powder. The reaction mixture was left at room temperature for 8 hrs until the solution turned to purple. To synthesize CdTe QDs, a solution containing CdCl2 (1.25 mM) and GSH (1.5 mM) was prepared and the pH was adjusted to 9.0 with NaOH (1 M). Afterwards the as-prepared NaHTe solution (2 μL) was quickly injected into CdCl2-GSH solution (1 mL) and the mixture was agitated via vortex for 10 seconds to facilitate nucleation. This solution was then incubated on a heat block preheated to 100 °C to promote nanocrystal growth. Aliquot solution was collected at different time points and the reaction was quenched on ice. QDs with red-shifted emission wavelengths were obtained with prolonged incubation time.
QDs silanization
The as-prepared GSH-capped CdTe QDs (1 mL) were precipitated using two volume of tetrahydrofuran (THF) to remove free GSH molecules and then resuspended in methanol (330 μL) containing MPS (18 μmole), after which methanol (3 mL) and TMAOH (0.2 M, 6 μL) were added. The solution was sonicated at room temperature for 40 min and then at 60 °C for 30 min. For the second step, H2O in methanol (10% v/v, 670 μL) containing phosphonate silane (22 μmol) were added and the solution was sonicated at room temperature for 30 min then shaken for 4 hrs. The silanized QDs were then precipitated and washed with two volume of THF and resuspended in pure H2O.
Emission, absorption spectra and QY and QD concentration determination
The QDs emission spectra were recorded using a Jobin-Yvon FluoroMax-3 fluorometer with 460 nm excitation wavelength. The QDs absorption spectra were obtained using the Agilent 8453 UV-Vis spectrometer. Fluorescein was used as the standard for the QY determination. The QYs of GSH-capped and silica-coated QDs were calculated according to the following equation:
where ϕ is the quantum yield, Int is the area under the emission peak, A is absorbance at the excitation wavelength, and η is the refractive index of the solvent. The subscript s and x denote the respective values of the standard and QDs (The QY of fluorescein is 0.79 in ethanol). The QD concentration is calculated according to a method reported by Peng et al.[30]
Size exclusion chromatography
SEC was performed using a Superose 6 10/300 GL column conjugated to a Dionex GP50 HPLC equipped with Ultimate 3000 Photodiode Array Detector. The flow rate was fixed at 0.35 mL/min and each sample was run for total 80 min. 1X PBS (pH 7.4) was used as the elution buffer. Five proteins – blue dextran (29.5 nm), thyroglobulin (18.8 nm), alcohol dehydrogenase (10.1 nm), ovalbumin (6.1 nm), and lysozyme (3.9 nm) were used for QD sizing. The QD signals were monitored based on the absorbance at 370 nm.
Agarose gel electrophoresis
QD samples were mixed with 6X agarose loading dye before loaded onto 1% agarose gel. 1X TBE was used as running buffer. The gel was run for 1 hour at a constant voltage of 35 V and then imaged on a UV-Transilluminator of the UVP BioDoc-It Imaging System with an exaltation wavelength of 365 nm.
Transmission electron microscopy
Purified GSH-capped or silica-coated QDs (5 μL) was dropped on a 3 mm copper grid covered with a continuous layer of carbon film (Ted Pella). The grid was then dried in a vacuum desiccator for 2 hrs. The QDs were imaged under a FEI Tecnai G2 F20 transmission electron microscope operated at 200 kV.
QDs stability measurement
The GSH-capped QDs and silica-coated QDs were first purified and concentrated by filtering through Microcon YM-50 centrifugal devices and then resuspended in pure mouse serum or pure water to reach a final concentration of 500 nM. The solutions were incubated at 37 °C over a 72 hour time course and aliquot solutions were taken out at each time point for luminescence measurement.
Biodistribution quantification using ICP-AES
Silica-coated QDs or Invitrogen QD605 (200 pmol) were injected into each nude mouse intravenously via tail vain. The mice were sacrificed 30 min after the QDs injection. Five mice were examined for each type of QDs. The organs and blood were collected and weighted before digested with 70% nitric acid (1 mL) by heating at 90 °C for 3 hrs. The insoluble residues were removed by passing the solutions through 0.45 μm cellulose filter. The digested samples were diluted with pure H2O (4 mL). The amount of cadmium element in each sample was determined using a TJA IRIS Advantage/1000 Radial ICAP Spectrometer based on the cadmium emission at 226.5 nm. A dilution series of QDs solution with known concentration was measured to generate the calibration curve.
Blood retention kinetics of silica-coated QDs
Silica-coated QDs (200 pmol) were injected into each nude mouse intravenously via tail vain. Three mice were sacrificed at each time point and the blood was collected from each mouse to determine the QD amount by ICP-AES. Six time points (15 min, 30 min, 1 hr, 2 hr, 4 hr, 8 hr) were investigated for the study.
Non-specific adsorption of QDs with serum proteins
Silica-coated QDs and Invitrogen QD605 (each at 500 nM) were mixed with equal volume of 100% FBS (FBS final concentration: 50%) and incubated at 37 °C for 4 hours. The size changes were determined via SEC.
Whole body fluorescence imaging
Silica-coated QDs or Invitrogen QD605 (200 pmol) were injected into each nude mouse intravenously via tail vain. The mice were subsequently anesthetized with isofluorane and transferred to the chamber of IVIS 109 imaging system. Fluorescence images were recorded over a 30 min time course. The mice before injection were also imaged to record background fluorescence. GFP excitation filter (445-490 nm) and DsRed emission filter (575-650 nm) were used for image collections. Five mice were examined for each type of QDs and the results are consistent for all the mice tested.
Cytotoxicity measurements of silica-coated QDs
HeLa cells were cultured as subconfluent monolayers on cell culture flasks (75 cm2) with vent caps in 1X minimum essential α medium supplemented with fetal bovine serum (10% v/v) in a humidified incubator at 37 °C containing CO2 (5%). HeLa cells that had been grown to subconfluence were dissociated from the surface with trypsin for 10 min at 37 °C, and aliquots (150 μL) were seeded (1.0 × 10⁴ cells) into a 96-well clear microplate. After overnight incubation, silica-coated QDs were added into each well to reach a final concentration of 100 nM or 500 nM. The cells were then incubated with silica-coated QDs for 4 hours or 24 hours. Quadruplicate experiments were done for each condition. Cells treated with media alone and Triton X-100 were used as low and high cell death controls respectively. After incubation with CCK-8 (Dojindo) at 37 °C for 2 hours, the absorbance of each sample was measured (λ =450 nm) on a plate reader (Tecan Infinite M1000).
Supplementary Material
Acknowledgments
We gratefully thank Dr. Gaolin Liang, Dr. Hexin Xie, Dr. Zuyong Xia, Man-Lung Ma and Dawoon Jung for their helpful discussions and suggestions and Dr. Guangchao Li for his assistance with ICP-AES measurements. This work was supported in part by the National Cancer Institute (Grant 1R01CA135294-01) and the Stanford University National Cancer Institute Centers of Cancer Nanotechnology Excellence (Grant 1U54CA119367-01).
Footnotes
Supporting Information is available on the WWW under http://www.small-journal.com or from the author.
Contributor Information
Nan Ma, Molecular Imaging Program at Stanford (MIPS), Department of Radiology, Stanford University, Lucas Center, 1201 Welch Road, Stanford, CA 94305-5484 (USA)
Ann F. Marshall, Geballe Laboratory for Advanced Materials, Stanford University, McCullough Building, 476 Lomita Mall, Stanford, CA 94305-4045 (USA)
Sanjiv S. Gambhir, Molecular Imaging Program at Stanford (MIPS), Departments of Radiology and Bioengineering, Bio-X Program, Stanford University, 318 Campus Drive, Palo Alto, CA 94305-5427 (USA)
Jianghong Rao, Email: jrao@stanford.edu, Molecular Imaging Program at Stanford (MIPS), Department of Radiology, Stanford University, Lucas Center, 1201 Welch Road, Stanford, CA 94305-5484 (USA); Bio-X Program, Biophysics Program, Department of Chemistry, Stanford University, Lucas Center, 1201 Welch Road, Stanford, CA 94305-5484 (USA).
References
- 1.Alivisatos AP. Science. 1996;271:933–937. [Google Scholar]
- 2.Dubertret B, Skourides P, Norris DJ, Noireaux V, Brivanlou AH, Libchaber A. Science. 2002;298:1759–1762. doi: 10.1126/science.1077194. [DOI] [PubMed] [Google Scholar]
- 3.Gao X, Cui Y, Levenson RM, Chung LWK, Nie S. Nat Biotechnol. 2004;22:969–976. doi: 10.1038/nbt994. [DOI] [PubMed] [Google Scholar]
- 4.Kim S, Lim YT, Soltesz EG, De Grand AM, Lee J, Nakayama A, Parker JA, Mihaljevic T, Laurence RG, Dor DM, Cohn LH, Bawendi MG, Frangioni JV. Nat Biotechnol. 2004;22:93–97. doi: 10.1038/nbt920. [DOI] [PMC free article] [PubMed] [Google Scholar]
- 5.So MK, Xu C, Loening AM, Gambhir SS, Rao J. Nat Biotechnol. 2006;24:339–343. doi: 10.1038/nbt1188. [DOI] [PubMed] [Google Scholar]
- 6.Michalet X, Pinaud FF, Bentolila LA, Tsay JM, Doose S, Li JJ, Sundaresan G, Wu AM, Gambhir SS, Weiss S. Science. 2005;307:538–544. doi: 10.1126/science.1104274. [DOI] [PMC free article] [PubMed] [Google Scholar]
- 7.Medintz IL, Uyeda HT, Goldman ER, Mattoussi H. Nat Mater. 2005;4:435–446. doi: 10.1038/nmat1390. [DOI] [PubMed] [Google Scholar]
- 8.Ballou B, Lagerholm BC, Ernst LA, Bruchez MP, Waggoner AS. Bioconjugate Chem. 2004;15:79–86. doi: 10.1021/bc034153y. [DOI] [PubMed] [Google Scholar]
- 9.Schipper ML, Iyer G, Koh AL, Cheng Z, Ebenstein Y, Aharoni A, Keren S, Bentolila LA, Li J, Rao J, Chen X, Banin U, Wu AM, Sinclair R, Weiss S, Gambhir SS. Small. 2009;5:126–134. doi: 10.1002/smll.200800003. [DOI] [PMC free article] [PubMed] [Google Scholar]
- 10.Derfus AM, Chan WCW, Bhatia SN. Nano Lett. 2004;4:11–18. doi: 10.1021/nl0347334. [DOI] [PMC free article] [PubMed] [Google Scholar]
- 11.Chang E, Thekkek N, Yu WW, Colvin VL, Drezek R. Small. 2006;2:1412–1417. doi: 10.1002/smll.200600218. [DOI] [PubMed] [Google Scholar]
- 12.Hauck TS, Anderson RE, Fischer HC, Newbigging S, Chan WCW. Small. 2010;6:138–144. doi: 10.1002/smll.200900626. [DOI] [PubMed] [Google Scholar]
- 13.Murray CB, Norris DJ, Bawendi MG. J Am Chem Soc. 1993;115:8706–8715. [Google Scholar]
- 14.Pellegrino T, Manna L, Kudera S, Liedl T, Koktysh D, Rogach AL, Keller S, Rädler J, Natile G, Parak WJ. Nano Lett. 2004;4:703–707. [Google Scholar]
- 15.Choi HS, Liu W, Misra P, Tanaka E, Zimmer JP, Ipe BI, Bawendi MG, Frangioni JV. Nat Biotechnol. 2007;25:1165–1170. doi: 10.1038/nbt1340. [DOI] [PMC free article] [PubMed] [Google Scholar]
- 16.Singh R, Pantarotto D, Lacerda L, Pastorin G, Klumpp C, Prato M, Bianco A, Kostarelos K. Proc Natl Acad Sci USA. 2006;103:3357–3362. doi: 10.1073/pnas.0509009103. [DOI] [PMC free article] [PubMed] [Google Scholar]
- 17.He X, Nie H, Wang K, Tan W, Wu X, Zhang P. Anal Chem. 2008;80:9597–9603. doi: 10.1021/ac801882g. [DOI] [PubMed] [Google Scholar]
- 18.Zhang T, Stilwell JL, Gerion D, Ding L, Elboudwarej O, Cooke PA, Gray JW, Alivisatos AP, Chen FF. Nano Lett. 2006;6:800–808. doi: 10.1021/nl0603350. [DOI] [PMC free article] [PubMed] [Google Scholar]
- 19.Selvan ST, Tan TT, Ying JY. Adv Mater. 2005;17:1620–1625. [Google Scholar]
- 20.Nann T, Mulvaney P. Angew Chem Int Ed. 2004;43:5393–5396. doi: 10.1002/anie.200460752. [DOI] [PubMed] [Google Scholar]
- 21.Bruchez M, Jr, Moronne M, Gin P, Weiss S, Alivisatos AP. Science. 1998;281:2013–2016. doi: 10.1126/science.281.5385.2013. [DOI] [PubMed] [Google Scholar]
- 22.Selvan ST, Patra PK, Ang CY, Ying JY. Angew Chem Int Ed. 2007;46:2448–2452. doi: 10.1002/anie.200604245. [DOI] [PubMed] [Google Scholar]
- 23.Fu A, Gu W, Boussert B, Koski K, Gerion D, Manna L, Le Gros M, Larabell CA, Alivisatos AP. Nano Lett. 2007;7:179–182. doi: 10.1021/nl0626434. [DOI] [PMC free article] [PubMed] [Google Scholar]
- 24.Zheng Y, Gao S, Ying JY. Adv Mater. 2007;19:376–380. [Google Scholar]
- 25.Ma N, Sargent EH, Kelley SO. Nat Nanotechnol. 2009;4:121–125. doi: 10.1038/nnano.2008.373. [DOI] [PMC free article] [PubMed] [Google Scholar]
- 26.Gerion D, Pinaud F, Williams SC, Parak WJ, Zanchet D, Weiss S, Alivisatos AP. J Phys Chem B. 2001;105:8861–8871. [Google Scholar]
- 27.Huang X, Schmucker A, Dyke J, Hall SM, Retrum J, Stein B, Remmes N, Baxter DV, Dragnea B, Bronstein LM. J Mater Chem. 2009;19:4231–4239. doi: 10.1039/b821917f. [DOI] [PMC free article] [PubMed] [Google Scholar]
- 28.Barbé C, Bartlett J, Kong L, Finnie K, Lin HQ, Larkin M, Calleja S, Bush A, Calleja G. Adv Mater. 2004;16:1959–1966. [Google Scholar]
- 29.Schipper ML, Cheng Z, Lee SW, Bentolila LA, Iyer G, Rao J, Chen X, Wu AM, Weiss S, Gambhir SS. J Nucl Med. 2007;48:1511–1518. doi: 10.2967/jnumed.107.040071. [DOI] [PMC free article] [PubMed] [Google Scholar]
- 30.Yu WW, Qu L, Guo W, Peng X. Chem Mater. 2003;15:2854–2860. [Google Scholar]
Associated Data
This section collects any data citations, data availability statements, or supplementary materials included in this article.