

Abstract
While cancers grow in their hosts and evade host immunity through immunoediting and immunosuppression1–5, tumors are rarely transmissible between individuals. Much like transplanted allogeneic organs, allogeneic tumors are reliably rejected by host T cells, even when the tumor and host share the same major histocompatibility complex (MHC) alleles, the most potent determinants of transplant rejection6–10. How such tumor-eradicating immunity is initiated remains unknown, though elucidating this process could provide a roadmap for inducing similar responses against naturally arising tumors. We found that allogeneic tumor rejection is initiated by naturally occurring tumor-binding IgG antibodies, which enable dendritic cells (DC) to internalize tumor antigens and subsequently activate tumor-reactive T cells. We exploited this mechanism to successfully treat autologous and autochthonous tumors. Either systemic administration of DC loaded with allogeneic IgG (alloIgG)-coated tumor cells or intratumoral injection of alloIgG in combination with DC stimuli induced potent T cell mediated anti-tumor immune responses, resulting in tumor eradication in mouse models of melanoma, pancreas, lung and breast cancer. Moreover, this strategy led to eradication of distant tumors and metastases, as well as the injected primary tumors. To assess the clinical relevance of these findings, we studied antibodies and cells from patients with lung cancer. T cells from these patients responded vigorously to autologous tumor antigens after culture with alloIgG-loaded DC, recapitulating our findings in mice. These results reveal that tumor-binding alloIgG can induce powerful anti-tumor immunity that can be exploited for cancer immunotherapy.
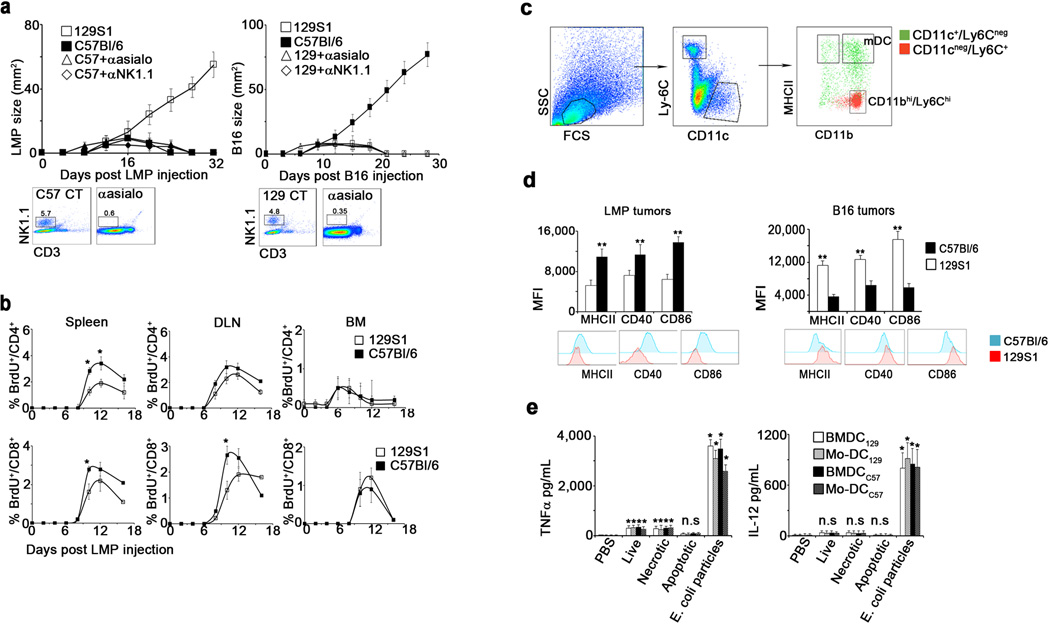
To study the basis of allogeneic tumor rejection, we examined the immune response to tumors in MHC-matched allogeneic mice (illustrated in Fig. 1a). B16 melanoma cells expanded continuously in syngeneic C57Bl/6 hosts yet spontaneously regressed in allogeneic 129S1 hosts (Fig. 1b). Conversely, LMP pancreatic tumor cells, isolated from KrasG12D/+;LSL-Trp53R172H/+;Pdx-1-Cre mice11, grew steadily in 129S1 mice but spontaneously regressed in C57Bl/6 animals (Fig. 1b). Depletion of NK cells did not prevent tumor rejection (Extended Data 1a). In contrast, depletion of CD4+ or CD8+ T cells prior to allogeneic tumor inoculation prevented tumor regression (Fig. 1b). T cell proliferation and tumor infiltration began by week 1 (Fig. 1c, Extended Data 1b). Additionally, allogeneic tumors contained more mature myeloid DC (mDC, Ly6C−/CD11b+/CD11c+/MHCII+/CD64dim) and fewer SSClow/CD11bhi/Ly6Chi/MHCII− myeloid cells than syngeneic tumors (Fig. 1d, Extended Data 1c). Even at day 3, mDC in allogeneic tumors expressed higher levels of MHCII, CD86 and CD40 compared to mDC in syngeneic tumors, reflecting activation (Extended Data 1d). Allogeneic mDC internalized more tumor cell-derived molecules from CFSE-labeled LMP cells (Fig. 1e). However, co-culture of DC with allogeneic tumor cells induced negligible activation or tumor antigen uptake (Fig. 1f, Extended Data 1e), demonstrating that additional factors contribute to DC activation in vivo.
Figure 1. Tumor-binding antibodies initiate rejection of allogeneic tumors.

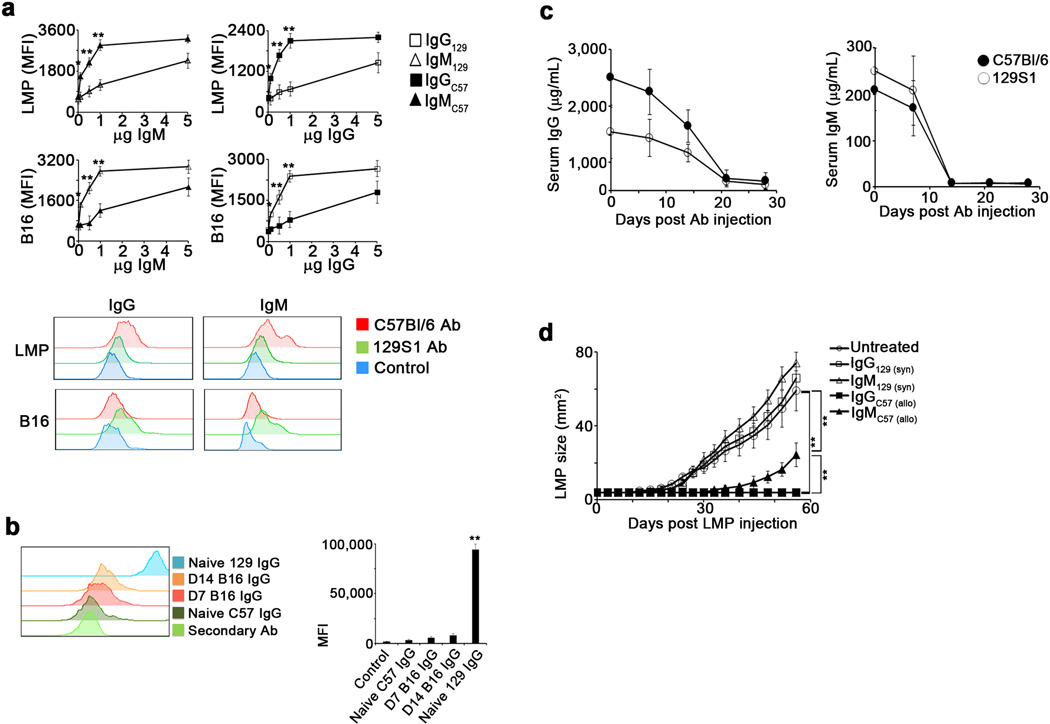
a. Experimental design: Injection of LMP and B16 cells s.c. into syngeneic and allogeneic hosts. b. Growth of LMP and B16 tumors in C57Bl/6, 129S1, CD4+ cell-depleted or CD8+ cell-depleted allogeneic mice (n=6). c. Percentages of LMP-infiltrating CD4+ and CD8+ T cells among CD45+ cells (n=5). d. Percentages of LMP-infiltrating CD11bhi/Ly6Chi cells and mature DC among total cells (n=4). e. Myeloid cells in the draining lymph nodes of mice inoculated with CFSE-labeled LMP cells 3d earlier (n=5). f. Tumor uptake, MHCII and CD86 expression by BMDC and blood monocyte-derived (Mo)-DC incubated overnight with CFSE-labeled live, frozen/thawed (necrotic), or mitomycin C-treated (apoptotic) LMP cells or fluorescein-labeled E. coli BioParticles (n=4). g. IgG and IgM bound in vivo to CFSE-labeled LMP cells 48h after tumor inoculation (n=5). h. and i. Representative staining of tumor sections by IgM and IgG 24h following inoculation of CFSE-labeled LMP cells. j. Tumor size in 129S1, C57Bl/6 and B cell-depleted allogeneic hosts (n=5). k. B16 size in naive mice or mice injected with syngeneic or allogeneic antibodies (n=5). B16 size in naïve C57Bl/6 and FcγR KO mice injected with allogeneic antibodies (n=5). Experiments were independently repeated at least 3 times and analyzed by Mann–Whitney U test. Asterisk (*) denotes p<0.05 and two asterisks (**) denote p<0.01.
Interestingly, IgM and IgG antibodies were bound to allogeneic, but not syngeneic, tumor cells within 24 hours following tumor inoculation (Fig. 1g–i), before T cells appeared (Fig. 1c). Moreover, allogeneic antibodies bound tumor cells more effectively than syngeneic antibodies (Extended Data 2a), including syngeneic antibodies from tumor-bearing mice (Extended Data 2b). To assess the potential role of antibodies in tumor rejection, B cells were depleted before mice were challenged with allogeneic tumors (Extended Data 2c). Antibody depletion accelerated tumor development and delayed or prevented tumor rejection (Fig. 1j). Moreover, adoptive transfer of allogeneic IgG, but not IgM, enabled rejection of syngeneic tumors (Fig. 1k, Extended Data 2d). This effect was abrogated in Fcγ receptor (FcγR)-deficient mice (Fig. 1k).
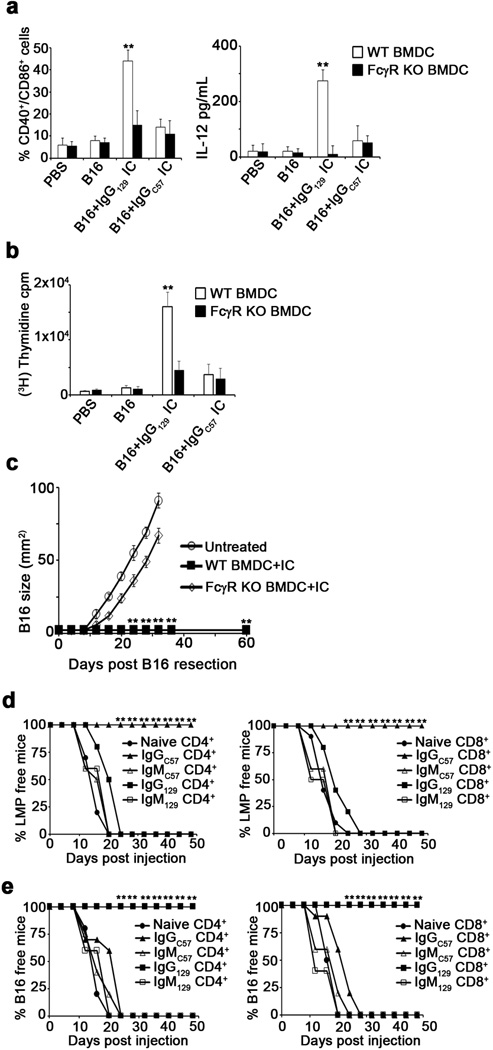
To investigate the effect of antibodies on tumor uptake by DC, we incubated tumor cells or lysates with syngeneic or allogeneic antibodies to form immune complexes (IC) and added these to bone marrow-derived (BM) DC (Fig. 2a). Only IC from allogeneic IgG (alloIgG-IC) or IgM (alloIgM-IC) induced BMDC activation and uptake of tumor-derived proteins (Fig. 2b–d), which were found in proximity to MHCII molecules (Fig. 2e). BMDC activated by alloIgG-IC induced significant T cell proliferation (Fig. 2f), demonstrating that tumor antigens were processed and presented.
Figure 2. AlloIgG-IC are internalized and presented by BMDC and drive protective immunity in vivo.

a. Experimental design: Tumor cells or lysates were incubated with syngeneic or allogeneic antibodies and then cultured with BMDC overnight. b. Expression of CD86/MHCII on BMDC cultured with antibody-coated tumor lysates or intact tumor cells (n=5). c. TNFα and IL-12 in supernatants of BMDC cultured overnight with Ig-IC formed with LMP lysate or intact LMP cells (n=5). d. Internalization of CFSE in BMDC incubated overnight with Ig-IC formed from CFSE-labeled tumor lysates or CFSE-labeled intact cells (n=4). e. Representative localization of MHCII and Ig-IC on BMDC cultured overnight with CFSE-labeled LMP cells coated with allogeneic antibodies (magnification: 400x). f. Proliferation of CD4+ T cells cultured with DC loaded with IC formed from LMP and B16 lysates or intact cells (n=5). g. Experimental design: Tumors were removed from mice, coated with antibodies, incubated for 24h with BMDC, and injected s.c. into corresponding tumor-resected mice. h. Tumor recurrence in mice treated with BMDC loaded with tumor lysate incubated with allogeneic or syngeneic antibodies (n=5). Experiments were independently repeated at least 3 times and analyzed by Mann–Whitney U test. Asterisk (*) denotes p<0.05 and two asterisks (**) denote p<0.01.
To determine whether IC-bound DC could elicit anti-tumor immune responses in syngeneic hosts, B16 or LMP cells were inoculated subcutaneously (s.c.), and tumors were removed upon reaching 25–55mm2, leaving tumor-free margins. IgG-IC or IgM-IC were prepared from excised tumors and incubated with syngeneic BMDC, which were injected into the corresponding tumor-resected mouse (Fig. 2g). While nearly all mice treated with syngeneic BMDC loaded with alloIgG-IC remained tumor-free for over a year, all other animals experienced rapid tumor relapse (Fig. 2h). This response was completely abrogated in DC lacking FcγR (Extended Data 3a–c). Furthermore, adoptive transfer of T cells from alloIgG-IC-treated animals protected naïve mice from tumor challenge (Extended Data 3d–e).
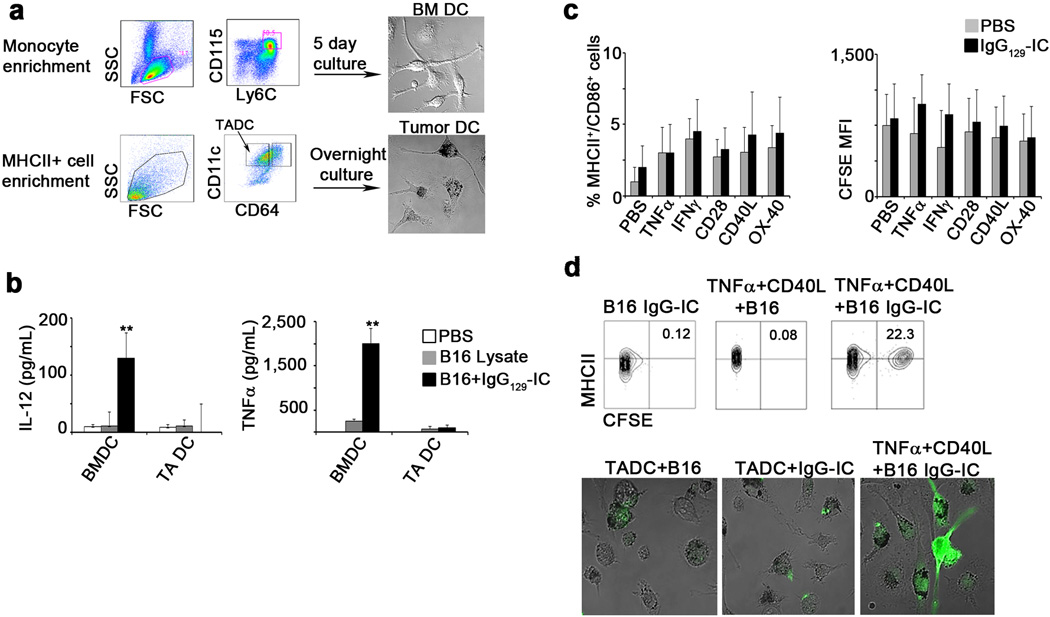
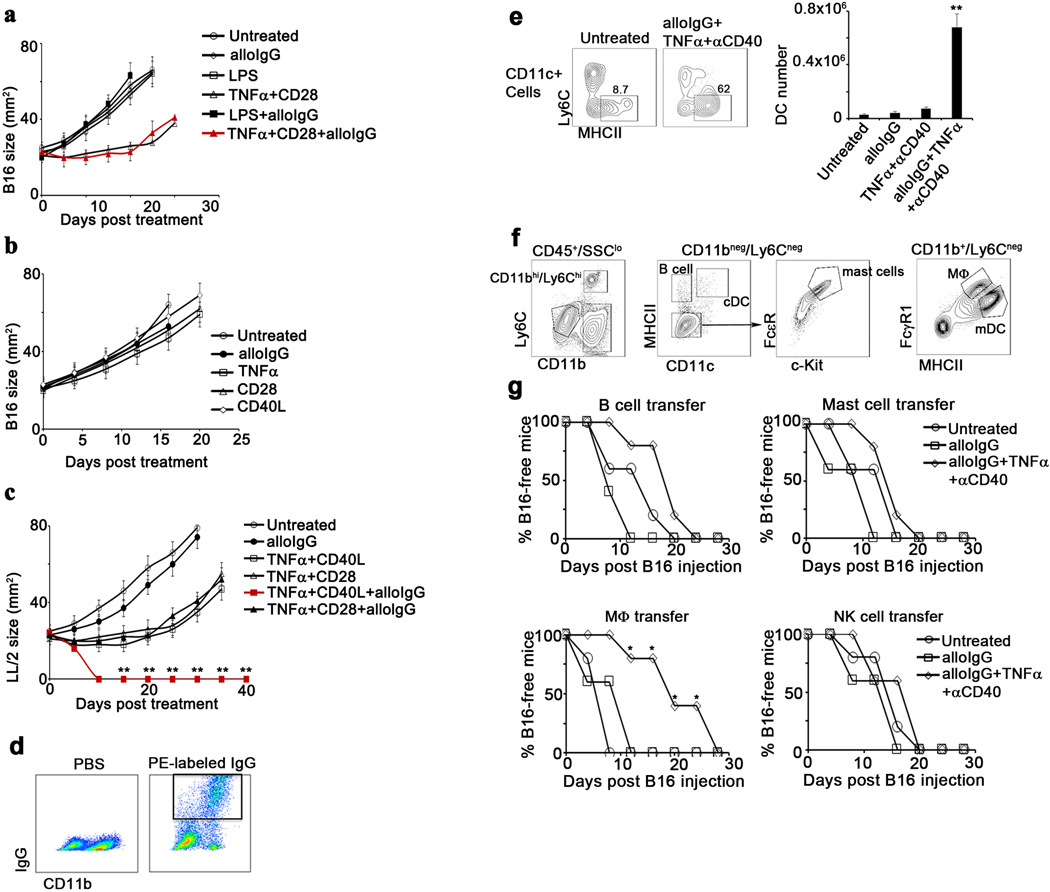
Despite these findings, only minor effects were observed when alloIgG was injected into tumors in autologous hosts (Fig. 3a). To address this discrepancy, we obtained tumor-associated DC (TADC) (Extended Data 4a) and cultured them with tumor lysates or alloIgG-IC. In contrast to BMDC, TADC displayed no activation (Fig. 3b–d, Extended Data 4b) and their transfer to tumor-resected mice had no effect on recurrence (Fig. 3e). Accordingly, p38, ERK1/2 and JNK were phosphorylated in BMDC but not TADC activated with alloIgG-IC (Fig. 3f). We then tested the effect of additional MAPK stimuli on the response of TADC to alloIgG-IC. PolyI:C, TNFα+CD40L or IFNγ+CD40L enabled activation of TADC and alloIgG-IC uptake (Fig. 3g, Extended Data 4c–d). We subsequently tested whether alloIgG in combination with one of these stimuli could induce immune responses to syngeneic tumors in situ. Intratumoral injection of alloIgG combined with TNFα+CD40L or polyI:C induced complete elimination of B16 and LL/2 tumors (Fig. 4a, Extended Data 5a–c).
Figure 3. TADC, but not BMDC, require stimulation to respond to alloIgG-IC.

a. Tumor growth following intratumoral injection of PBS, 129S1 IgG or C57Bl/6 IgG (n=6). b. CD86 and MHCII expression on DC incubated with PBS, tumor lysates or alloIgG-IC (n=5). c. TNFα and IL-12 in the supernatants of DC cultured with PBS control, LMP lysate or alloIgG-IC (n=5). d. Proliferation of CD4+ T cells cultured with DC treated with PBS, tumor lysate, or alloIgG-IC (n=5). e. Recurrence of resected LMP and B16 in untreated mice or mice treated with alloIgG-IC-activated BMDC or TADC (n=5). f. p-p38, pERK1/2 and pJNK levels in DC, untreated or incubated with alloIgG-IC. Graphs show arcsinh ratios of phospho-species in DC incubated for 5 min with LMP lysate or alloIgG-IC over baseline levels from unstimulated DC (n=5). g. MHCII and CD86 expression and CFSE internalization by TADC after overnight culture with CFSE-labeled alloIgG-IC (n=4). Experiments were independently repeated at least 3 times and analyzed by Mann–Whitney U test. Asterisk (*) denotes p<0.05 and two asterisks (**) denote p<0.01.
Figure 4. Injection of tumors in situ with alloantibodies in combination with CD40 agonists and TNFα induces systemic DC-mediated anti-tumor immunity.

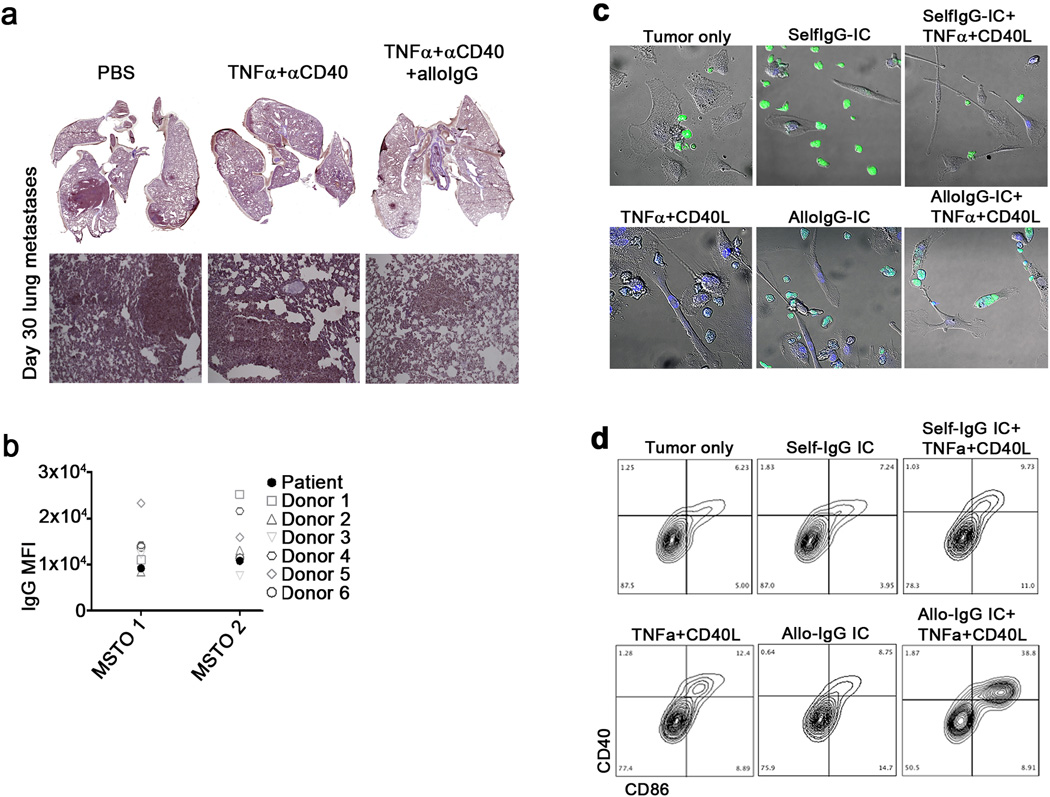
a. Growth of tumors injected with alloIgG, with or without immune stimuli (n=6). b. Mean fluorescence of PE in myeloid cells from B16-bearing mice 2h after treatment (n=4). c. CD86 and MHCII expression on DC from B16 tumors 5d following treatment (n=6). d. B16 growth in mice vaccinated with 2x10⁶ DC transferred from treated or untreated B16 tumors (n=6). e. Tumor number in Tyr:CreER;BrafV600E/Ptenlox/lox mice following treatment (n=4). Photographs show representative mice on the day of treatment and after day 24. f. 4T1 tumor size in mice following treatment (n=5). g. Mean counts of visible lung metastases, photographs and histology on day 30 (magnification: 10x, n=5). h. CFSE internalization and CD40/CD86 co-expression on TADC from lung cancer patients cultured overnight with CFSE-stained autologous tumor cells coated with selfIgG or alloIgG (n=2). i. HLA-DR upregulation by DC (left) and proliferative response of CD4+ T cells (right) from mesothelioma (MSTO) patients after culture of autologous BMDC with selfIgG- or alloIgG-coated autologous tumor cells (n=2). Mouse experiments were independently repeated at least 3 times and analyzed by Mann–Whitney U test. Asterisk (*) denotes p<0.05 and two asterisks (**) denote p<0.01.
Under these conditions, only mDC (CD11b+/Ly6C−/CD11c+/MHCII+/CD64dim) and cDC (CD11b−/CD11chi/MHCII+) markedly increased their IgG binding during an effective anti-tumor immune response (Fig. 4b, Extended Data 5d). Moreover, tumor-infiltrating DC exhibited significant activation (Fig. 4c) and accumulation in the draining lymph nodes (Extended Data 5e). Adoptive transfer of TADC from treated mice into naïve mice conferred complete protection against B16 (Fig. 4d). In contrast, transfer of macrophages had a modest protective effect, while B cells, NK cells and mast cells provided no benefit (Extended Data 5f–g).
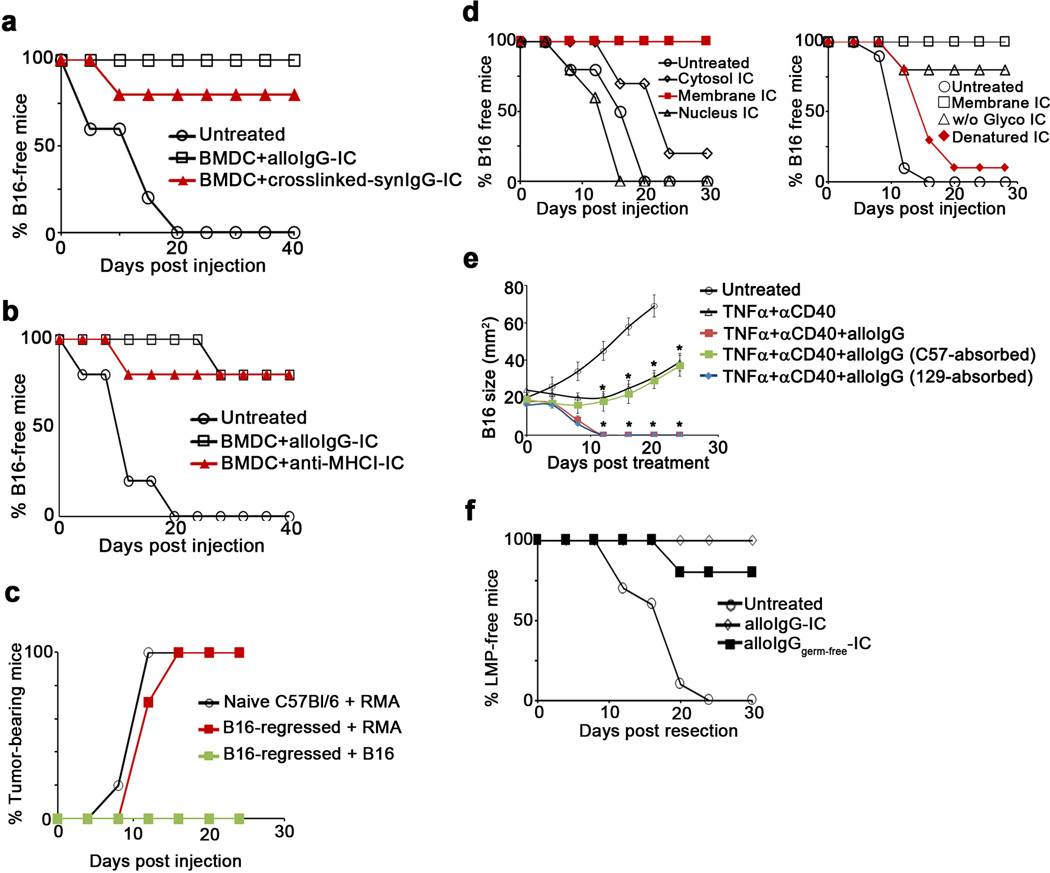
To test whether alloIgG bears unique modifications that mediate an immune response, we covalently crosslinked syngeneic IgG (synIgG) onto B16 membrane proteins. These IC still conferred a therapeutic benefit after incubation with BMDC (Extended Data 6a), demonstrating that binding of IgG to the tumor cell surface, rather than the origin of the IgG, was critical. To investigate whether the tumor-binding antibody targets are related to the anti-tumor T cell specificities, we resected B16 tumor cells and formed IC using an antibody against MHC-I, against which there could not be reactive T cells. DC loaded with these IC protected animals from B16 recurrence without inducing autoimmunity, suggesting that tumor-reactive T cell specificity is not determined by the antibody targets (Extended Data 6b). Furthermore, B16-bearing mice treated with alloIgG+αCD40+TNFα were protected from re-challenge with B16 melanoma, but not syngeneic RMA lymphoma, suggesting that the tumor-reactive T cells recognize tumor-associated antigens rather than widely expressed allo-antigens (Extended Data 6c).
Vaccination with BMDC loaded with IC containing B16 proteins derived from the cell membrane, but not other subcellular fractions, prevented tumor relapse, and B16 protein denaturation, but not deglycosylation, removed the therapeutic benefit (Extended Data 6d). Pre-absorbing alloIgG against normal cells syngeneic to the tumor also removed the therapeutic benefit (Extended Data 6e). AlloIgG from germ-free mice induced tumor immunity (Extended Data 6f), suggesting that IgG against microbiota were not required. Therefore, the protective effect of alloIgG is dependent upon antibody binding to membrane proteins expressed on normal cells.
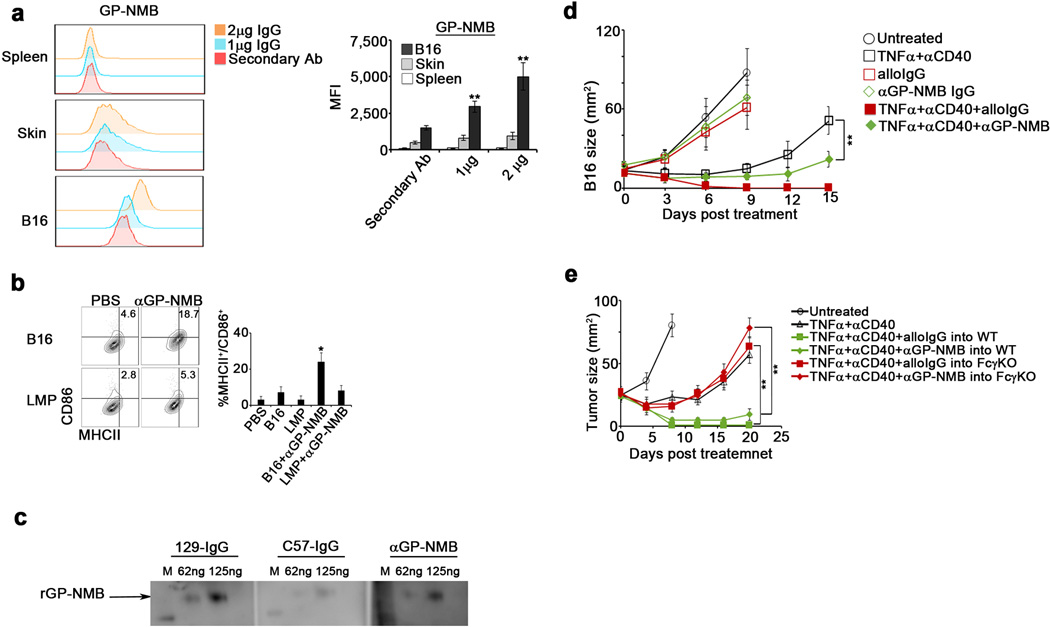
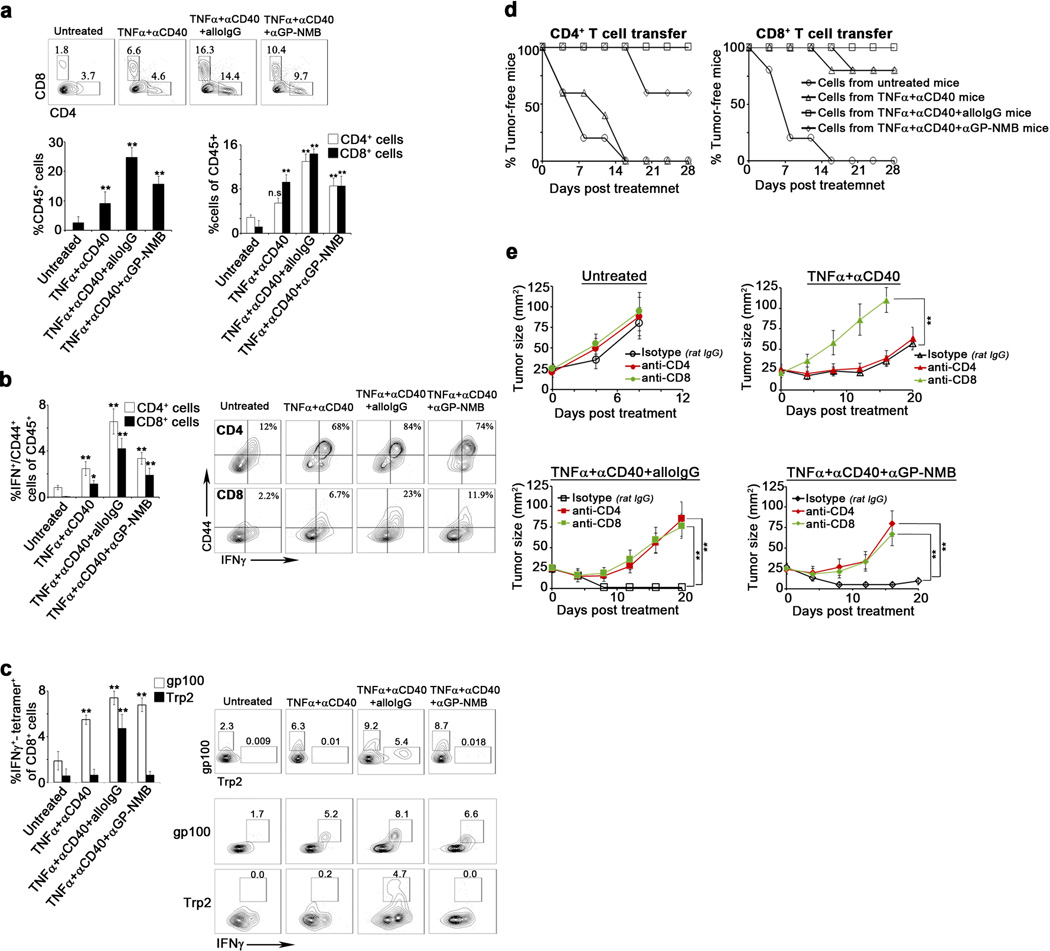
We therefore identified B16 membrane proteins specifically bound by alloIgG using mass spectrometry. While synIgG bound six cell membrane proteins, all at approximately equal or lower levels than alloIgG, alloIgG preferentially bound 16 cell membrane proteins, many containing strain-specific polymorphisms (Extended Data Table 1). To functionally validate these hits, we focused on Transmembrane-Glycoprotein NMB (GP-NMB). Antibodies against GP-NMB bound B16 cells at much higher levels than normal cells and enabled DC activation, and alloIgG bound GP-NMB at higher levels than synIgG (Extended Data 7a–c). Treatment using anti-GP-NMB+αCD40+TNFα induced significant FcγR-dependent tumor regression (Extended Data 7d–e). Treated tumors exhibited striking leukocyte infiltration, including activated effector/memory T cells, compared to untreated tumors (Extended Data 8a–b). Whereas all treatments elicited gp100-reactive CD8+ T cells, only alloIgG+αCD40+TNFα elicited Trp2-reactive CD8+ T cells (Extended Data 8c). Adoptive transfer of CD4 or CD8 T cells from these mice protected naïve mice from B16 challenge, and depletion of either CD4 or CD8 T cells prior to treatment prevented tumor regression (Extended Data 8d–e). These findings confirm that alloIgG induces T cell reactivity against tumor-associated antigens distinct from those bound by the antibodies.
We next treated a genetically-engineered melanoma model driven by BrafV600E and loss of Pten12 with alloIgG+αCD40+TNFα. Treated mice experienced complete responses lasting over 8 weeks in the injected tumors and distant sites (Fig. 4e). To assess the effect of this combination on metastases, orthotopic 4T1 breast tumors were treated after all mice had palpable tumor-draining lymph nodes, indicative of tumor spread. Only treatment with alloIgG+αCD40+TNFα led to almost complete resolution of metastases and primary tumors, and the few remaining micrometastases were heavily infiltrated with leukocytes (Fig. 4f–g, Extended Data 9a).
We next compared the capacity of IgG from cancer patients and healthy allogeneic donors to bind the patients’ tumors. Most but not all donors had antibodies with higher tumor-binding capacity (Extended Data 9b). We tested if alloIgG+CD40L+TNFα could induce tumor uptake and maturation of human TADC from two patients with lung carcinoma. Addition of CD40L+TNFα enabled these DC to internalize alloIgG-IC and induced DC activation (Fig. 4h,Extended Data 9c–d). Moreover, BMDC from 2 patients with malignant pleural mesothelioma incubated with alloIgG-IC, but not autologous IgG-IC, exhibited activation and drove autologous CD4+ T cell proliferation (Fig. 4i).
The effect of naturally arising tumor-reactive antibodies on tumor progression has been a source of controversy. Some studies suggest that such antibodies promote tumor progression13–19, while others report that they can stimulate anti-tumor immunity20–28. Like the antibodies that develop in cancer patients, commercial immunoglobulin preparations, which likely contain tumor-binding alloantibodies, have shown limited benefit when used to treat cancer29,30. Our data may provide a mechanistic explanation for these findings, as they show that while TADC are not naturally responsive to IgG-IC, addition of specific stimuli enables them to drive tumor-eradicating immunity. Hence, the role tumor-binding antibodies play in tumor immunity depends upon the environmental context and the cell types involved.
Here we demonstrate that tumor-antigen presentation following antibody-mediated uptake by DC is sufficient to initiate protective T cell-mediated immunity against tumors. Our work suggests that this fundamental mechanism of immunological recognition and targeting, which prevents tumor transmission even between MHC-matched individuals, can be exploited as a powerful therapeutic strategy for cancer.
Methods
Mice
129S1/SvlmJ mice, C57Bl/6 WT mice, Balb/c mice, and mice that develop inducible melanoma (B6.Cg-Braftm1Mmcm/Ptentm1HwuTg (Tyr-cre/ERT2)13Bos/BosJ) were purchased from the Jackson Laboratory (Bar Harbor, Maine) and bred on-site. CD-1 outbred mice and FcγR−/− (B6.129P2-Fcer1gtm1Rav) mice were purchased from Taconic (Germantown, NY). 12–16 week old mice were sorted randomly into groups before assigning treatment conditions. All mice were maintained in an American Association for the Accreditation of Laboratory Animal Care–accredited animal facility. All protocols were approved by the Stanford University Institutional Animal Care and Use Committee under protocol APLAC-17466.
Cell lines
The mouse lines B16F10 (melanoma), 4T-1.1 (breast cancer), LL/2 (Lewis lung carcinoma) and RMA (lymphoma) were all purchased from the ATCC. LMP pancreas tumor cells were isolated from KrasG12D/+; LSL-Trp53R172H/+; Pdx-1-Cre mice as described11. Cells were cultured in DMEM (Gibco, Carlsbad, CA) supplemented with 10% heat-inactivated FCS, 2 mM L-glutamine, 100 U/mL penicillin and 100 µg/mL streptomycin (Gibco) under standard conditions.
Preparation and in vitro studies of mouse DC subsets
BM mononuclear cells were negatively selected using a murine monocyte enrichment kit (Stem Cell Technologies, Vancouver Canada), and FSClo/SSClo/Ly6Chi/CD115hi/MHCIIneg cells were sorted with a FACS Aria II (BD Biosciences). Monocytes were cultured for 4–5 days in the presence of 50 ng/mL GM-CSF (PeproTech) to generate DC. For TADC, tumors were digested in Hank’s balanced salt solution (HBSS, Gibco) containing 4 mg/mL collagenase IV and 0.01 mg/mL DNase I (Sigma). Cells were applied on a Ficoll gradient and magnetically enriched using CD11b+ selection kits (StemCells) and Ly6C−/CD11c+/MHCII+ cells were sorted by FACS. In some experiments TADC were activated with 1µg/mL bacterial lipopolysaccharide (LPS), 1µg/mL high molecular weight polyinosinic-polycytidylic acid (polyI:C) (both from InvivoGen, San Diego, CA), or with 50 ng/mL TNFα or 50 ng/mL IFNγ (PeproTech) in combination with 500 ng/mL CD40L, OX-40 (PeproTech) or 500 ng/mL CD28 (R&D) recombinant mouse proteins. All in vitro activations of mouse DC were independently repeated at least 10 times in duplicate.
Preparation and in vitro studies of tumor cells, TADC, autologous T cells and IgG from patients with cancer
Tumor cells, TADC, peripheral blood T cells and IgG were obtained from 2 patients undergoing resection surgery for stage I lung carcinoma. Tumors were enzymatically digested with 0.1mg/mL of DNase I and 5mg/mL collagenase IV (Sigma) in HBSS for 30 min. Tumor cells were enriched by sorting CD45-negative cells, fixed in 2% paraformaldehyde for 20 min, washed extensively in PBS and coated for 30 min with autologous IgG or pooled allogeneic IgG obtained from healthy blood donors. To obtain TADC, FSClow/SSClow/CD11c+/MHCIIhi cells were sorted and maintained for 1h in 10% FCS IMDM at 37°C. For FACS and confocal studies, tumor DC were incubated overnight with autologous tumor cells coated with selfIgG or alloIgG alone, or in the presence of 5 ng/mL recombinant human TNFα and 500 ng/mL CD40L (PeproTech).
In separate experiments, 10 cm long rib bones and 10 mL blood were obtained from 2 patients undergoing resection surgery for malignant pleural mesothelioma. To generate BMDC, bones were flushed with PBS and mononuclear cells were separated on Ficoll gradients. CD34+ cells were then enriched using magnetic beads (Miltenyi) and cultured for 9–12 days in IMDM (Gibco) supplemented with 10% FCS, 50 ng/mL human GM-CSF and 20 ng/mL human IL-4 (PeproTech). To obtain autologous tumor cells, tumors were enzymatically digested with 0.1mg/mL of DNase I and 5mg/mL collagenase IV (Sigma) in HBSS for 30 min. Tumor cells were enriched by sorting CD45-negative cells, fixed in 2% paraformaldehyde for 20 min, washed extensively in PBS and coated for 30 min with autologous or pooled allogeneic IgG. Autologous CD4+ T cells were enriched from peripheral blood mononuclear cells on magnetic beads (Miltenyi) and IgG was isolated from each patient’s plasma using protein A columns (GE Healthcare). For T cell proliferation assays, 2×10⁴ DC were incubated overnight with antibody-coated tumor cells as above, washed and co-cultured with 2×10⁵ autologous CD4+-enriched T cells. After 6 days, cells were pulsed with 3H-thymidine (1 µCi/well) and cultured for an additional 18h before being harvested in a Harvester 400 (Tomtec). Radioactivity was measured by a 1450 MicroBeta counter (LKB Wallac). T cell proliferation was assayed in 6 technical replicates per sample. The human subjects protocols were approved by Stanford’s Institutional Review Board, and informed consent was obtained from all subjects.
Flow cytometry
For cell surface staining, monoclonal antibodies conjugated to FITC, PE, PE-Cy7, PE-Cy5.5, APC-Cy7, eFluor 650, or Pacific Blue and specific for the following antigens were used: CD11b (M1/70), F4/80 (BM8), B220 (RA3-6B2) from BioLegend (San Diego, CA) and CD115 (AFS98), CD80 (16-10A1), I-Ab (AF6–120.1), CD40 (1C10), Ly6C (HK1.4), CD86 (GL1) from eBioscience (San Diego, CA). All in vivo experiments to characterize tumor-infiltrating leukocytes were independently repeated at least 3 times with 3–5 mice per group. iTAg APC-labeled H-2Kb-Trp-2(SVYDFFVWL) and iTAg PE-labeled H-2Db-gp100(EGSRNQDWL) tetramers were purchased from MBL international (Woburn, MA) and were used according to manufacturer’s instructions. Tetramer-staining experiments were repeated twice with 5 mice in each group. For protein phosphorylation-specific flow cytometry, cells were activated for 5, 15 or 30 min with or without IC and fixed for 15 min with 1.8% paraformaldehyde. Cells were washed twice with PBS containing 2% FCS and incubated with 95% methanol at 4°C for 20 min. Conjugated antibodies against phospho-p38 (Thr180/Tyr182), and phospho-JNK (Thr183/Tyr185) were purchased from Cell Signaling and phospho-ERK1/2 (p44) (pT202/pY204) from BD Biosciences. DC protein phosphorylation experiments were repeated 5 times, each with biological duplicates. For tumor-binding IgM and IgG, PE-conjugated anti-mouse IgM (RMM-1), anti-mouse IgG (Poli4052) and anti-human IgG (HP6017) were purchased from BioLegend. Flow cytometry was performed on a LSRII (BD Biosciences) and datasets were analyzed using FlowJo software (Tree Star, Inc.). In vivo binding levels were tested in 4 independent experiments, 3–5 mice in each group.
Intracellular IFNγ staining
B16 tumors from treated mice were digested to obtain a single cell suspension. A total of 2×10⁶ cells per well were cultured for 4 hours in 10% FCS RPMI containing 1× Brefeldin A (eBioscience) in a 96 well plate containing 4×10⁴ BMDC loaded with 10 µg of B16 membrane proteins. Cells were washed and stained for extracellular T cell markers. Cells were then fixed and permeabilized using cytofix/cytoperm solutions (BD Bioscience) and stained with PE-Cy7 conjugated anti-IFNγ antibody (XMG1.2, BioLegend). Experiments were repeated twice independently with 5 mice per group.
Cytokine measurements
Cells were seeded at 1×10⁶ cells/mL and cultured for 12 h with or without tumor immune complexes, or LPS (Sigma). TNFα, IFNγ, and IL-12 (p40/p70) in the supernatants were measured by ELISA, according to manufacturer’s instructions (R&D Systems, Minneapolis, MN). Cytokine secretion was measured in biological triplicates in 4 independent experiments.
IgG and IgM purification and measurement
Mouse antibodies were obtained from pooled 5 mL 20–24-week-old mouse serum by liquid chromatography on AKTA Explorer/100Air (GE Healthcare). Total mouse IgG and IgM were purified using protein-G and 2-mercaptopyridine columns, respectively (GE Healthcare). The levels of purified IgG and IgM were measured with specific ELISA kits (Bethyl, Montgomery, TX) according to manufacturer’s instructions. The capacity of purified antibodies to bind tumor cells was tested by flow cytometry prior to their use in vivo. 1 µg IgG per 1×10⁵ allogeneic tumor cells bound at least 8 times higher compared to isotype control antibodies. Serum levels of antibodies were measured in biological triplicates in 4 independent experiments.
Necrotic and apoptotic tumor cell internalization experiments
For necrotic tumor cells, cultured LMP or B16 cell were trypsinized, washed and resuspended at a concentration of 5×10⁶ cells/mL in cold PBS (GIBCO). Cells were then subjected to three cycles of freeze-thaw between liquid nitrogen and a 37°C water bath and the level of necrotic cells was determined by Trypan blue under light microscopy. Apoptotic tumor cells were prepared by their pre-incubation with 25µg/mL of mitomycin C (Sigma) for 1 hour in antibiotic and serum-free DMEM. Fluorescein labeled E. coli BioParticles were purchased from Life Technologies and used according to the manufacturer’s instructions. DC activations with above cells were repeated 4 independent times in biological duplicates.
Preparation of antibody-tumor lysate immune complexes (Ig-IC) and antibody-bound tumor cells
When obtained from surgical resections, tumor cells were initially isolated after enzymatic digestion and sorted as FSChi/CD45neg cells prior to their fixation and staining. For tumor-antibody complexes, tumor cells were fixed in 2% paraformaldehyde, washed extensively and incubated with 1–3 µg syngeneic or allogeneic IgG or IgM per 1×10⁵ tumor cells, and were then washed to remove excess antibodies. To obtain tumor lysate Ig-IC, tumor cells were incubated for 30 min on ice with 1–3 µg syngeneic or allogeneic IgG or IgM per 1×10⁵ tumor cells, washed from excess antibodies and further disrupted with non-denaturing lysis buffer (Pierce) to obtain Ig-IC. DC activations with the above Ig-IC were repeated in at least 10 independent experiments in biological duplicates.
Absorption of alloIgG on normal cells
Skin and pancreas were removed from naïve C57Bl/6 or 129S1 mice and enzymatically digested with 0.1 mg/mL of DNase I (Sigma) and 4 mg/mL collagenase IV (Sigma) in PBS to obtain single cell suspensions. Splenocytes were isolated by mashing spleens through 70 µm cell strainers. Cells were then mixed at 1:1:1 ratio and extensively washed and incubated with 0.5 µg/1×106 cells FcγR block (BD) and 5% (W/V) BSA (Sigma) in PBS for 15 min on ice. Cells were then washed and incubated with alloIgG (2 µg per 1×10⁶ cells) for 30 min on ice. Cells were centrifuged at 5,000 RPM for 10 min, and the supernatants were concentrated by 50 kDa centrifugal filters (Amicon) before being incubated with 1×10⁵ tumor cells.
Membrane protein extraction
For native membrane protein extraction, B16F10 cells were scraped in cold PBS and pelleted at 400×g for 5 min at 4°C. The cell pellet was washed twice in cold PBS, resuspended in 10 mM HEPES pH 7.4 and incubated on ice for 10 min. Cells were pelleted and the buffer was removed. The cell pellet was resuspended in 10 mL of SEAT buffer (10 mM triethanolamine/acetic acid, 1 mM EDTA pH 8.0, 250 mM sucrose, protease inhibitor cocktail) and homogenized with twenty strokes of a dounce homogenizer. The sample was spun at 900×g for 6 min to collect the post-nuclear supernatant (PNS). The PNS was spun at 100,000×g for 60 min at 4°C to harvest a membrane pellet, which was then resuspended in 4 mL membrane extraction buffer (MEB) containing 50 mM Tris-HCl pH-8.0, 150 mM NaCl, 1% NP-40, 1 mM DTT, 10% glycerol, 1 mM NaF, and protease inhibitor cocktail. After incubation for 2 h at 4°C, the membrane extract was clarified by centrifugation at 100,000×g for 30 min at 4°C. For denatured membrane protein extraction, the membrane pellet was resuspended in 500 µl Radio-Immuno-Precipitation Assay buffer (RIPA, Sigma) and lysed with a 25G needle syringe. Lysates were incubated at 4°C for 1h and spun at 100,000×g, 30min, 4°C. Supernatant containing detergent solubilized membrane proteins was collected and boiled for 5min at 95°C. Deglycosylation of membrane proteins was performed using a commercial kit (New England Biolabs, Ipswich, MA) according to the manufacturer’s instructions. Isolation of cell-membrane proteins was repeated 3 independent times and the running pattern of precipitated proteins was compared on SDS-PAGE.
Immunoprecipitation and mass spectrometry
Immunoprecipitation was set up with 20 mg membrane extract and 50 µg of syngeneic or allogeneic IgG coupled to protein G magnetic beads and incubated for 16 hr at 4°C. Beads were washed thrice with MEB and bound protein complexes were eluted with 2X Laemmli buffer. The eluted sample was subjected to SDS-PAGE on a 4–12% Bis-Tris gel followed by GelCode Blue staining (Thermo Scientific) to visualize protein bands. Protein bands were excised, digested with trypsin and analyzed (MS Bioworks) using a nano LC/MS/MS with a NanoAcquity HPLC system (Waters) interfaced to a Q Exactive (Thermo Fisher). The mass spectrometer was operated in data-dependent mode, with MS and MS/MS performed in the Orbitrap at 70,000 FWHM and 17,500 FWHM resolution, respectively. The fifteen most abundant ions were selected for MS/MS. The data were processed with the Mascot Server (Matrix Science). Mascot DAT files were parsed into the Scaffold software for validation, filtering and to create a non-redundant list per sample. Data were filtered at 1% protein and peptide FDR, requiring at least two unique peptides per protein. Mass spectrometry analysis of precipitated proteins was performed once.
Native gel and tumor cell GP-NMB staining
Recombinant mouse GP-NMB (R&D) was mixed with native loading buffer (16% Glycerol, 1% Trypan blue and 50 mM pH 7.0 Tris-HCl) and 62.5 and 125 ng/well was run for 2 hours in Novex® NativePAGE™ Bis-Tris gel system (Life Technologies) on ice. Bands were transferred to a nitrocellulose membrane and incubated overnight with 10µg/mL mouse IgG, or with 1µg/mL rabbit polyclonal IgG anti-mouse GP-NMB (cat. no. S-24 sc-133634, Santa Cruz). The membranes were washed, incubated for 45min with goat anti-mouse IgG light chain-specific antibodies conjugated to HRP (Pierce), developed with SuperSignal West Femto Substrate (Pierce), and exposed together for imaging.
For FACS staining of GP-NMB on tumor cells, 1x10⁵ B16 or LMP cells were incubated with 2µg rabbit polyclonal anti-mouse GP-NMB (Santa Cruz) for 30 min, washed twice and incubated for 20 min with PE-conjugated donkey anti-rabbit or goat anti-mouse antibodies, respectively (both from eBioscience). FACS measurements were repeated 3 independent times in biological duplicates.
In vivo tumor models
For tumor challenge studies, 2x10⁵ and 5×10⁴ LMP or B16 tumor cells, respectively, were injected subcutaneously (s.c.) above the right flank, and tumor development was measured twice a week with calipers. In some experiments, 1–2×10⁶ tumor cells were labeled with 25 µM CFSE according to manufacturer’s instructions (Invitrogen). Tumor challenge experiments were repeated independently at least 8 times with 4 mice per group. For prophylactic immunization, mice were injected twice s.c., 7 days apart, with 2x10⁶ DC or monocytes that were loaded with tumor lysates or IC. This was independently repeated 3 times with 4 mice per group. For tumor recurrence studies, 2x10⁵ tumor cells were injected s.c. above the right flank, and the size of growing tumors was measured using calipers. When tumors reached 45–55 mm2 for LMP and 12–16 mm2 for B16, mice were anesthetized and visible macroscopic tumor was surgically removed. Resected tumors were enzymatically digested with 0.1mg/mL of DNase I (Sigma) and 5mg/mL collagenase IV (Sigma) in HBSS. Cells were then fixed in 2% paraformaldehyde for 20 min, washed extensively in PBS and coated for 30 min with syngeneic or allogeneic antibodies. In some experiments, tumor cells were coated with mouse anti-mouse anti-H2-Kb (2µg/1x105 cells) or its isotype control (C1.18.4, both from BioXcell). Antibody-coated tumor cells were then washed and added to DC cultures. After overnight incubation, DC were washed and 2.5x10⁶ were injected s.c. to tumor-resected mice one day after the tumors were removed, adjacent to the site of tumor resection. This experiment was repeated independently at least 3 times with 4 mice per group. For in vivo tumor treatments, a combination of 2 µg TNFα (Peprotech) and 100 µg agonistic αCD40 (FGK4.5, BioXcell), 5 µg recombinant CD40L (PeproTech), 5 µg CD28 (R&D Systems, Minneapolis, MN), 5 µg LPS or 200 µg polyI:C (Invivogen), and 400 µg mouse allogeneic or syngeneic IgG or anti-GP-NMB (Santa Cruz), was injected twice (2 days apart) directly into tumors. Experiments were repeated independently at least 5 times with 4–5 mice per group. For treatment of the BrafV600E melanoma model, mice were injected twice (2 days apart) in 2 cycles, one week apart, with 1mg IgG derived from CD-1 mice along with TNFα and αCD40 once the largest tumor nodule reached 16mm2. For metastasis experiments, 1x10⁵ 4T-1 cells were injected into the mammary fat pad of syngeneic Balb/c mice. After 14–16 days, once tumors metastasized into the draining lymph node, the primary tumor nodules were injected twice (2 days apart) in 2 cycles, one week apart, with 1mg IgG derived from CD-1 mice along with TNFα and αCD40. Experiments were repeated independently at least 3 times with 3–5 mice per group.
In vivo binding of PE-labeled alloIgG
Allogeneic antibodies were fluorescently labeled with PE using Lightning-Link® kits according to the manufacturer’s instructions (Innova Biosciences Ltd., Cambridge, UK). Subsequently, 5 µg of labeled alloIgG was injected intratumorally alone or with TNFα and αCD40. After 2 h, tumors were enzymatically digested to obtain a single cell suspension and the PE levels were analyzed by flow cytometry along with lineage markers.
Covalent binding of syngeneic antibodies to tumor cells
Syngeneic IgG was cross-linked to primary amines of B16 cell surface proteins using sulfo-LC-SPDP (sulfosuccinimidyl 6-(3’-[2-pyridyldithio]-propionamido) hexanoate, Pierce) according to the manufacturer’s instructions. Briefly, both the antibodies and cells were initially treated with sulfo-LC-SPDP to label primary amines. Next, disulfide bonds in syngeneic IgG were reduced by treatment with DTT. Finally, the reduced syngeneic IgG was incubated with SPDP-labeled B16 cells and the level of binding was later assessed by flow cytometry. Experiments were repeated independently 3 times with 4 mice per group.
In vivo cell depletion
Depletion of CD4+ and CD8+ T cells was achieved by intraperitoneal (i.p.) injection of 500 µg/mouse GK1.5 (anti-CD4) and YST-169.4 (anti-CD8) monoclonal antibodies (both from BioXcell, West Lebanon, NH), respectively, 3 days before tumor inoculation and every 3 days thereafter. T cell depletion experiments were repeated independently 3 times for each depletion antibody with 3–4 mice per group. In some experiments, B16-bearing mice were injected with 500 µg/mouse anti-CD8 or anti-CD4 2 days prior to their treatment with antibodies+TNFα+αCD40 and once a week thereafter. These T cell depletion experiments were repeated independently 2 times for each depletion antibody with 5 mice per group. For B cell depletion, 300 µg/mouse anti-CD19 (1D3) and 300 µg/mouse anti-B220 (RA3.3A1/6.1) (both from BioXcell) were injected i.p. three weeks before tumor inoculation and every 5 days thereafter. B cell depletion experiments were repeated independently 3 times with 3–5 mice per group. For NK cell depletion, mice were injected i.p. with 50 µl anti-asialo (GM1) polyclonal antibody (Wako Chemicals, Richmond, VA), or with 200 µg anti-NK1.1 (PK136) (BioXCell) on days −2, 0, 4, and 8 relative to tumor challenge. Individual mice were bled on days 0, 7, 14 and 21 and the levels of NK1.1+/CD3ɛneg cells were determined by flow cytometry to confirm depletion. NK cell depletion experiments were repeated independently 3 times with anti-asialo depletion antibody with 3–5 mice per group.
Adoptive transfer
Mice were injected i.v. with 1 mg/mouse of syngeneic or allogeneic IgG or IgM one day prior to tumor challenge and once again with tumor injection. For T cell transfer, splenic CD4+ and CD8+ T cells were negatively selected using a murine enrichment kit (Stem Cell Technologies) and at least 5x10⁶ cells were injected i.v. to recipient mice one day before tumor challenge. T cell adoptive transfer experiments were repeated independently 3 times for each T cell subset with 3–5 mice per group. Prior to their transfer, tumor-associated cell subsets were enriched as follows: TADC were isolated by enrichment of MHCII+ cells on magnetic beads (Miltenyi) and subsequent sorting of Ly6Cneg/CD11c+/CD64dim by FACS. Tumor macrophages were enriched with CD11b+ magnetic beads (Miltenyi) followed by sorting of Ly6Cneg/CD64hi cells. B cells were enriched with CD19+ magnetic beads (Miltenyi). NK cells were enriched with NK1.1+ magnetic beads (Miltenyi), and mast cells were enriched with c-kit+ magnetic beads (Miltenyi). For each cell subset, 2x10⁶ cells were injected s.c. into naïve mice 3 days before being challenged with 5x10⁴ B16 tumor cells. Transfer experiments for each cell type were repeated 3 times independently with 3–5 mice per group.
T cell proliferation
3x10⁴ DC were co-cultured with 3x10⁵ MACS-enriched CD4+ T cells (Miltenyi, Germany) from spleens of LMP- or B16-immunized mice. After 6 days, cells were pulsed with 3H-thymidine (1 µCi/well) and cultured for an additional 18h before being harvested in a Harvester 400 (Tomtec). Radioactivity was measured by a 1450 MicroBeta counter (LKB Wallac). T cell proliferation was repeated 5 times with 3 biological replicates and 6 technical replicates for each.
In vivo BrdU incorporation
Tumor-challenged mice were injected i.p. every day with 1mg of 5-bromo-2-deoxyuridine (BrdU) in 200 µL PBS. At several time points, mice were sacrificed and single cell suspensions were prepared from BM, lymph nodes and tumor tissues. Cells were then stained for lineage markers followed by intracellular staining with FITC-conjugated anti-BrdU antibody according to manufacturer’s instructions (BD Pharmingen) and analyzed by flow cytometry. Experiments were repeated independently 3 times with 3–5 mice per group.
Immunofluorescence
DC or monocytes were incubated on glass-bottom culture plates (In Vitro Scientific) with CFSE-labeled tumor cells with or without antibodies overnight. Cells were gently washed with PBS (Gibco), fixed for 20 min with 2% paraformaldehyde and permeabilized with 0.5% saponin (Sigma). Samples were blocked with 10% non-immune goat serum and stained with Alexa-conjugated anti-mouse IgG and IgM (Invitrogen 1:100) and anti-mouse I-Ab (BD Biosciences, 1:100). DC immunostainings were independently repeated at least 3 times in biological duplicates and 3 fields were documented in each slide.
Immunohistochemistry
Specimens were fixed in 4% paraformaldehyde, equilibrated in a 20% sucrose solution and embedded in frozen tissue matrix (Tissue-Tek OCT, Torrance, CA). Slides were cut to 5 µm, blocked with 10% non-immune goat serum and stained with goat anti-mouse IgG (Invitrogen 1:100) and anti-mouse IgM (II/41 eBioscience, 1:100). Sections were examined under a Zeiss Laser Scanning Confocal Microscope. Images were collected using a Zeiss 700 confocal laser scanning microscope, and analyzed using ZEN software (Carl Zeiss Microscopy). Tumor immunostainings were repeated independently at least 3 times in biological duplicates and 3 fields were captured for each slide.
Statistics
Sample size was chosen such that statistical significance could be achieved using appropriate statistical tests (e.g. ANOVA) with errors approximated from previously reported studies. A non-parametric Mann–Whitney U test was performed in Prism (GraphPad Software, Inc.) to analyze experimental data, unless otherwise stated. Phospho-specific flow cytometry data were transformed by taking the inverse hyperbolic sine (arcsinh), and ratios were taken over the corresponding baseline (unstimulated) value as previously described (Irish et al., PNAS, 2010). No blinded experiments were performed. No samples were excluded from analyses. P values indicate significance of the difference between experimental and control (CT) values. * denotes p<0.05; ** denotes p<0.01. Error bars represent +/− SEM.
Extended Data
Extended Data 1.
a. LMP (left) and B16 (right) growth in 129S1 ( ) C57Bl/6 (
 ), or allogeneic hosts pretreated with anti-asialo-GM1 (
 ) or anti-NK1.1 antibodies (
 ) (n=6). Shown are representative plots of NK cells in the blood prior to tumor challenge. b. BrdU incorporation by CD4+ T cells (top graphs) and CD8+ T cells (bottom graphs) in lymphoid organs of 129S1 () and C57Bl/6 () LMP-bearing mice (n=8). c. Representative flow cytometric analysis of CD11bhi/Ly6Chi myeloid cells and mature DC (mDC) on day 10 after C57Bl/6 mice were inoculated with B16 tumor cells. d. Flow cytometric analysis of Ly6Cneg/CD11c+/MHCII+ cells from LMP-bearing mice (left panel) and B16-bearing mice (right panel). Histograms show representative expression levels of co-stimulatory molecules on DC from C57Bl/6 (
 ) and 129S1 mice (
 ) (n=8). e. IL-12 (right) and TNFα (left) in the supernatants of syngeneic BMDC (), syngeneic blood monocyte-derived (Mo)-DC (
 ), allogeneic BMDC (
 ) or Mo-DC (
 ) incubated with live, frozen-thawed (necrotic), or mitomycin C-treated (apoptotic) LMP cells or E. coli BioParticles overnight (n=8). Shown are the mean values ±SEM from two independent experiments. Asterisk (*) denotes p<0.05 and two asterisks (**) denote p<0.01.
Extended Data 2.
a. Flow cytometric analysis of the binding of various concentrations of IgG from 129S1 (), IgM from 129S1 (), IgG from C57Bl/6 () and IgM from C57Bl/6 mice ( ) to LMP and B16 cells. The lower panel shows a representative histogram of IgG (left) or IgM (right) binding after incubation of 1µg of C57Bl/6 () or 129S1 (
 ) antibodies with 1x10⁵ LMP (upper) or B16 (lower) cells (n=8). b. The left panel shows a representative histogram of the MFI of IgG after incubation of 2µg of either control antibody () or IgG from the serum of naïve C57Bl/6 mice (
 ), B16-bearing C57Bl/6 mice on day 7 (), B16-bearing C57Bl/6 mice on day 14 (
 ) or naïve 129S1 mice () with 1x10⁵ B16 cells (n=6). Right graph shows MFI of the binding of 2µg of each IgG to 1x10⁵ B16 cells. c. Serum levels of IgG (left) and IgM (right) in C57Bl/6 () and 129S1 mice (
 ) following i.p injection with anti-B220 and anti-CD19 antibodies (n=8). d. LMP tumor size in naïve 129S1 mice injected with allogeneic IgG (), allogeneic IgM (), syngeneic IgG () or syngeneic IgM () on days −1 and 0 relative to tumor injection (n=6). Shown are the mean values ±SEM from two independent experiments. Asterisk (*) denotes p<0.05 and two asterisks (**) denote p<0.01.
Extended Data 3.
a. Mean levels of CD40 and CD86 expression (left) and IL-12 secretion (right) in BMDC from C57Bl/6 () and FcγR KO mice () activated with IgG-IC overnight (n=6). b. Proliferation of CD4+ T cells cultured with BMDC from C57Bl/6 () and FcγR KO mice () loaded with IgG-IC (n=4). c. Tumor recurrence in untreated mice (), mice treated with WT BMDC loaded with IgG-IC (), or mice treated with FcγR KO BMDC loaded with IgG-IC ( ) (n=8). d. and e. Percentages of tumor-free mice following adoptive transfer of 5x10⁶ splenic CD4+ T cells (left graph) or CD8+ T cells (right graph) from naïve mice (), or from LMP (d)- or B16 (e)-resected mice treated with DC+IgGC57 IC (), DC+IgMC57 IC (
 ), DC+IgG129 IC (), or DC+IgM129 IC (), and subsequently challenged with LMP (d) or B16 (e) (n=6). Shown are the mean values ±SEM from two independent experiments. Asterisks (**) denote p<0.01.
Extended Data 4.
a. Sorting and culture schema of DC from BM and tumor. b. Mean levels of IL-12 (left graph) and TNFα (right graph) in the supernatants of DC cultured overnight in medium alone (open bars), with B16 lysates ( ), or with alloIgG-IC () (n=6). c. Percentage of MHCII+/CD86+ cells (left panel) or CFSE levels (right panel) in tumor-associated DC following overnight activation with PBS () or CFSE-labeled alloIgG-IC () with or without stimulatory molecules (n=12). d. Representative flow cytometric analysis and confocal images from one out of three independent experiments of B16-derived DC cultured overnight with CFSE-labeled fixed B16 cells (n=8). Shown are the mean values ±SEM from three independent experiments Asterisk (*) denotes p<0.05 and two asterisks (**) denote p<0.01.
Extended Data 5.
a. B16 tumor size in C57Bl/6 mice left untreated () or injected intratumorally with 129S1 alloIgG (), LPS (), TNFα+CD28 (), LPS+alloIgG () or TNFα+CD28+alloIgG ( ) (n=15). b. B16 tumor size in C57Bl/6 mice left untreated () or injected intratumorally with 129S1 alloIgG (), TNFα (), CD28 (), or CD40L () (n=12). c. LL/2 tumor size in C57Bl/6 mice left untreated (), or injected intratumorally with 129S1 alloIgG (), TNFα+CD40L (), TNFα+CD28 (), TNFα+CD40L+129S1 alloIgG (
 ) or TNFα+CD28+129S1 IgG () (n=8). d. Representative flow cytometric analysis from one out of three independent experiments of IgG binding total myeloid cells in B16 tumor-bearing mice 3 hours after intratumoral injection of PBS or 5µg PE-labeled alloIgG. e. Total numbers of CD11c+ cells in the draining lymph nodes of B16 tumor-bearing mice 4 days after treatment (n=6). f. Gating and sorting strategy of immune cell populations infiltrating B16 tumors. g. B16 growth in mice vaccinated with 2x10⁶ B cells, mast cells, macrophages or NK cells from B16 tumors untreated (), or injected with alloIgG () or alloIgG+TNFα+αCD40 () (n=6). Shown are the mean values ±SEM from two independent experiments. Asterisk (*) denotes p<0.05 and two asterisks (**) denote p<0.01.
Extended Data 6.
a. B16 frequency in mice untreated (), or treated with BMDC loaded with intact B16 cells coated with alloIgG (), or with intact B16 cells cross-linked to syngeneic IgG () (n=8). b. B16 tumor frequency in mice untreated () or treated with BMDC loaded with intact B16 cells coated with alloIgG () or with intact B16 coated with monoclonal IgG against MHC-I () (n=8). c. RMA tumor growth following inoculation with 2.5x10⁵ tumor cells in naïve C57Bl/6 mice (), or in C57Bl/6 mice in which B16 tumors had completely regressed following treatment with alloIgG+TNFα+αCD40 (). Also shown is the lack of B16 tumor growth in C57Bl/6 mice that were re-challenged with 2x10⁵ B16 tumor cells following the regression of this tumor after treatment with alloIgG+TNFα+αCD40 () (n=8). d. Left: Tumor frequency in mice untreated () or treated with DC loaded with IC formed with alloIgG and cytosolic tumor proteins (), nuclear tumor proteins () or membrane tumor proteins (). Right: Tumor frequency in mice untreated (), treated with DC loaded with IC formed from alloIgG and membrane proteins (), membrane proteins without O- and N-glycans (), or heat-denatured membrane proteins ( ) (n=5). e. B16 tumor growth in C57Bl/6 mice untreated (), or injected with TNFα+αCD40 (), TNFα+αCD40+alloIgG (), or TNFα+αCD40 and alloIgG absorbed on normal cells of the IgG-donor background (
 ) or on normal cells of the tumor background () (n=6). f. Tumor recurrence rates following resection in mice left untreated (), treated with 2x10⁶ DC loaded with IgG-IC from conventionally-raised C57Bl/6 (), or with 2x10⁶ DC loaded with IgG-IC from gnotobiotic C57Bl/6 mice () (n=6). Shown are the mean values ±SEM from two independent experiments. Asterisk (*) denotes p<0.05 and two asterisks (**) denote p<0.01.
Extended Data 7.
a. Representative flow cytometric analysis and quantitation of binding of anti-IgG secondary antibody alone (), 1 µg anti-GP-NMB () or 2 µg GP-NMB () per 1x10⁵ B16 cells, normal skin cells, or normal spleen cells (n=6). b. Percentage of MHCII+/CD86+ BMDC following overnight activation with untreated LMP or B16 tumor cells, or with tumor cells coated with anti-GP-NMB (2µg/1x105 tumor cells) (n=8). c. Western blot of recombinant GP-NMB (62.5 ng and 125 ng) performed with 10µg/mL of IgG from naïve 129S1 mice, naïve C57Bl/6 mice, or 1µg/mL αGP-NMB. d. B16 tumor size in mice untreated () or treated with TNFα+αCD40 (), alloIgG ( ), anti-GP-NMB IgG (
 ), TNFα+αCD40+alloIgG (), or with TNFα+αCD40+αGP-NMB (
 ) (n=8). e. B16 tumor size in C57Bl/6 WT mice untreated () or treated with TNFα+αCD40 (), TNFα+αCD40+alloIgG (), or with TNFα+αCD40+anti-GP-NMB (), or in FcγR KO mice treated with TNFα+αCD40+alloIgG (), or with TNFα+αCD40+anti-GP-NMB () (n=8). Shown are the mean values ±SEM from two independent experiments. Asterisk (*) denotes p<0.05 and two asterisks (**) denote p<0.01.
Extended Data 8.
a. Representative flow cytometry plots of CD4+ and CD8+ cells in B16 tumors 6 days following treatment. Left graph: Percentage of CD45+ cells infiltrating B16 tumors 15–17 days after s.c. inoculation or six days after treatment. Right graph: Percentage of CD4+ () and CD8+ cells () among tumor-infiltrating CD45+ cells (n=10). b. Percentages of CD44 and IFNγ co-expressing CD4+ () and CD8+ cells () among tumor-infiltrating CD45+ cells 6 days following treatment or 15 days following s.c. inoculation (n=10) c. Frequency of IFNγ-expressing T cells that recognize gp100 () and Trp2 () among day 6 post-treatment tumor-infiltrating CD8+ cells. Gate shown: CD8+ T cells (n=10). d. Percentage of tumor-free mice following adoptive transfer of T cells from day 6 post-treatment B16 tumor-bearing mice untreated (), treated with TNFα+αCD40 (), with TNFα+αCD40+alloIgG (), or with TNFα+αCD40+αGP-NMB (). (n=9). e. Upper left: B16 tumor growth in untreated C57Bl/6 mice injected with rat IgG (), with rat anti-CD4 ( ), or with rat-CD8 (
 ). Upper right: B16 tumor growth in C57Bl/6 mice treated with TNFα+αCD40 and injected with rat IgG (), with rat anti-CD4 (
 ), or with rat-CD8 (
 ). Lower left: B16 growth in C57Bl/6 mice treated with TNFα+αCD40+alloIgG and injected with rat IgG (), with rat anti-CD4 (), or with rat-CD8 (). Lower right: B16 growth in C57Bl/6 mice treated with TNFα+αCD40+αGP-NMB and injected with rat IgG (), with rat anti-CD4 (), or with rat-CD8 () (n=9). Shown are the mean values ±SEM from three independent experiments. Asterisk (*) denotes p<0.05 and two asterisks (**) denote p<0.01.
Extended Data 9.
a. Representative H&E sections of lung metastases on day 30 from one out of three independent experiments performed (magnification: 10x). b. MFI of tumor cells from MSTO-resected patients coated with autologous IgG or IgG from healthy donors (n=6). c and d. Widefield microscopy (c) and flow cytometry plots (d) of TADC from a lung carcinoma patient incubated overnight with autologous CFSE-labeled tumor cells (green) coated with selfIgG or alloIgG derived from a pool of 10 donors (1µg/2x105 cells) and in the presence of 50 ng/mL TNFα and 1 µg/mL CD40L. Shown are the mean values ±SEM from two independent experiments. Asterisk (*) denotes p<0.05 and two asterisks (**) denote p<0.01.
Extended Data Table 1.
a.–c. 20 µg of native cell membrane proteins were incubated with 50 µg of syngeneic (C57Bl/6) or allogeneic (129S1) IgG coupled to protein G magnetic beads and precipitated proteins were analyzed by mass-spectrometry. Tables show the conversion to Spectral Abundance Factor (SAF) and subsequent Normalized Spectral Abundance Factor (NSAF). This was based on the equation: NSAF = (SpC/MW)/Σ(SpC/MW)N. Where SpC = Spectral Counts, MW = Protein MW in kDa and N = Total Number of Proteins.
| a. Proteins enriched by alloIgG | |||||||||
|---|---|---|---|---|---|---|---|---|---|
| Identified Proteins | Accession Number | C57 SpC | 129 SpC | C57 SAF | 129 SAF | C57 NSAF | 129 NSAF | C57/129 ratio |
|
| Endoplasmic reticulum membrane | |||||||||
| 1 | Transmembrane protein 93 | sp|Q9CQW0|TMM93_MOUSE | 0 | 2 | 0 | 0.166667 | 0 | 0.0007367 | 2 |
| 2 | Endoplasmic reticulum-Golgi intermediate compartment protein 3 | sp|Q9CQE7|ERGI3_MOUSE | 0 | 2 | 0 | 0.046512 | 0 | 0.00020559 | 2 |
| 3 | Reticulon-4 | sp|Q99P72|RTN4_MOUSE | 0 | 2 | 0 | 0.015748 | 0 | 6.9609E-05 | 2 |
| 4 | Uncharacterized protein C12orf41 homolog | sp|Q8BQR4|CL041_MOUSE | 0 | 2 | 0 | 0.037037 | 0 | 0.00016371 | 2 |
| 5 | Erlin-2 | sp|Q8BFZ9|ERLN2_MOUSE | 0 | 2 | 0 | 0.052632 | 0 | 0.00023264 | 2 |
| 6 | Transitional endoplasmic reticulum ATPase | sp|Q01853|TERA_MOUSE | 0 | 2 | 0 | 0.022472 | 0 | 9.933E-05 | 2 |
| 7 | Dolichyl-diphosphooligosaccharide--protein glycosyltransferase subunit DAD1 | sp|P61804|DAD1_MOUSE | 0 | 2 | 0 | 0.166667 | 0 | 0.0007367 | 2 |
| 8 | Calnexin | sp|P35564|CALX_MOUSE | 0 | 2 | 0 | 0.029851 | 0 | 0.00013195 | 2 |
| 9 | Calumenin | sp|O35887|CALU_MOUSE | 0 | 2 | 0 | 0.054054 | 0 | 0.00023893 | 2 |
| 10 | Vesicle-associated membrane protein-associated protein A | sp|Q9WV55|VAPA_MOUSE | 0 | 3 | 0 | 0.107143 | 0 | 0.00047359 | 3 |
| 11 | Mannosyi-oligosaccharide glucosidase | sp|Q80UM7|MOGS_MOUSE | 0 | 3 | 0 | 0.032609 | 0 | 0.00014414 | 3 |
| 12 | Neutral alpha-glucosidase | sp|Q8BHN3|GANAB_MOUSE | 0 | 3 | 0 | 0.028037 | 0 | 0.00012393 | 3 |
| 13 | ERO1-like protein alpha | sp|Q8R180|ERO1A_MOUSE | 0 | 5 | 0 | 0.092593 | 0 | 0.00040928 | 5 |
| 14 | UDP-glucose:glycoprotein glucosyltransferase 1 | sp|Q6P5E4|UGGG1_MOUSE | 0 | 5 | 0 | 0.028409 | 0 | 0.00012557 | 5 |
| 15 | Prolyl 4-hydroxylase subunit alpha-1 | sp|Q60715|P4HA1_MOUSE | 0 | 5 | 0 | 0.081967 | 0 | 0.00036231 | 5 |
| 16 | Epoxide hydrolase 1 | sp|Q9D379|HYEP_MOUSE | 0 | 9 | 0 | 0.169811 | 0 | 0.0007506 | 9 |
| 17 | Calreticulin | sp|P14211|CALR_MOUSE | 0 | 14 | 0 | 0.291667 | 0 | 0.00128922 | 14 |
| 18 | Sarcoplasmic/endoplasmic reticulum calcium ATPase | sp|O55143|AT2A2_MOUSE | 8 | 18 | 0.06956522 | 0.156522 | 0.0003684 | 0.00069185 | 1.8782025 |
| 19 | Protein disulfide-isomerase A4 | sp|P08003|PDIA4_MOUSE | 0 | 12 | 0 | 0.166667 | 0 | 0.0007367 | 12 |
| 20 | Protein disulfide-isomerase | sp|P09103|PDIA1_MOUSE | 0 | 12 | 0 | 0.210526 | 0 | 0.00093056 | 12 |
| 21 | Protein disulfide-isomerase A3 | sp|P27773|PDIA3_MOUSE | 0 | 9 | 0 | 0.157895 | 0 | 0.00069792 | 9 |
| 22 | Protein disulfide-isomerase A6 | sp|Q922R8|PDIA6_MOUSE | 0 | 11 | 0 | 0.229167 | 0 | 0.00101296 | 11 |
| Melanosomes and vesicles membranes | |||||||||
| 1 | Peptidyl-prolyl cis-trans isomerase B | sp|P24369|PPIB_MOUSE | 0 | 7 | 0 | 0.291667 | 0 | 0.00128922 | 7 |
| Cell membrane | |||||||||
| 1 | T-complex protein 1 subunit gamma | sp|P80318|TCPG_MOUSE | 0 | 2 | 0 | 0.032787 | 0 | 0.00014492 | 2 |
| 2 | Monocarboxylate transporter 4 | sp|P57787|MOT4_MOUSE | 0 | 2 | 0 | 0.04 | 0 | 0.00017681 | 2 |
| 3 | Nicastrin | sp|P57716|NICA_MOUSE | 0 | 2 | 0 | 0.025641 | 0 | 0.00011334 | 2 |
| 4 | Basigin | sp|P18572|BASI_MOUSE | 0 | 2 | 0 | 0.047619 | 0 | 0.00021048 | 2 |
| 5 | Vesicle-associated membrane protein-associated protein A | sp|Q9WV55|VAPA_MOUSE | 0 | 3 | 0 | 0.107143 | 0 | 0.00047359 | 3 |
| 6 | Retrovirus-related Env polyprotein from Fv-4 | sp|P11370|ENV2_MOUSE | 0 | 3 | 0 | 0.040541 | 0 | 0.0001792 | 3 |
| 7 | Synaptic vesicle membrane protein | sp|Q62465|VAT1_MOUSE | 0 | 4 | 0 | 0.093023 | 0 | 0.00041118 | 4 |
| 8 | 4F2 cell-surface antigen heavy chain | sp|P10852|4F2_MOUSE | 0 | 4 | 0 | 0.068966 | 0 | 0.00030484 | 4 |
| 9 | Alpha-enolase | sp|P17182|ENOA_MOUSE | 0 | 5 | 0 | 0.106383 | 0 | 0.00047023 | 5 |
| 10 | Integrin-linked protein kinase | sp|O55222|ILK_MOUSE | 0 | 4 | 0 | 0.078431 | 0 | 0.00034668 | 4 |
| 11 | Transmembrane glycoprotein NMB | sp|Q99P91|GPNMB_MOUSE | 2 | 15 | 0.03125 | 0.234375 | 0.0001655 | 0.00103598 | 6.2606749 |
| 12 | MLV-related proviral Env polyprotein | sp|P10404|ENV1_MOUSE | 0 | 13 | 0 | 0.185714 | 0 | 0.00082089 | 13 |
| 13 | ERO1-like protein alpha | sp|Q8R180|ERO1A_MOUSE | 0 | 5 | 0 | 0.092593 | 0 | 0.00040928 | 5 |
| 14 | Clathrin heavy chain 1 | sp|Q68FD5|CLH_MOUSE | 0 | 5 | 0 | 0.026042 | 0 | 0.00011511 | 5 |
| 15 | Desmoglein-1-alpha | sp|Q61495|DSG1A_MOUSE | 2 | 5 | 0.0173913 | 0.043478 | 9.209E-05 | 0.00019218 | 2.0868916 |
| 16 | Sodium/potassium-transporting ATPase subunit alpha-1 | sp|Q8VDN2|AT1A1_MOUSE | 4 | 12 | 0.03539823 | 0.106195 | 0.0001874 | 0.0004694 | 2.50427 |
| b. Proteins equally enriched by synIgG and alloIgG | |||||||||
|---|---|---|---|---|---|---|---|---|---|
| Identified Proteins | Accession Number | C57 SpC | 129 SpC | C57 SAF | 129 SAF | C57 NSAF | 129 NSAF | C57/129 ratio |
|
| Endoplasmic reticulum membrane | |||||||||
| 1 | DnaJ homolog subfamily B member 11 | sp|Q99KV1|DJB11_MOUSE | 8 | 6 | 0.19512195 | 0.146341 | 0.0010332 | 0.00064686 | 0.6260675 |
| 2 | 78 kDa glucose-regulated protein | sp|P20029|GRP78_MOUSE | 73 | 71 | 1.01388889 | 0.986111 | 0.0053687 | 0.00435879 | 0.8118866 |
| 3 | Serpin H1 | sp|P19324|SERPH_MOUSE | 11 | 17 | 0.23404255 | 0.361702 | 0.0012393 | 0.00159879 | 1 2900785 |
| 4 | Protein transport protein Sec61 subunit beta | sp|Q9CQS8|SC61B_MOUSE | 2 | 3 | 0.2 | 0.3 | 0.001059 | 0.00132605 | 1.252135 |
| 5 | Leucine-rich repeat-containing protein 59 | sp|Q922Q8|LRC59_MOUSE | 3 | 2 | 0.08571429 | 0.057143 | 0.0004539 | 0.00025258 | 0.5565044 |
| 6 | Protein transport protein Sec61 subunit alpha isoform 1 | sp|P61620|S61A1_MOUSE | 9 | 10 | 0.17307692 | 0.192308 | 0.0009165 | 0.00085003 | 0.9275074 |
| 7 | Dolichyl-diphosphooligosaccharide--protein glycosyltransferase 48 kDa subunit | sp|O54734|OST48_MOUSE | 3 | 5 | 0.06122449 | 0.102041 | 0.0003242 | 0.00045104 | 1.3912611 |
| 8 | Estradiol 17-beta-dehydrogenase 12 | sp|O70503|DHB12_MOUSE | 7 | 6 | 0.2 | 0.171429 | 0.001059 | 0.00075774 | 0.7155057 |
| Melanosomes and vesicles membranes | |||||||||
| 1 | Flotillin-2 | sp|Q60634|FLOT2_MOUSE | 3 | 2 | 0.06382979 | 0.042553 | 0.000338 | 0.00018809 | 0.5565044 |
| 2 | Cathepsin D | sp|P18242|CATD_MOUSE | 3 | 5 | 0.06666667 | 0.111111 | 0.000353 | 0.00049113 | 1.3912611 |
| 3 | AP-2 complex subunit beta | sp|Q9DBG3|AP2B1_MOUSE | 8 | 5 | 0.07619048 | 0.047619 | 0.0004034 | 0.00021048 | 0.5217229 |
| 4 | AP-2 complex subunit mu | sp|P84091|AP2M1_MOUSE | 4 | 5 | 0.08 | 0.1 | 0.0004236 | 0.00044202 | 1.0434458 |
| 5 | Annexin A2 | sp|P07356|ANXA2_MOUSE | 4 | 6 | 0.1025641 | 0.153846 | 0.0005431 | 0.00068003 | 1.252135 |
| 6 | Melanocyte protein PMEL | sp|Q60696|PMEL_MOUSE | 5 | 4 | 0.07575758 | 0.060606 | 0.0004011 | 0.00026789 | 0.6678053 |
| Cell membrane | |||||||||
| 1 | Desmoplakin | sp|E9Q557|DESP_MOUSE | 63 | 60 | 0.18918919 | 0.18018 | 0.0010018 | 0.00079643 | 0.7950063 |
| 2 | PDZ domain | sp|Q9Z0G0|GIPC1_MOUSE | 13 | 9 | 0.36111111 | 0.25 | 0.0019121 | 0.00110504 | 0.5779085 |
| 3 | Junction plakoglobin | sp|Q02257|PLAK_MOUSE | 37 | 49 | 0.45121951 | 0.597561 | 0.0023893 | 0.00264133 | 1.1054885 |
| c. Proteins enriched by synIgG | |||||||||
|---|---|---|---|---|---|---|---|---|---|
| Identified Proteins | Accession Number | C57 SpC | 129 SpC | C57 SAF | 129 SAF | C57 NSAF | 129 NSAF | C57/129 ratio |
|
| Endoplasmic reticulum membrane | |||||||||
| 1 | Stromal cell-derived factor 2-like protein 1 | sp|Q9ESP1|SDF2L_MOUSE | 3 | 0 | 0.125 | 0 | 0.0006619 | 0 | 3 |
| 2 | Nicalin | sp|Q8VCM8|NCLN_MOUSE | 2 | 0 | 0.03174603 | 0 | 0.0001681 | 0 | 2 |
| 3 | Translocation protein SEC62 | sp|Q8BU14|SEC62_MOUSE | 4 | 0 | 0.08695652 | 0 | 0.0004604 | 0 | 4 |
| 4 | Disco-interacting protein 2 homolog B | sp|Q3UH60|DIP2B_MOUSE | 4 | 0 | 0.02339181 | 0 | 0.0001239 | 0 | 4 |
| melanosomes and Vesicles membranes | |||||||||
| 1 | Vacuolar protein sorting-associated protein 35 | sp|Q9EQH3|VPS35_MOUSE | 2 | 0 | 0.02173913 | 0 | 0.0001151 | 0 | 2 |
| 2 | Angiomotin-like protein 2 | sp|Q8K371|AMOL2_MOUSE | 6 | 0 | 0.07058824 | 0 | 0.0003738 | 0 | 6 |
| 3 | Fibrous sheath-interacting protein 2 | sp|A2ARZ3|FSIP2_MOUSE | 9 | 0 | 0.01146497 | 0 | 6.071E-05 | 0 | 9 |
| Cell membrane | |||||||||
Supplementary Material
Acknowledgments
The authors thank Dr. F. Carl Grumet and Dr. Nathan E. Reticker-Flynn for helpful discussion. We also thank Dr. Justin Sonnenburg for providing gnotobiotic mice. This work was supported by NIH grants U01 CA141468 and 5T32AI007290-27. M.H.S. is supported by NIH NRSA F31CA189331. I.L.L. is supported by a Smith Stanford Graduate Fellowship.
Footnotes
Author Contributions
Y.C. conceived the study, performed experiments and wrote the manuscript. M.H.S., I.L.L., T.R.P. and N.B. performed experiments, helped with experimental design and contributed to manuscript preparation. B.M.B. helped with experimental design, human tissue acquisition and manuscript preparation. N.P., M.G.D., J.A.K., E.S., and G.V.P. performed experiments. E.G.E. supervised the project, analyzed data, and wrote the manuscript.
Competing Financial Interests
The authors declare no competing financial interests.
References
- 1.Coussens LM, Zitvogel L, Palucka AK. Neutralizing tumor-promoting chronic inflammation: a magic bullet? Science. 2013;339:286–291. doi: 10.1126/science.1232227. [DOI] [PMC free article] [PubMed] [Google Scholar]
- 2.Grivennikov SI, Greten FR, Karin M. Immunity, inflammation, and cancer. Cell. 2010;140:883–899. doi: 10.1016/j.cell.2010.01.025. [DOI] [PMC free article] [PubMed] [Google Scholar]
- 3.Hanahan D, Coussens LM. Accessories to the crime: functions of cells recruited to the tumor microenvironment. Cancer cell. 2012;21:309–322. doi: 10.1016/j.ccr.2012.02.022. [DOI] [PubMed] [Google Scholar]
- 4.Schreiber RD, Old LJ, Smyth MJ. Cancer immunoediting: integrating immunity’s roles in cancer suppression and promotion. Science. 2011;331:1565–1570. doi: 10.1126/science.1203486. [DOI] [PubMed] [Google Scholar]
- 5.Vesely MD, Kershaw MH, Schreiber RD, Smyth MJ. Natural innate and adaptive immunity to cancer. Annual review of immunology. 2011;29:235–271. doi: 10.1146/annurev-immunol-031210-101324. [DOI] [PubMed] [Google Scholar]
- 6.Manning TC, et al. Antigen recognition and allogeneic tumor rejection in CD8+ TCR transgenic/RAG(−/−) mice. Journal of immunology. 1997;159:4665–4675. [PubMed] [Google Scholar]
- 7.Ferrara J, Guillen FJ, Sleckman B, Burakoff SJ, Murphy GF. Cutaneous acute graft-versus-host disease to minor histocompatibility antigens in a murine model: histologic analysis and correlation to clinical disease. J Invest Dermatol. 1986;86:371–375. doi: 10.1111/1523-1747.ep12285612. [DOI] [PubMed] [Google Scholar]
- 8.Appelbaum FR. Haematopoietic cell transplantation as immunotherapy. Nature. 2001;411:385–389. doi: 10.1038/35077251. [DOI] [PubMed] [Google Scholar]
- 9.Bishop MR, et al. Allogeneic lymphocytes induce tumor regression of advanced metastatic breast cancer. J Clin Oncol. 2004;22:3886–3892. doi: 10.1200/JCO.2004.01.127. [DOI] [PubMed] [Google Scholar]
- 10.Goulmy E. Minor histocompatibility antigens: allo target molecules for tumor-specific immunotherapy. Cancer J. 2004;10:1–7. doi: 10.1097/00130404-200401000-00001. [DOI] [PubMed] [Google Scholar]
- 11.Tseng WW, et al. Development of an orthotopic model of invasive pancreatic cancer in an immunocompetent murine host. Clinical cancer research : an official journal of the American Association for Cancer Research. 2010;16:3684–3695. doi: 10.1158/1078-0432.CCR-09-2384. [DOI] [PMC free article] [PubMed] [Google Scholar]
- 12.Dankort D, et al. Braf(V600E) cooperates with Pten loss to induce metastatic melanoma. Nat Genet. 2009;41:544–552. doi: 10.1038/ng.356. [DOI] [PMC free article] [PubMed] [Google Scholar]
- 13.Qin Z, et al. B cells inhibit induction of T cell-dependent tumor immunity. Nature medicine. 1998;4:627–630. doi: 10.1038/nm0598-627. [DOI] [PubMed] [Google Scholar]
- 14.de Visser KE, Korets LV, Coussens LM. De novo carcinogenesis promoted by chronic inflammation is B lymphocyte dependent. Cancer cell. 2005;7:411–423. doi: 10.1016/j.ccr.2005.04.014. [DOI] [PubMed] [Google Scholar]
- 15.Andreu P, et al. FcRgamma activation regulates inflammation-associated squamous carcinogenesis. Cancer cell. 2010;17:121–134. doi: 10.1016/j.ccr.2009.12.019. [DOI] [PMC free article] [PubMed] [Google Scholar]
- 16.Gerber JS, Mosser DM. Reversing lipopolysaccharide toxicity by ligating the macrophage Fc gamma receptors. Journal of immunology. 2001;166:6861–6868. doi: 10.4049/jimmunol.166.11.6861. [DOI] [PubMed] [Google Scholar]
- 17.Willimsky G, et al. Immunogenicity of premalignant lesions is the primary cause of general cytotoxic T lymphocyte unresponsiveness. The Journal of experimental medicine. 2008;205:1687–1700. doi: 10.1084/jem.20072016. [DOI] [PMC free article] [PubMed] [Google Scholar]
- 18.Soussi T. p53 Antibodies in the sera of patients with various types of cancer: a review. Cancer research. 2000;60:1777–1788. [PubMed] [Google Scholar]
- 19.Gumus E, et al. Association of positive serum anti-p53 antibodies with poor prognosis in bladder cancer patients. International journal of urology : official journal of the Japanese Urological Association. 2004;11:1070–1077. doi: 10.1111/j.1442-2042.2004.00948.x. [DOI] [PubMed] [Google Scholar]
- 20.Li Q, et al. Adoptive transfer of tumor reactive B cells confers host T-cell immunity and tumor regression. Clinical cancer research : an official journal of the American Association for Cancer Research. 2011;17:4987–4995. doi: 10.1158/1078-0432.CCR-11-0207. [DOI] [PMC free article] [PubMed] [Google Scholar]
- 21.DiLillo DJ, Yanaba K, Tedder TF. B cells are required for optimal CD4+ and CD8+ T cell tumor immunity: therapeutic B cell depletion enhances B16 melanoma growth in mice. Journal of immunology. 2010;184:4006–4016. doi: 10.4049/jimmunol.0903009. [DOI] [PMC free article] [PubMed] [Google Scholar]
- 22.Clynes R, Takechi Y, Moroi Y, Houghton A, Ravetch JV. Fc receptors are required in passive and active immunity to melanoma. Proceedings of the National Academy of Sciences of the United States of America. 1998;95:652–656. doi: 10.1073/pnas.95.2.652. [DOI] [PMC free article] [PubMed] [Google Scholar]
- 23.Nimmerjahn F, Ravetch JV. Divergent immunoglobulin g subclass activity through selective Fc receptor binding. Science. 2005;310:1510–1512. doi: 10.1126/science.1118948. [DOI] [PubMed] [Google Scholar]
- 24.Hamanaka Y, et al. Circulating anti-MUC1 IgG antibodies as a favorable prognostic factor for pancreatic cancer. International journal of cancer. Journal international du cancer. 2003;103:97–100. doi: 10.1002/ijc.10801. [DOI] [PubMed] [Google Scholar]
- 25.Kurtenkov O, et al. Humoral immune response to MUC1 and to the Thomsen-Friedenreich (TF) glycotope in patients with gastric cancer: relation to survival. Acta Oncol. 2007;46:316–323. doi: 10.1080/02841860601055441. [DOI] [PubMed] [Google Scholar]
- 26.Schuurhuis DH, et al. Immune complex-loaded dendritic cells are superior to soluble immune complexes as antitumor vaccine. Journal of immunology. 2006;176:4573–4580. doi: 10.4049/jimmunol.176.8.4573. [DOI] [PubMed] [Google Scholar]
- 27.Regnault A, et al. Fcgamma receptor-mediated induction of dendritic cell maturation and major histocompatibility complex class I-restricted antigen presentation after immune complex internalization. The Journal of experimental medicine. 1999;189:371–380. doi: 10.1084/jem.189.2.371. [DOI] [PMC free article] [PubMed] [Google Scholar]
- 28.Rafiq K, Bergtold A, Clynes R. Immune complex-mediated antigen presentation induces tumor immunity. The Journal of clinical investigation. 2002;110:71–79. doi: 10.1172/JCI15640. [DOI] [PMC free article] [PubMed] [Google Scholar]
- 29.Schachter J, et al. Efficacy and safety of intravenous immunoglobulin in patients with metastatic melanoma. Ann N Y Acad Sci. 2007;1110:305–314. doi: 10.1196/annals.1423.032. [DOI] [PubMed] [Google Scholar]
- 30.Fishman P, Bar-Yehuda S, Shoenfeld Y. IVIg to prevent tumor metastases (Review) Int J Oncol. 2002;21:875–880. [PubMed] [Google Scholar]
Associated Data
This section collects any data citations, data availability statements, or supplementary materials included in this article.