

Abstract
Signaling by the hedgehog (Hh) family of secreted growth factors is essential for development of embryonic blood vessels. Embryos lacking Hh function have abundant endothelial cells but fail to assemble vascular cords or lumenized endothelial tubes. However, the role of Hh signaling during later aspects of vascular patterning and morphogenesis is largely unexplored. We have used small molecule inhibitors and agonists to alter activity of the Hh signaling pathway in the chick embryo. When cyclopamine is added after cord formation, aortal cells form tubes, but these are small and disorganized and the density of the adjacent vascular plexus is reduced. Activation of the Hh pathway with SAG leads to formation of enlarged aortae and increased density of the plexus. The number of endothelial cell filopodia is found to correlate with Hh signaling levels. These studies show that Hh signaling levels must be tightly regulated for normal vascular patterning to be achieved.
Keywords: Hedgehog, SAG, purmorphamine, cyclopamine, jervine, SANT1, endothelial development, filopodia
INTRODUCTION
The major events underlying formation of embryonic blood vessels are conserved between all vertebrates (reviewed in Cleaver and Krieg, 2010). Endothelial precursor cells, called angioblasts, arise within the mesodermal germ layer. The angioblasts undergo proliferation and migration and assemble into loosely organized structures called vascular cords (Coffin and Poole, 1988, 1991). The location of cords within the embryo closely resembles the pattern of the initial network of blood vessels. Angioblasts within the cords make cell contacts and tubulogenesis occurs to generate patent blood vessels. The formation of tubes proceeds in an anterior to posterior wave through the embryo, with fully formed tubes present in the head at the same time that angioblasts are still forming into cords in the tail regions (Coffin and Poole, 1988, 1991). After formation of the initial endothelial network, primitive blood vessels undergo extensive remodeling to form the mature vascular pattern.
Signaling through the hedgehog (Hh) pathway is essential for early vascular development. Knockout of the Indian hedgehog gene, Ihh, in the mouse results in defects in yolk sac vascular development and approximately half of embryos die at mid-gestation (Byrd et al., 2002). Most of the other Ihh mutant animals die around birth and these also exhibit vascular defects (Colnot et al., 2005). Similarly, Sonic hedgehog, Shh, mutant mice also exhibit defects in vascular development, although these are relatively minor and are restricted mostly to the lung and neural tissues (Pepicelli et al., 1998; Nagase et al., 2005). The rather minor defects in vascular development appear to be due to functional redundancy between Ihh and Shh, because animals lacking function of both Ihh and Shh exhibit severe vascular defects resulting in early embryonic lethality (Zhang et al., 2001). This result is confirmed by studies in which function of the nonredundant Hh receptor protein, Smoothened (Smo), was ablated. Mouse Smo mutants showed the presence of a normal number of angioblasts, but formation of endothelial cords and tubes was severely disrupted (Vokes et al., 2004). In contrast, when the Patched protein, which normally functions to limit Hh signaling, was ablated in mouse, embryos showed the presence of enlarged blood vessels and severe disruption of vascular patterning (Ellis et al., 2003; Coultas et al, 2010). The majority of evidence suggests that Hh ligands do not interact directly with endothelial cells, but rather produce their effects indirectly by means of intermediary regulatory factors. For example, it is well established that Hh can regulate vascular endothelial growth factor (VEGF) and Notch signaling in certain developmental contexts (Pola et al., 2001; Lawson et al., 2002).
Here, we report that inhibition or activation of hedgehog signaling at later developmental stages, after assembly of endothelial cords, alters normal vascular development. When Hh signaling is inhibited, the vascular plexus occupies less area and the dorsal aortae are misshapen and generally smaller in size. However, all vascular structures undergo tubulogenesis when hedgehog signaling is inhibited, including isolated groups of endothelial cells, which forms hollow cysts. Activation of Hh signaling results in a denser vascular plexus and the dorsal aortae are larger. Examination of cell behavior shows that Hh signaling plays a major role in regulating the number of filopodia extending from endothelial cells. These filopodia are likely to be important for assembly of the initial vascular network and for establishing the density of the plexus. We conclude from these studies that hedgehog signaling is required for correct regulation of the size of the dorsal aortae and for regulation of the density of the vascular plexus. Preliminary studies suggest that VEGF expression levels, but not those of Notch1, are responsive to alterations in Hh signaling.
RESULTS
Modulation of Hedgehog Signaling Using Cyclopamine and SAG
Although the Hh pathway inhibitor, cyclopamine, has previously been used in chick embryo studies, the concentration varied widely depending on the stage of development and the culture method (Incardona et al., 1998; Kim and Melton, 1998; Britto et al., 2002; Scherz et al., 2007; Franz-Odendaal, 2008; Hutson et al., 2009; Kolpak et al., 2009). On the other hand, use of the Hh agonist, SAG, has not previously been reported for chick. Using the New culture protocol, we carried out dose studies to determine the amounts of cyclopamine and SAG sufficient to influence Hh signaling levels but not cause nonspecific embryonic defects. Transcription of the Hh co-receptor, Patched1 (Ptch1), is a direct target of Hh regulation and so we have carried out in situ hybridization analysis to determine the location and relative levels of Hh signaling in response to cyclopamine and SAG (Fig. 1). Treatment of chick embryos for 8 hr with a range of cyclopamine concentrations from 25 to 200 μM, resulted in dose-dependent reduction in Ptch1 expression levels. Even at the lowest dose of cyclopamine (25 μM), expression in the somites was noticeably reduced compared with controls (compare Figs. 1A and Fig. 1B), but a concentration of 100 μM was required to produce a major reduction in Ptch1 transcript levels in the notochord and ventral neural tube (Fig. 1D). At 200 μM cyclopamine, a low frequency of embryonic death was observed, although overall development of surviving embryos appeared normal. For agonist studies, treatment of chick embryos with SAG at concentrations from 1 to 20 μM, resulted in a dose-dependent increase in levels of Ptch1 signal detected by in situ hybridization (Fig. 1F–J), although the increase appeared to plateau at approximately 10 μM (compare Fig. 1I and 1J). No reduction in embryonic viability was observed, even at the highest doses of SAG. Agonist treatment not only increased Ptch1 expression in the normal domains, such as the somites and neural tube, but also activated ectopic expression in the endoderm, lateral to the somites (arrowheads in Fig. 1H–J). Expression also increased in the dorsal region of somites (compare Fig. 1K and 1M). Each of these domains is adjacent to the forming dorsal aortae (DA; Fig. 1K–M). Several additional small molecular weight modulators of Hh signaling have been described, including the agonist purmorphamine (Wu et al., 2004) and the antagonists jervine (Cooper et al., 1998) and SANT1 (Chen et al., 2002). We carried out a dose–response analysis with each of these compounds, using both Ptch1 expression in chick embryos to assay for levels of Hh signaling activity, and QH1 staining of quail embryos to examine vascular patterning. However, none of these compounds resulted in detectable changes in Hh signaling or vascular patterning under the conditions used, up to doses that resulted in embryonic death (Supp. Fig. S1, Supp. Table S1, which are available online). Based on these results we carried out all subsequent experiments using cyclopamine at 100 μM for inhibitor studies and SAG at 20 μM for agonist studies. To quantitate the alterations in Ptch1 transcript levels in response to cyclopamine and SAG treatment, we carried out quantitative polymerase chain reaction (qPCR) analysis (Fig. 1N). In this experiment, Ptch1 transcript levels were altered to approximately 60% and 180% of wild-type levels in response to treatment with 100 μM cyclopamine and 20 μM SAG, respectively. This experiment determines an average, and it is likely that some individuals showed greater reduction in Hh signaling levels.
Fig. 1.

Characterization of cyclopamine inhibition and SAG activation of hedgehog (Hh) signaling in the chick embryo. In situ hybridization analysis for expression of the hedgehog receptor, Ptch1, as a readout for Hh signaling. A–E: Embryos were treated with increasing doses of cyclopamine (0–200 μM), commencing at the 7-somite stage, until the 10-somite stage (approximately 8 hr). Ptch1 expression was reduced as the concentration of cyclopamine increased. Expression was initially lost from the somites and lateral mesoderm and then more gradually from the notochord and the ventral neural tube. F–J: Embryos treated with increasing concentrations of SAG (0–20 μM), commencing at the 7-somite stage, until the 10-somite stage. Ptch1 expression increased in a concentration-dependent manner. Regions of higher expression in the lateral plate mesoderm are indicated by arrowheads. K–M: Cross-sections through embryos treated as indicated and assayed for Ptch1 by in situ hybridization. K: Control embryo shows wild-type expression pattern of Ptch1 in the notochord, ventral neural tube, ventral somites, and more weakly in the lateral plate mesoderm. These last two expression domains are directly adjacent to the forming dorsal aortae (DA). L: Embryo treated with 100 μM cyclopamine. Expression of Ptch1 was almost completely absent, except for low levels in the ventral neural tube. M: Embryo treated with 20 μM SAG. Expression of Ptch1 appeared more intense in all regions compared with control. Ptch1 expression was now prominent in more dorsal regions of the somite and in the lateral plate mesoderm, which showed relatively low expression in the control embryo (K). Regions of increased Ptch1 expression in the somite and lateral plate, adjacent to the DA are indicated by the arrowhead. N: Quantitative PCR analysis of Ptch1 transcript levels. Results represent the average relative transcript levels from 3 embryos for each treatment. Both cyclopamine and SAG treatments are statistically different from controls (P < 0.05, Student’s t-test, indicated by asterisks).
Modulation of Hedgehog Signaling Alters Dorsal Aortae Size, but Not Endothelial Tube Formation
Previous studies have shown that the vascular endothelial tubes fail to form, or form very poorly, in the absence of hedgehog signaling (Byrd et al., 2002; Vokes et al., 2004; Coultas et al., 2010). In all of these studies, hedgehog signaling was disrupted from the earliest stages of endothelial development. Because tubes did not form, it was not possible to determine whether levels of Hh signaling might influence tube size or morphology. We have specifically addressed this question by inhibiting Hh signaling in the quail embryo after formation of the initial vascular network (Fig. 2). Cyclopamine was added at the seven-somite stage, at which time numerous endothelial cells were present and an elaborate network of endothelial cell contacts had formed (Fig. 2B,C). At the seven-somite stage, tube formation had been initiated in the anterior-most regions of the forming dorsal aortae, at approximately the level of the first somite, but the remainder of the aortae consisted of nonlumenated vascular cords. Cross-sections at the level of the fifth somite show an accumulation of QH1 positive cells ventral to the forming somite, but no lumen is visible (Fig. 2D). Treatment with 100 μM cyclopamine was continued for approximately 8 hr, until the 10-somite stage, when endothelial cell patterning was assayed. The majority of embryos (72%) showed altered vascular morphology in response to cyclopamine treatment (Table 1), and it seems likely that the embryos with normal vasculature were those in which Hh signaling levels remained relatively unchanged. In the results presented below, only embryos showing at least some detectable alteration in vascular patterning where subjected to further analysis.
Fig. 2.
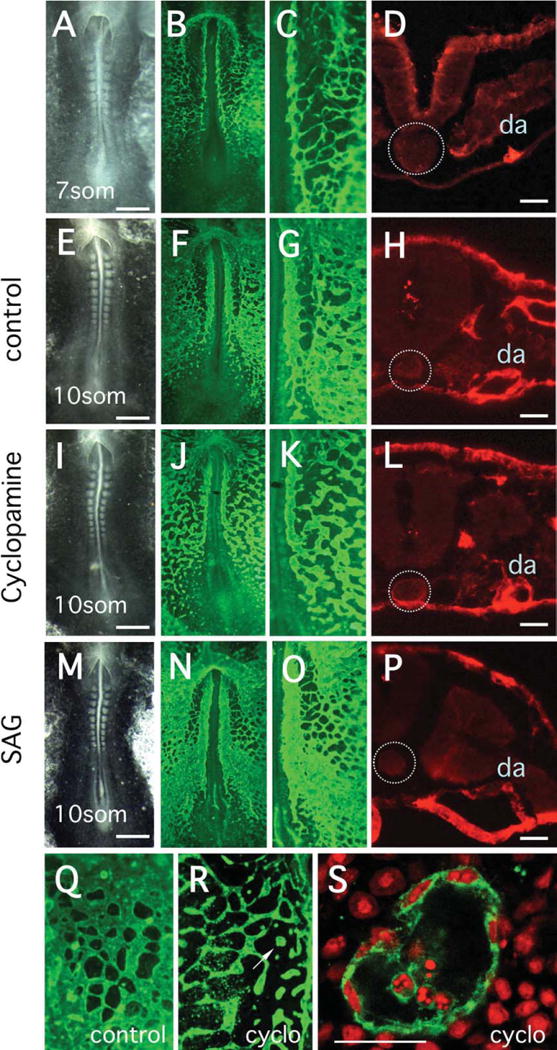
Antibody analysis of vascular formation in quail embryos treated with cyclopamine or SAG. Vascular tissues were detected using QH1 antibody. A–P: The first column shows bright field images of embryos, the second column shows identical embryos stained with QH1, the third column shows magnified images of the vascular plexus region and the fourth column, shows cross-sections through QH1-stained embryos at the level of the fifth somite. A–D: Characterization of embryos at the seven-somite stage, before initiation of treatment. At this stage, a complex network of vascular cords has assembled, but tubulogenesis has only commenced in the most anterior regions of the paired dorsal aortae (DA). Sections at the level of the fifth somite (D) show that angioblasts have assembled at the region of the future DA (da), but tube formation has not started. E–H: Characterization of control embryos at the 10-somite stage at the completion of treatment. The DAs are prominent continuous structures and an elaborate sinusoidal plexus has formed in the adjacent mesoderm. The section image (H) shows the presence of the tubular DA (da). I–L: Characterization of 10-somite stage embryos treated with cyclopamine. Relative to controls, the DA are narrower and much more irregular in appearance. The vascular plexus in less dense and in some places discontinuous. Despite the general disruption of vascular patterning, the section image (L) reveals that tube formation has occurred. M–P: Characterization of 10-somite stage embryos treated with SAG. Relative to controls the DA are wider and the vascular plexus is very dense. The section image at the level of the fifth somite shows the extremely large tubular DA (da). Q: QH1-stained vascular plexus from a control embryo at 10-somites. R: Equivalent region of the vascular plexus from an embryo treated with cyclopamine. In this pronounced example, the plexus has low density and many angioblasts exist in isolated aggregates rather than assembled into cords. S: Confocal image of the isolated angioblast aggregate (indicated by arrow in R), showing the presence of a lumen. QH1 is green, propidium iodide staining for nuclei is red. In panels D, H, L, P, the location of the notochord is indicated by the dotted circle. Scale bar in the first column is 0.5 mm, and in the last column is 100 micro-meters. Scale bar = 50 μm in S.
TABLE 1.
Inhibition or Stimulation of Hh Signaling Resulted in Altered Development of Primary Vascular Structuresa
| Treatment | Abnormal vascular structure | Total number of embryos | Abnormal vascular development (%) |
|---|---|---|---|
| Control | 3 | 45 | 6 |
| Cyclopamine (100 μM) | 36 | 50 | 72 |
| SAG (20 μM) | 7 | 11 | 64 |
Quail embryos were assayed using QH1 antibody to detect vascular endothelial cells.
In control embryos, it was clear that maturation of the dorsal aortae (DA) had occurred between 7- and 10-somite stages. The thin somewhat irregular cords present at the seven-somite stage had developed into continuous patent vessels (Fig. 2F–H) and the adjacent vascular plexus had made further connections to form a highly structured sinus. In contrast, inhibition of Hh signaling resulted in obvious disruption of DA structure relative to controls, with the vessels appearing highly irregular, generally narrower and at some positions, discontinuous (Fig. 2I–K). However, despite the disorganized structure, the DA in the cyclopamine-treated embryos formed distinct lumens and the vessels were patent, even in those regions where they were extremely narrow (Fig. 2L). Treatment with the Hh agonist, SAG, resulted in increased density of the vascular plexus plus an apparent increase in size of the DA (Fig. 2N–P and below). In many cases, SAG treatment expanded the aortae so that they occupied a space equivalent to the entire ventral surface of the somite.
In previous studies we showed that blocking Hh signaling during early vascular development strongly interfered with assembly of the vascular plexus (Vokes et al., 2004). For the experiments in Figure 2, treatment with cyclopamine commenced at the seven-somite stage, but even at this late stage, significant disruption of plexus formation was observed in many embryos (Fig. 2J,K). To determine whether inhibition of Hh signaling inhibited lumen formation, we identified embryos with extreme defects in network formation (compare Fig. 2Q and 2R), and then used confocal imaging to determine whether endothelial cell tubes or hollow spheres were formed. As shown in Figure 2S, these discontinuous cellular aggregates contained lumens, even though structure of the surrounding plexus was highly abnormal.
Dimensions of the Dorsal Aortae and Density of the Vascular Plexus Correlate With Hh Signaling Levels
We carried out a series of measurements to quantitate the effects of inhibiting and stimulating Hh signaling on blood vessel patterning and structure in the quail embryo. First we determined the dimensions of the dorsal aortae (Fig. 3A–C). Because the dorsal aortae were not circular in cross-section, we carried out three distinct measurements, which reflected different properties of the vascular tubes. For example, while the cross-sectional area of the tube may be the most important for fluid flow and vessel function, the measurement of the cross-section length of the vessel wall (approximately the circumference) is the most relevant from a structural point of view, because it is dependent on either the number of cells contributing to the vessel wall or to the shape of those cells. For all three measurements, width, area and perimeter, we observed a statistically significant reduction in tube dimensions following cyclopamine treatment and a statistically significant increase in dimensions after SAG treatment (P < 0.05 using Student’s t-test). Inhibition of Hh decreased the DA perimeter to approximately 63% of wild-type, whereas stimulation of Hh signaling resulted in an increase to approximately 137% of wild-type (Fig. 3C).
Fig. 3.

Quantitation of the structure of the dorsal aortae (DA) and the vascular plexus in quail embryos with inhibited and activated hedgehog (Hh) signaling. A: Relative width of the DA in control, cyclopamine and SAG-treated embryos. Measurements were made from photographs of QH1 stained whole-mount embryos. Measurements were made for each DA at five positions along the AP axis, including at least three embryos for each treatment. B: Measurements of DA area were made by analysis of digital photographs of QH1 stained sections using Image J. Measurements were made at five positions along the AP axis, including at least 3 embryos for each treatment. C: Measurements of DA perimeter (the length of the inside of the DA vessel wall) were made by Image J analysis of the same digital photographs used in (B). Measurements were made at five positions along the AP axis, including at least three embryos for each treatment. D: Area of the vascular plexus was determined by Image J analysis of digital photographs. At least five embryos were assayed for each treatment. In all cases, the measurements for cyclopamine and SAG treated embryos are significantly different from control values (P < 0.05, Student’s t-test, indicated by asterisks).
Next, we measured the total area of the endothelial plexus in response to each treatment. As shown in Figure 3D, the area of the vascular network, measured by QH1 staining, correlated with the levels of Hh signaling. In control embryos (examples in Fig. 2F,G) approximately 71% of the area of the lateral plate mesoderm stained positively with QH1 antibody. Inhibition of Hh signaling with cyclopamine reduced the area of staining by 0.57-fold to 41% of the total area. In contrast, SAG treatment increased the QH1 positive area by 1.25-fold to 91% of the total area. Both of these differences are statistically distinct from the control (Students t-test, P < 0.05).
Changes in Cell Number Are Not Sufficient to Explain Differences in Vessel Structure
Alterations in area of the vascular plexus and the dimensions of the DA could be due to several causes. Previous studies have indicated that Hh can function as a proliferative factor for a range of different cell types (Fuccillo et al., 2006; Elia et al., 2007; Komada et al., 2008; Mao et al., 2010) and so one reasonable explanation would be a decreased number of endothelial cells (ECs) contributing to vascular structures in cyclopamine treated embryos and an excess of ECs in SAG treated embryos. We determined whether the total number of ECs in the quail embryo was altered in response to treatment with cyclopamine or SAG for 8 hr. The results show that inhibition of Hh signaling using cyclopamine resulted in no significant reduction in total EC number during the course of treatment (Fig. 4A). In contrast, treatment with SAG resulted in an approximately 13% increase in the number of ECs (Fig. 4A), which is just statistically significant, P = 0.049 (Student’s t-test). Overall however, increase or decrease in Hh signaling resulted in very little change in the total number of ECs over the duration of the experiment. While overall cell number may be little changed, it is possible that Hh signaling regulates the number of ECs specifically composing the dorsal aortae. To address this possibility, we carried out detailed counts of the number of ECs forming the walls of the DA after the different treatments. Examples of confocal images of DAs co-stained with DAPI (4′,6-diamidine-2-phenylidole-dihydrochloride) and QH1 are shown for control, cyclopamine-treated and SAG-treated embryos in Figure 4B–D, respectively. Numbers were obtained by counting the number of cells contributing to each of the paired dorsal aortae, in at least five sections per embryo, for at least three embryos per treatment. This quantitation revealed no statistically significant difference in the number of cells comprising the walls of the DAs in response to the inhibition or stimulation of Hh signaling. Therefore, rather than regulating cell number, it seems likely that Hh controls structural aspects of vessel assembly, for example, thickness of the vessel wall, interactions of ECs with the ECM or EC–EC adhesion, leading to changes in the overall size and/or shape of the resulting blood vessel.
Fig. 4.

The number of cells comprising vascular structures is little changed after inhibition or activation of hedgehog (Hh) signaling. After experimental treatment, quail embryos were stained with QH1 to detect angioblasts and DAPI (4′,6-diamidine-2-phenylidole-dihydrochloride) to mark nuclei. A: Endothelial cell (EC) number was determined by counting number of nuclei corresponding to QH1 stained cells. Five sections were counted for each embryo, with at least three embryos for each treatment. The number of ECs in SAG treated embryos is significantly different from controls and cyclopamine-treated embryos (asterisk). B–D: Determination of number of ECs comprising the dorsal aortae (DA). Confocal images of sections at approximately the level of the fifth somite. From left to right the panels show DAPI stain, QH1 stain and the merged image. Representative images are shown for a single DA in control (B), cyclopamine-treated (C) and SAG-treated embryos (D). Scale bar = 100 μm. E: Number of cells contributing to the wall of the DA. DAPI-stained nuclei contained in the wall of the vessels (QH1 stained) were counted. Cells in both DA were counted in at least five sections per embryo, for at least three embryos for each treatment. Despite differences in the size of the vessels, the number of ECs comprising the walls was unchanged by the different treatments.
Apart from the dimensions of the DA, the other major alteration we observed in vascular patterning following modulation of Hh signaling, was the density of the endothelial plexus (Fig. 3D). Because the number of endothelial cells in the embryo hardly changed following inhibition or stimulation of Hh signaling (Fig. 4A), it seemed likely that the alteration in plexus density resulted from changes in EC morphology or behavior. Therefore, we used confocal imaging of QH1 stained quail embryos, to examine the morphology of ECs in the process of plexus formation. These studies focused on posterior regions of the embryo, where the process was still incomplete when treatment was initiated at the seven-somite stage (for example, Fig. 2B). As for previous experiments, quail embryos were treated with cyclopamine or SAG for 8 hr before fixation and antibody staining. Confocal imaging revealed a distinct difference in the appearance of ECs following different treatments. Independent of the density of the region of plexus examined, inhibition of Hh signaling resulted in reduced presence of filopodia on ECs compared with controls (compare Fig. 5B, and D). In contrast, stimulation of the Hh pathway using SAG resulted in a conspicuous increase in the total number of filopodia (Fig. 5F). To quantitate this effect we calculated the number of filopodia per length of vascular edge or perimeter (Fig. 5G). These results clearly demonstrated a significant reduction in relative number of filopodia when Hh signaling was inhibited (0.57× control value) and an increase in filopodia number when Hh signaling was stimulated (1.77× control value).
Fig. 5.

Relative number of EC filopodia correlates with hedgehog (Hh) signaling levels. After experimental treatment, quail embryos were stained with QH1 to mark endothelial cells (ECs) and images of the vascular plexus were obtained using confocal microscopy. A: Image of region of vascular plexus from posterior of embryo, adjacent to dorsal aorta (just out of frame at top), of control embryo. B: Inverted image (ECs are black) of region outlined in box in A. Filopodia extending from ECs are indicated by open arrowheads. C: Image of vascular plexus of cyclopamine treated embryo. Plexus region is equivalent to that in control. D: Inverted image of region outlined in box in C showing filopodia marked with arrowheads. E: Image of vascular plexus of SAG-treated embryo. Plexus region is equivalent to that in control. F: Inverted image of region outlined in box in E showing filopodia marked with arrowheads. G: Quantitation of relative number of filopodia following different treatments. Total number of filopodia were counted and then normalized against length of perimeter (edge). Length of perimeter was calculated using Image J. Plexus on both sides of midline was counted for at least three embryos for each treatment. Results show that the relative number of filopodia correlates with the level of Hh signaling and that both cyclopamine and SAG treatments are significantly different from controls (P < 0.05, Student’s t-test, indicated by asterisks).
Expression of Vegfa but Not Notch1 Is Altered in Response to Changes in Hh Signaling
We have carried out preliminary studies to determine which signaling pathways lie downstream of Hh and which may, therefore, be responsible for alterations of vascular patterning. Previous studies have indicated that both the VEGF and Notch signaling pathways are modulated in response to Hh (Pola et al., 2001; Lawson et al., 2002) and so we have examined whether elements of these pathways are altered following cyclopamine and SAG treatment. In situ hybridization analysis reveals that Vegfa transcript levels are conspicuously altered by inhibition or stimulation of Hh signaling using cyclopamine and SAG respectively (Fig. 6A–C). This result suggests that VEGF signaling represents at least one of the pathways mediating Hh effects on endothelial structure. On the other hand, expression of Notch1, which is robustly expressed in embryonic endothelial cells, was not obviously altered in response to changes in Hh signaling (Fig. 6D–F).
Fig. 6.
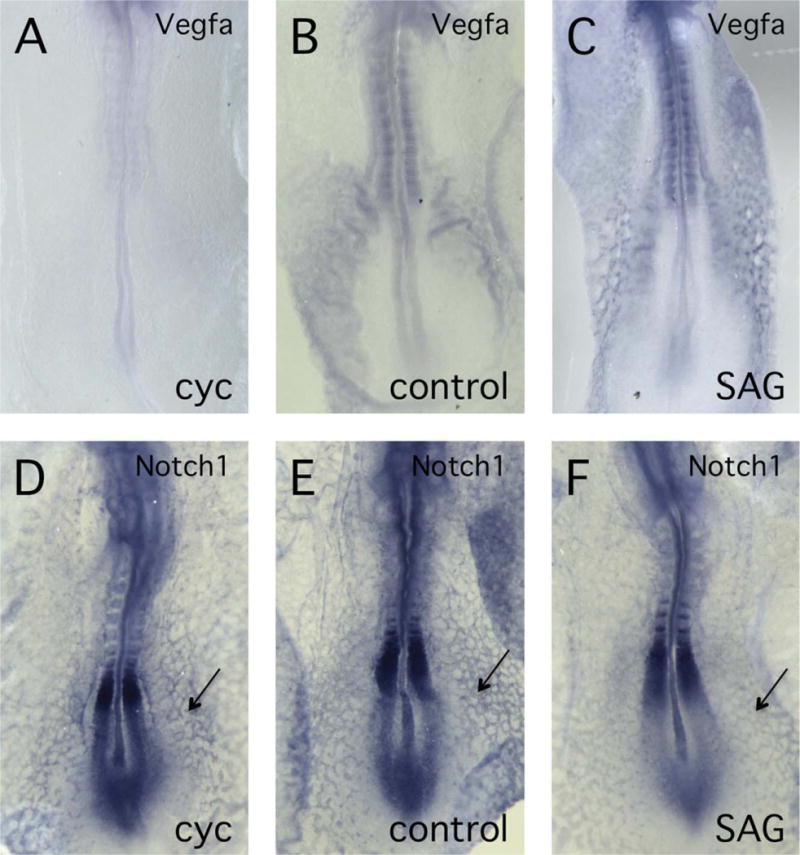
Vegfa but not Notch1 expression levels change when hedgehog (Hh) signaling is altered. In situ hybridization analysis of chick embryos was used to examine expression of Vegfa (A–C) and Notch1 (D–F) after treatment with Hh inhibitor (cyclopamine, 100 μM) or activator (SAG, 20 μM). A: Embryo treated with cyclopamine showing reduced expression of Vegfa compared with controls. B: Control embryo showing normal Vegfa expression pattern. C: Embryo treated with SAG showing increased expression of Vegfa compared with controls. D–F: Embryos treated with either cyclopamine (D) or SAG (F), showed Notch1 expression patterns indistinguishable from control embryos (E). Arrows indicate Notch1 expression in the endothelium.
DISCUSSION
Inhibition and Stimulation of Hh Signaling Using Cyclopamine and SAG
Previous studies have described the use of cyclopamine to inhibit Hh signaling in the avian embryo (Incardona et al., 1998; Kim and Melton, 1998; Britto et al., 2002; Vokes et al., 2004). We have confirmed the effectiveness of cyclopamine for inhibition of Hh signaling in the avian embryo (Fig. 1) using transcript levels of the Hh receptor, Ptch1, as a direct molecular marker (Pearse et al., 2001). We have also demonstrated the use of the smoothened agonist, SAG, to up-regulate Hh signaling in the avian embryo (Fig. 1), again using Ptch1 expression as an assay. Quantitation of Ptch1 expression by qPCR, indicated that cyclopamine at 100 μM reduced Hh signaling to approximately 70% of wild-type levels (Fig. 1). This is an average figure, and measurements of individual embryos suggest that it is possible to reduce Ptch1 expression to approximately 30% of wild-type levels (data not shown), which is consistent with levels of inhibition reported in cell culture studies (Shiroyanagi et al., 2007). Treatment with SAG increased the intensity of Ptch1 transcript staining when assayed by in situ hybridization (Fig. 1F–J) and also by qPCR (Fig. 1N). In situ analysis also showed expansion of Ptch1 expression. For example, following SAG treatment, Ptch1 transcripts were detected in the lateral mesoderm ventral and lateral to the somites (Fig. 1J,M). This area shows extremely weak Ptch1 staining in control embryos. SAG treatment also resulted in strong expression of Ptch1 extending into dorsal regions of the somites (Fig. 1M), a region that is only weakly stained in controls (Fig. 1K).
Alterations in Vascular Morphology in Response to Altered Hh Signaling
In previous studies, we showed that inhibition of Hh signaling in avian embryos resulted in severe disruption of vascular development (Vokes et al., 2004). In these studies cyclopamine at 100 μM was added at approximately the time that angioblasts first appeared in the mesoderm. Endothelial cells accumulated in discrete aggregates, the vascular plexus was highly disrupted and no lumen formation was observed. In this present work we have followed up on the original studies by inhibiting Hh signaling after the initial vascular plexus has formed, to determine whether Hh may play a role in regulating the size and morphology of blood vessels. Our results quite clearly demonstrate that either inhibition or stimulation of Hh signaling results in quite dramatic changes in structure of the dorsal aortae and the vascular plexus (Fig. 2). Inhibition of Hh function caused the DA to be smaller, more irregular in structure and in some cases discontinuous (Fig. 2E–H). However, even at the places where the DA were narrowest, they retained a patent lumen. These results are somewhat different from those previously reported for mouse embryos completely deficient in Hh signaling due to ablation of the Smo gene (Vokes et al., 2004; Coultas et al., 2010). In the trunk region of mouse embryos, the DA completely failed to undergo tubulogenesis, even though normal numbers of angioblasts were present (Vokes et al., 2004). In other regions of the Smo mutant mouse embryo, particularly the head and tail, limited formation of endothelial tubes did occur. Several explanations can account for the differences observed between the mouse results and the current studies using quail. First, cyclopamine treatment may not have achieved the same inhibition of Hh function as the Smo knockout mouse. It is possible, therefore, that low levels of Hh are sufficient to permit tubulogenesis, even though the resulting vessels may be malformed. Second, it is possible that other endothelial growth factors can compensate for reduction in Hh signaling in the avian embryo, but not in the mouse embryo. Third, early inhibition of Hh signaling in the Smo knockout embryos may have prevented assembly of the vascular cords, which in turn prevented tube formation. Later inhibition of Hh in the avian studies may have bypassed this essential step. In addition to influencing DA development, cyclopamine also inhibited later development of the vascular plexus. Compared with controls, the vascular network occupied less area and in was in many examples fragmented (compare Figs. 2F,G and 2J,K). However, even the smallest endothelial aggregates contained lumens when examined at the 10-somite stage (Fig. 2R,S).
Stimulation of Hh signaling using SAG caused precisely the opposite effects to inhibition. The paired DA were larger in size and the vascular plexus occupied a greater area than controls. On average, the length of the inner wall of the DA (perimeter) increased by more than a third compared with controls (Fig. 3C), but in some extreme cases (Fig. 2P) the length was almost doubled. These results are broadly similar to those observed in the Ptch1 null mouse (Coultas et al., 2010) in which Hh signaling is up-regulated. Taken together, the inhibition and stimulation studies demonstrate that the size of the DA and the density of the vascular plexus correlate with Hh signaling levels.
Changes in Vascular Pattern Are Due to Alterations in Morphology and Cell Behavior, Not Changes in Cell Number
Previous studies have shown that Hh can act as a mitogen for numerous cell types (Fuccillo et al., 2006; Elia et al., 2007; Komada et al., 2008; Mao et al., 2010). These effects may be due to direct binding of Hh to responding cells, or may be achieved indirectly through Hh activation of downstream growth factors. To determine whether the vascular defects observed when Hh signaling was either inhibited or activated were due to changes in angioblast cell number, we carried out detailed cell counts (Fig. 4). We found that the number of angioblasts was more or less unchanged when Hh activity was altered. The largest effect was observed in the presence of SAG, where the total number of angioblasts was seen to increase approximately 13% relative to controls (Fig. 4A). These results are consistent with a role for Hh as a mitogen (either directly or indirectly) for endothelial cells, but they do indicate that the 8-hr period of treatment was too short for cell numbers to change very much. Perhaps the most intriguing observation is that the walls of the DAs in embryos treated with cyclopamine and SAG contained apparently identical numbers of endothelial cells (Fig. 4E). This indicates that the rather major differences in DA structure in response to inhibition or activation of Hh signaling must be due to alterations in cell behavior or structure, not due to differences in the number of cells constituting the vessel.
The other major alteration in vascular structure in response to alteration of Hh activity was the density or the area of the vascular plexus. Again, the fact that EC numbers were unchanged, suggests that alterations in cell properties must underlie the different plexus structures. Previous studies have shown that when Hh signaling is inhibited by cyclopamine before plexus formation, angioblasts assemble into clumps of cells and fail to construct the connecting bridges that generate the primitive vascular network (Vokes et al., 2004). It seems reasonable to speculate that formation of the primitive plexus might involve the extension of filopodial processes as a precursor to establishment of adhesion between angioblasts. Similarly, it is possible that up-regulation of filopodia activity might partially explain increased interactions between angioblasts leading to greater density of the vascular plexus. When we counted the number of EC filopodia in the 10-somite embryo, we observed a correlation between the level of Hh signaling and the number of filopodia (Fig. 5G). It is not clear whether the stimulation of filopodia activity is a direct response of endothelial cells to Hh signaling or whether it may be mediated through other growth factors. Previous studies have shown the Hh can activate several signaling pathways relevant to endothelial cell patterning and behavior, including the VEGF and Notch pathways (Pola et al., 2001; Lawson et al., 2002). Indeed, VEGF is known to regulate the density of filopodial extensions on ECs (Ruhrberg et al., 2002; Gerhardt et al., 2003) and inhibition of VEGF activity results in reduction of cellular protrusions during vascular plexus formation (Drake et al., 2000), consistent with the results we observed. Preliminary results (Fig. 6A–C) indicate that VEGF transcript levels are responsive to changes in Hh signaling. Therefore, VEGF signaling may, at least in part, mediate the effects of Hh during vascular development in the avian embryo. In contrast, whereas the Notch pathway regulates EC sprouting during formation of retinal blood vessels (Hellström et al., 2007), we do not observe changes in expression of the Notch signaling component Notch1 when Hh signaling is altered (Fig. 6D–F). We cannot exclude the possibility however, that expression of other Notch signaling molecules is regulated by Hh signaling in the avian embryo. We plan further studies to determine the relative contributions of these different, potentially interacting, signaling pathways in regulation of avian vascular development.
EXPERIMENTAL PROCEDURES
Treatment of Embryos
Fertilized chick eggs were obtained from Hy-Line Inc. and quail eggs from Strickland Game and Bird Farm. At the seven-somite stage embryos were removed from the egg and maintained in New culture. Cyclopamine (Calbiochem) was dissolved in dimethyl sulfoxide (DMSO) and mixed with the carrier, 5-hydroxy-beta-cyclodextran (HBC). Cyclopamine in HBC or HBC alone, as a control, was applied to the top of the embryo in a final volume of 150 ml. After 4 hr in culture, the overlying fluid was removed and another 150 ml of cyclopamine solution was applied. Total incubation in cyclopamine was 8 hr at which time embryos were harvested for analysis. SAG (Enzo Life Sciences), purmorphamine (EMD), SANT1 (EMD), and jervine (Sigma-Aldrich), were dissolved in DMSO and applied to the embryos exactly as described for cyclopamine. After analysis of dose curves, all further studies were carried out using cyclopamine at 100 μM and SAG at 20 μM.
In Situ Hybridization and Antibody Analysis
The chick Patched1 probe construction has been described previously (Pearse et al., 2001). Whole-mount in situ hybridization was carried out using digoxigenin-labeled probes and standard conditions. QH1 antibody was obtained from the Developmental Studies Hybridoma Bank and staining was carried out as described previously (Vokes et al., 2004). For qPCR analysis of chick transcripts, primers were as follows: Ptch1 forward primer: GTGTCAGGCATCAGTGAGGA; Ptch1 reverse primer: TGCAATCTGGGACTTGACTG; RNA pol2 forward primer: TTTGGACTGTGGTCACGTAGC; RNA pol2 reverse primer. AGGTTTGAGGGAGGACTGAAC. Real time PCR was performed in a Rotor-Gene Q using two standard curve quantitation. Measurement of the area of the QH1-stained vascular plexus, dorsal aorta perimeter, and dorsal aorta cross-sectional area were all determined using ImageJ.
Quantitation and Cell Counts
For determination of relative width of the dorsal aortae, photographs of embryos stained with QH1 were measured using Image J and arbitrary units. Measurements were taken for each dorsal aortae at two-somite intervals, starting at the second somite and included at least three embryos for each treatment. For determination of dorsal aortae area and perimeter, digital photographs of paraffin sections obtained using a compound microscope were analyzed using ImageJ. In this case, real dimensions of the vessels were determined using a reference micrometer.
For measurement of endothelial cell numbers, embryos were whole-mount stained with QH1 and DAPI and then sectioned. Endothelial cell numbers were determined by counting number of nuclei contained within QH1 positive cells starting at the level of the fifth somite and continuing for five consecutive sections. Numbers were determined for at least three embryos for each treatment. Identical methods were used to determine the number of ECs composing the dorsal aortae for each treatment.
Supplementary Material
Acknowledgments
Thanks to Tanya Yatskievych for training in avian embryo isolation and culture, to Parker Antin for providing chick eggs, and to John Fallon for suggesting the SAG experiments. P.A.K. is the Allan C. Hudson and Helen Lovaas Endowed Professor of the Sarver Heart Center at the University of Arizona College of Medicine and is supported by the Sarver Heart Center.
Grant sponsor: NHLBI of the NIH; Grant number: HL74184; Grant number: HL093694.
Footnotes
Additional Supporting Information may be found in the online version of this article.
References
- Britto J, Tannahill D, Keynes R. A critical role for sonic hedgehog signaling in the early expansion of the developing brain. Nat Neurosci. 2002;5:103–110. doi: 10.1038/nn797. [DOI] [PubMed] [Google Scholar]
- Byrd N, Becker S, Maye P, Narasimhaiah R, St-Jacques B, Zhang X, McMahon J, McMahon A, Grabel L. Hedgehog is required for murine yolk sac angiogenesis. Development. 2002;129:361–372. doi: 10.1242/dev.129.2.361. [DOI] [PubMed] [Google Scholar]
- Chen JK, Taipale J, Young KE, Maiti T, Beachy PA. Small molecule modulation of Smoothened activity. Proc Natl Acad Sci U S A. 2002;99:14071–14076. doi: 10.1073/pnas.182542899. [DOI] [PMC free article] [PubMed] [Google Scholar]
- Cleaver O, Krieg PA. Vascular development. In: Harvey RP, Rosenthal N, editors. Heart development and regeneration. Amsterdam: Elsevier; 2010. p. 2010. [Google Scholar]
- Coffin JD, Poole TJ. Embryonic vascular development: immunohistochemical identification of the origin and subsequent morphogenesis of the major vessel primordia in quail embryos. Development. 1988;102:735–748. doi: 10.1242/dev.102.4.735. [DOI] [PubMed] [Google Scholar]
- Coffin JD, Poole TJ. Endothelial cell origin and migration in embryonic heart and cranial blood vessel development. Anat Rec. 1991;231:383–395. doi: 10.1002/ar.1092310312. [DOI] [PubMed] [Google Scholar]
- Colnot C, de la Fuente L, Huang S, Hu D, Lu C, St-Jacques B, Helms JA. Indian hedgehog synchronizes skeletal angiogenesis and perichondrial maturation with cartilage development. Development. 2005;132:1057–1067. doi: 10.1242/dev.01649. [DOI] [PubMed] [Google Scholar]
- Cooper MK, Porter JA, Young KE, Beachy PA. Teratogen-mediated inhibition of target tissue response to Shh signaling. Science. 1998;280:1603–1607. doi: 10.1126/science.280.5369.1603. [DOI] [PubMed] [Google Scholar]
- Coultas L, Nieuwenhuis E, Anderson GA, Cabezas J, Nagy A, Henkelman RM, Hui CC, Rossant J. Hedgehog regulates distinct vascular patterning events through VEGF dependent and independent mechanisms. Blood. 2010;116:653–660. doi: 10.1182/blood-2009-12-256644. [DOI] [PubMed] [Google Scholar]
- Drake CJ, LaRue A, Ferrara N, Little CD. VEGF regulates cell behavior during vasculogenesis. Dev Biol. 2000;224:178–188. doi: 10.1006/dbio.2000.9744. [DOI] [PubMed] [Google Scholar]
- Elia D, Madhala D, Ardon E, Reshef R, Halevy O. Sonic hedgehog promotes proliferation and differentiation of adult muscle cells: involvement of MAPK/ERK and PI3K/Akt pathways. Biochim Biophys Acta. 2007;1773:1438–1446. doi: 10.1016/j.bbamcr.2007.06.006. [DOI] [PubMed] [Google Scholar]
- Ellis T, Smyth I, Riley E, Graham S, Elliot K, Narang M, Kay GF, Wicking C, Wainwright B. Patched 1 conditional null allele in mice. Genesis. 2003;36:158–161. doi: 10.1002/gene.10208. [DOI] [PubMed] [Google Scholar]
- Franz-Odendaal TA. Toward understanding the development of scleral ossicles in the chicken, Gallus gallus. Dev Dyn. 2008;237:3240–3251. doi: 10.1002/dvdy.21754. [DOI] [PubMed] [Google Scholar]
- Fuccillo M, Joyner AL, Fishell G. Morphogen to mitogen: the multiple roles of hedgehog signalling in vertebrate neural development. Nat Rev Neurosci. 2006;7:772–783. doi: 10.1038/nrn1990. [DOI] [PubMed] [Google Scholar]
- Gerhardt H, Golding M, Fruttiger M, Ruhrberg C, Lundkvist A, Abramsson A, Jeltsch M, Mitchell C, Alitalo K, Shima D, Betsholtz C. VEGF guides angiogenic sprouting utilizing endothelial tip cell filopodia. J Cell Biol. 2003;161:1163–1177. doi: 10.1083/jcb.200302047. [DOI] [PMC free article] [PubMed] [Google Scholar]
- Hellström M, Phng LK, Hofmann JJ, Wallgard E, Coultas L, Lindblom P, Alva J, Nilsson AK, Karlsson L, Gaiano N, Yoon K, Rossant J, Iruela-Arispe ML, Kalen M, Gerhardt H, Betsholtz C. Dll4 signalling through Notch1 regulates formation of tip cells during angiogenesis. Nature. 2007;445:776–780. doi: 10.1038/nature05571. [DOI] [PubMed] [Google Scholar]
- Hutson MR, Sackey FN, Lunney K, Kirby ML. Blocking hedgehog signaling after ablation of the dorsal neural tube allows regeneration of the cardiac neural crest and rescue of outflow tract septation. Dev Biol. 2009;335:367–373. doi: 10.1016/j.ydbio.2009.09.013. [DOI] [PMC free article] [PubMed] [Google Scholar]
- Incardona JP, Gaffield W, Kapur RP, Roelink H. The teratogenic veratrum alkaloid cyclopamine inhibits sonic hedgehog signal transduction. Development. 1998;125:3553–3562. doi: 10.1242/dev.125.18.3553. [DOI] [PubMed] [Google Scholar]
- Kim SK, Melton DA. Pancreas development is promoted by cyclopamine, a hedgehog signaling inhibitor. Proc Natl Acad Sci U S A. 1998;95:13036–13041. doi: 10.1073/pnas.95.22.13036. [DOI] [PMC free article] [PubMed] [Google Scholar]
- Kolpak AL, Jiang J, Guo D, Standley C, Bellve K, Fogarty K, Bao ZZ. Negative guidance factor-induced macropinocytosis in the growth cone plays a critical role in repulsive axon turning. J Neurosci. 2009;29:10488–10498. doi: 10.1523/JNEUROSCI.2355-09.2009. [DOI] [PMC free article] [PubMed] [Google Scholar]
- Komada M, Saitsu H, Kinboshi M, Miura T, Shiota K, Ishibashi M. Hedgehog signaling is involved in development of the neocortex. Development. 2008;135:2717–2727. doi: 10.1242/dev.015891. [DOI] [PubMed] [Google Scholar]
- Lawson ND, Vogel AM, Weinstein BM. Sonic hedgehog and vascular endothelial growth factor act upstream of the Notch pathway during arterial endothelial differentiation. Dev Cell. 2002;3:127–136. doi: 10.1016/s1534-5807(02)00198-3. [DOI] [PubMed] [Google Scholar]
- Mao J, Kim BM, Rajurkar M, Shivdasani RA, McMahon AP. Hedgehog signaling controls mesenchymal growth in the developing mammalian digestive tract. Development. 2010;137:1721–1729. doi: 10.1242/dev.044586. [DOI] [PMC free article] [PubMed] [Google Scholar]
- Nagase T, Nagase M, Yoshimura K, Fujita T, Koshima I. Angiogenesis within the developing mouse neural tube is dependent on sonic hedgehog signaling: possible roles of motor neurons. Genes Cells. 2005;10:595–604. doi: 10.1111/j.1365-2443.2005.00861.x. [DOI] [PubMed] [Google Scholar]
- Pearse RV, Jr, Vogan KJ, Tabin CJ. Ptc1 and Ptc2 transcripts provide distinct readouts of Hedgehog signaling activity during chick embryogenesis. Dev Biol. 2001;239:15–29. doi: 10.1006/dbio.2001.0430. [DOI] [PubMed] [Google Scholar]
- Pepicelli CV, Lewis PM, McMahon AP. Sonic hedgehog regulates branching morphogenesis in the mammalian lung. Curr Biol. 1998;8:1083–1086. doi: 10.1016/s0960-9822(98)70446-4. [DOI] [PubMed] [Google Scholar]
- Pola R, Ling LE, Silver M, Corbley MJ, Kearney M, Blake Pepinsky R, Shapiro R, Taylor FR, Baker DP, Asahara T, Isner JM. The morphogen Sonic hedgehog is an indirect angiogenic agent upregulating two families of angiogenic growth factors. Nat Med. 2001;7:706–711. doi: 10.1038/89083. [DOI] [PubMed] [Google Scholar]
- Ruhrberg C, Gerhardt H, Golding M, Watson R, Ioannidou S, Fujisawa H, Betsholtz C, Shima DT. Spatially restricted patterning cues provided by heparin-binding VEGF-A control blood vessel branching morphogenesis. Genes Dev. 2002;16:2684–9268. doi: 10.1101/gad.242002. [DOI] [PMC free article] [PubMed] [Google Scholar]
- Scherz PJ, McGlinn E, Nissim S, Tabin CJ. Extended exposure to Sonic hedgehog is required for patterning the posterior digits of the vertebrate limb. Dev Biol. 2007;308:343–354. doi: 10.1016/j.ydbio.2007.05.030. [DOI] [PMC free article] [PubMed] [Google Scholar]
- Shiroyanagi Y, Liu B, Cao M, Agras K, Li J, Hsieh MH, Willingham EJ, Baskin LS. Urothelial sonic hedgehog signaling plays an important role in bladder smooth muscle formation. Differentiation. 2007;75:968–977. doi: 10.1111/j.1432-0436.2007.00187.x. [DOI] [PubMed] [Google Scholar]
- Vokes SA, Yatskievych TA, Heimark RL, McMahon J, McMahon AP, Antin PB, Krieg PA. Hedgehog signaling is essential for endothelial tube formation during vasculogenesis. Development. 2004;131:4371–4380. doi: 10.1242/dev.01304. [DOI] [PubMed] [Google Scholar]
- Wu X, Walker J, Zhang J, Ding S, Schultz PG. Purmorphamine induces osteogenesis by activation of the hedgehog signaling pathway. Chem Biol. 2004;11:1229–1238. doi: 10.1016/j.chembiol.2004.06.010. [DOI] [PubMed] [Google Scholar]
- Zhang XM, Ramalho-Santos M, McMahon AP. Smoothened mutants reveal redundant roles for Shh and Ihh signaling including regulation of L/R symmetry by the mouse node. Cell. 2001;106:781–792. [PubMed] [Google Scholar]
Associated Data
This section collects any data citations, data availability statements, or supplementary materials included in this article.