Abstract
Background
Gastroparesis is characterized by delayed gastric emptying without mechanical obstruction, but remains difficult to diagnose and distinguish from other GI disorders. Gastroparesis affects the gastric slow wave, but noninvasive assessment has been limited to the electrogastrogram (EGG), which reliably characterizes temporal dynamics but does not provide spatial information.
Methods
We measured gastric slow wave parameters from the EGG and magnetogastrogram (MGG) in patients with gastroparesis and in healthy controls. In addition to dominant frequency (DF) and percentage power distribution (PPD), we measured the propagation velocity from MGG spatiotemporal patterns and the percentage of slow wave coupling (%SWC) from EGG.
Key Results
No significant difference in DF was found between patients and controls. Gastroparesis patients had lower percentages of normogastric frequencies (60 ± 6% vs 78 ± 4%, p<0.05), and higher brady- (9 ± 2% vs 2 ± 1%, p<0.05) and tachygastric (31 ± 2 % vs 19 ± 1%, p<0.05) frequency content postprandial, indicative of uncoupling. Propagation patterns were substantially different in patients and longitudinal propagation velocity was retrograde at 4.3 ± 2.9 mm/s vs anterograde at 7.4 ± 1.0 mm/s for controls (p < 0.01). No difference was found in %SWC from EGG.
Conclusions & Inferences
Gastric slow wave parameters obtained from MGG recordings distinguish gastroparesis patients from controls. Assessment of slow wave propagation may prove critical to characterization of underlying disease processes. Future studies should determine pathologic indicators from MGG associated with other functional gastric disorders, and whether multichannel EGG with appropriate signal processing also reveals pathology.
Keywords: electrogastrogram, magnetogastrogram, functional gastric disorders
Introduction
Mixing and propulsion of food products in the stomach is mediated by the slow wave in the gastric musculature. The slow wave originates in the gastric electrical syncytium along the greater curvature of the mid- to upper corpus and propagates toward the pylorus (anterograde propagation) (1, 2). Slow waves with a frequency near three cycles per minute (cpm) are observed in normal subjects (3) and certain conditions like gastroparesis are known to alter the normal slow wave (4–7).
The electrogastrogram (EGG) records cutaneous potentials related to the gastric slow wave, and the frequency of the EGG has been demonstrated to reflect underlying serosal electrical activity (8). However, abdominal layers with alternating low- and high-conductivities distort and attenuate temporal and phase information in electric potentials such that only temporal dynamics can be reliably recorded (9, 10). Typical EGG studies have evaluated primarily the dominant frequency (DF) of the gastric slow wave, the percentage of slow waves in the normogastric frequency range and the percentage of power distributed (PPD) in bradygastric, normogastric and tachygastric frequency ranges (11, 12). Additionally, the percentage of slow wave coupling (%SWC) is a parameter that attempts to evaluate the integrity of coupling in the gastric syncytium by comparing frequencies of slow waves recorded in adjacent EGG electrodes (13–15). A recent study showed that %SWC was the only stable EGG parameter with reproducibility adequate for clinical studies (16).
Slow waves also produce extracellular magnetic fields which may be measured in the magnetogastrogram (MGG) with Superconducting QUantum Interference Device (SQUID) magnetometers (17). Magnetic fields are relatively insensitive to the effect of abdominal tissue layers (9). In addition to temporal dynamics of the slow wave, MGG preserves phase characteristics of slow wave signals from spatially separated gastric sources allowing the characterization of propagation (18).
This study was designed to evaluate slow wave electrophysiological parameters that distinguish patients with diabetic gastroparesis from normal controls.
Methods
This study was approved by the Institutional Review Board at Vanderbilt University and conducted with assistance from the General Clinical Research Center at Vanderbilt University Medical Center. We studied seven patients diagnosed at Vanderbilt with diabetic gastroparesis on the basis of abnormal gastric emptying (45 ± 13 y, all 7 F; t1/2 = 245 m ± 37 m) and seven normal controls (48 ± 8 y, 4 M/3 F). We measured the multichannel MGG and EGG before and after a standardized turkey sandwich meal.
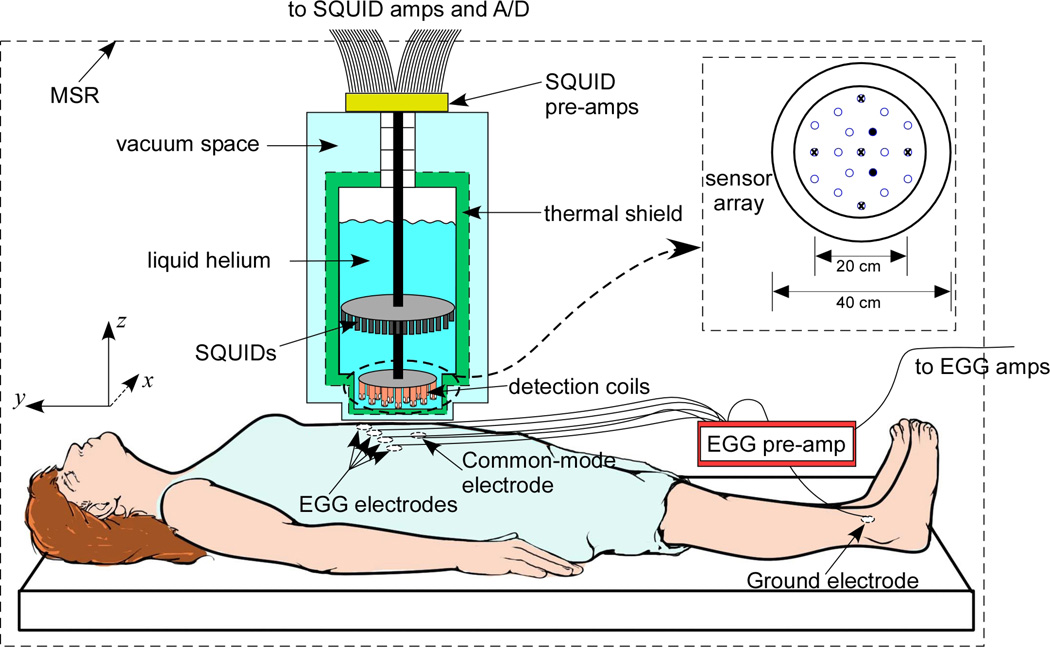
Electrogastrograms were measured using four silver-silver chloride cutaneous EKG electrodes (Rochester Electro-med, Rochester, MN) arranged in a line in the epigastric region from 5 cm below and 5 cm to the subject’s left of the xiphoid to 5 cm below and 10 cm to the subject’s right of the xiphoid, as illustrated in Figure 1 (19). The electrode signals were pre-amplified in the magnetically shielded room and subsequently amplified (BioSEMI Active Two, Amsterdam) outside the MSR, digitized and stored in a personal computer (LabVIEW, National Instruments, Austin, TX; Dell, Austin TX). Magnetogastrograms were detected with a SQUID gradiometer (Model 637, Tristan Technologies, San Diego, CA), centered above the subject’s epigastrium. SQUID signals time-synced with the electrode data were amplified, digitized and stored. The SQUID signals were amplified by Quantum Design Model 5000 amplifiers, which incorporate a hardware filter of 1 kHz. The SQUID signals are sampled at 3 kHz and downsampled to 300 Hz. The Tristan 637 consists of 19 normal-component (z-component) sensors oriented perpendicular to the body surface and five full vector sensors, as illustrated in the inset of Figure 1. At the time of the recordings, two of the 19 z-component sensors were not operational and were not included in the analyses (indicated in the inset of Figure 1 as filled circles). Power spectral densities (PSDs) were computed using a Fast Fourier Transform (FFT) algorithm in MATLAB (Mathworks, Natick, MA).
Figure 1.
Experimental setup to measure MGG using a SQUID magnetometer and EGG with cutaneous electrodes in gastroparesis patients and normal controls. The SQUID sensor array shown in the inset consists of 19 normal-component (z) sensors and five vector channels (marked with x) that also sample x and y magnetic field components.
To eliminate noise contributions to SQUID signals, we found signal decomposition by Second Order Blind Identification (SOBI) superior to filtering alone (20, 21). SOBI decomposes the multichannel SQUID data into separate signal and noise components. Gastric signal components were identified by a blinded observer as primarily sinusoidal signals with dominant peaks in FFT frequency spectra in a range of frequencies between 1 and 9 cpm (17). We reconstructed MGG from SOBI components (SOBI-MGG) by isolating gastric components and projecting them spatially to the sensor array. For frequency analyses, the central channel in the reconstructed SOBI-MGG array is selected and Fourier transformed, from which the dominant frequency and the percentage of power distributed in bradygastric (1–2.5 cpm), normogastric (2.5 – 4 cpm) and tachygastric (4–9 cpm) ranges (18) are computed. The central channel is chosen because of its presumed proximity to the gastric syncytium, but it should be noted that as a SOBI reconstruction, this channel contains gastric signal contributions from the entire recording array.
To identify propagation patterns and compute propagation velocity, we reconstructed gastric slow wave signal components identified by SOBI in the sensor array and prepared spatiotemporal maps of signal intensity. For propagation analysis, at least two SOBI components in the gastric frequency range are required from the 120 s data segment analyzed to ensure a phase difference across the sensor array. A blinded observer computed the gastric slow wave propagation velocity by tracking the maximum of the resulting SOBI-MGG maps (22). For the propagation velocity estimate, we averaged the velocity obtained from three successive slow wave cycles (22). Differences between slow wave parameters for controls and patients were evaluated statistically using Student’s t-test with p < 0.05 considered significant.
EGG signals were sampled at 256 Hz and downsampled to 30 Hz for analysis. Electrode signals were filtered digitally with a bandpass continuous wavelet filter between 1 and 120 cpm (17, 21, 23), and the filtered signals were then Fourier transformed. We analyzed dominant frequency and PPD for all channels and compared using median values. We also analyzed the percentage of slow wave coupling (%SWC) by computing the percentage of adjacent channels with dominant frequencies that agreed to within 0.5 cpm (24). Analysis of spatiotemporal signal characteristics requires multiple channels of data. For 4-channel EGG data, phase shifts between channels were not observed consistently enough to determine propagation directly.
We were concerned that the standard EGG electrode arrangement, which uses only four EGG electrodes, would not provide spatial resolution comparable to the 19 channels recorded by the SQUID. For this reason, in two patients and two normal subjects, we recorded EGG in a 16-channel electrode array arranged in a 4×4 square extending five cm above the xiphoid to 5 cm above the umbilicus and 10 cm to the subject’s left of the sternum to 5 cm to the right. We employed the same SOBI propagation analysis to the 16-channel EGG data to determine the feasibility of using SOBI-EGG to estimate slow wave propagation velocity.
Results
Frequency Analysis
SOBI analysis reduces confounding signals and enhances gastric magnetic field components that can be difficult to identify in the raw data. Raw MGG signals from normal subjects contain respiratory, cardiac, and gastric activity. The signals are mapped to the locations of SQUID sensors with more cephalad traces in the upper part of the array and caudad traces lower in the array.
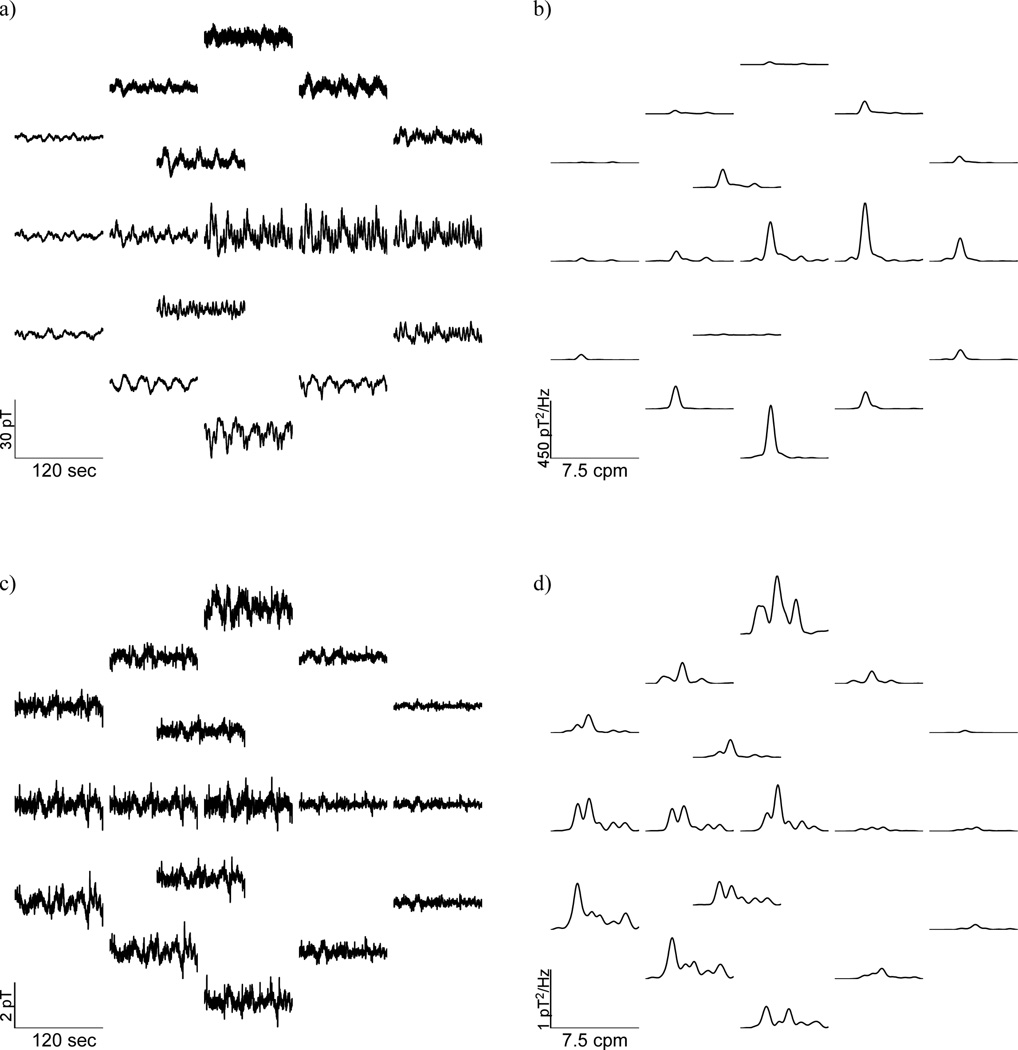
Gastric slow waves were evident in every patient and control subject studied, although patient recordings tended to exhibit lower signal-to-noise ratio. Figure 2 compares SOBI-MGG sensor maps in a typical healthy subject (Figure 2a) and in a patient with gastroparesis (Figure 2c) along with their power spectra. Although sinusoidal activity at gastric frequencies appeared more evident in normal subjects, traces from patients also exhibited oscillatory activity in the gastric frequency range. Data from the normal subjects contain slow wave frequency peaks near 3 cpm. Patient data also show similar slow wave frequency peaks, but confounding noise sources are also evident. The dominant gastric slow wave frequency was not substantially different between controls and patients, but peaks in the power spectra are at lower amplitudes and more disparate frequencies.
Figure 2.
Raw MGG spatial maps recorded from (a) a healthy control subject and (c) a gastroparesis patient with corresponding power spectra (b –control; d – gastroparesis patient).
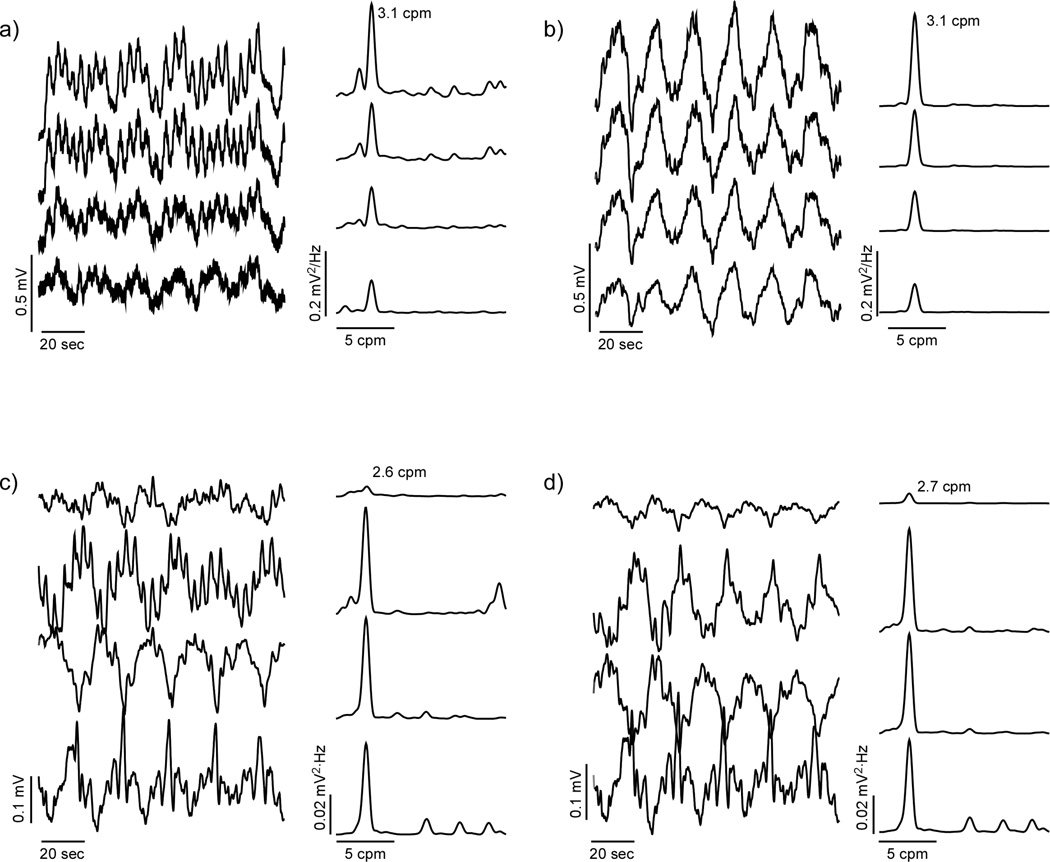
Typical electrogastrogram signals and PSDs from a control and a patient are shown in Figure 3 before (a and c, respectively) and after (b and d, respectively) processing with SOBI. In contrast to the MGG, EGGs from patients do not have as many signal components in the gastric frequency range.
Figure 3.
Four-channel EGG and power spectra from (a) a healthy control subject and (c) a gastroparesis patient are shown with SOBI-reconstructed EGGs (b – control; d – gastroparesis patient).
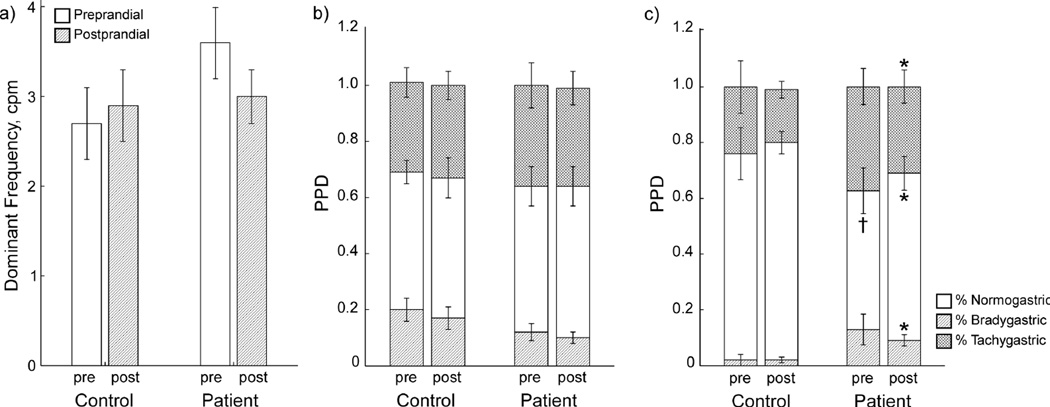
EGG and MGG data were both analyzed for frequency content by (1) examining the dominant frequency recorded and (2) computing the percentage of power distributed in brady-, normo- and tachygastric frequency ranges. Preprandial EGG DFs were 2.7 ± 0.4 cpm for controls and 3.6 ± 0.4 cpm for patients, and postprandial EGG DFs were 2.9 ± 0.4 cpm for controls and 3.0 ± 0.3 cpm for patients. Preprandial MGG DFs were 3.2 ± 0.3 cpm for controls and 3.1 ± 0.6 cpm for patients, while postprandial MGG DFs were 2.8 ± 0.1 cpm for controls and 3.0 ± 0.5 cpm for patients. Neither EGG nor MGG recordings showed significant differences in dominant slow wave frequency pre- or postprandial, nor was there any significant difference between patients and control subjects in terms of dominant slow wave frequency (Figure 4a).
Figure 4.
Frequency analyses from EGG/MGG. (a) Slow wave dominant frequencies determined from MGG and EGG. Gastroparesis patients tend toward higher slow wave frequencies than normal controls, but the difference was not significant. Percent Power Distribution from EGG (b) show no significant differences, but MGG PPDs (c) showed significantly lower normal slow waves and significantly higher brady- and tachygastria in gastroparesis patients compared to normal controls. * indicates significant difference vs. control values (p < 0.05). † indicates borderline significant difference vs. control (p = 0.06).
EGG and MGG PPD profiles are shown in Figure 4b and Figure 4c, respectively. The postprandial MGG PPD reveals statistically significant differences in the power distributed in gastric frequencies. Specifically, there was significantly less power in the MGG normogastric frequency range in patients versus controls, and correspondingly more power in both brady and tachygastric ranges. Preprandial PPD from MGG showed only borderline significant differences in normogastric (p = 0.06) but not tachy- or bradygastric frequency ranges. On the other hand, EGG PPD analysis failed to demonstrate any significant differences between patients and controls. These results suggest that uncoupling associated with gastric dysrhythmias in gastroparesis may be detected by PPD analysis from MGG signals, but not from EGG. No significant differences were observed between pre- and postprandial PPDs.
Propagation Analysis
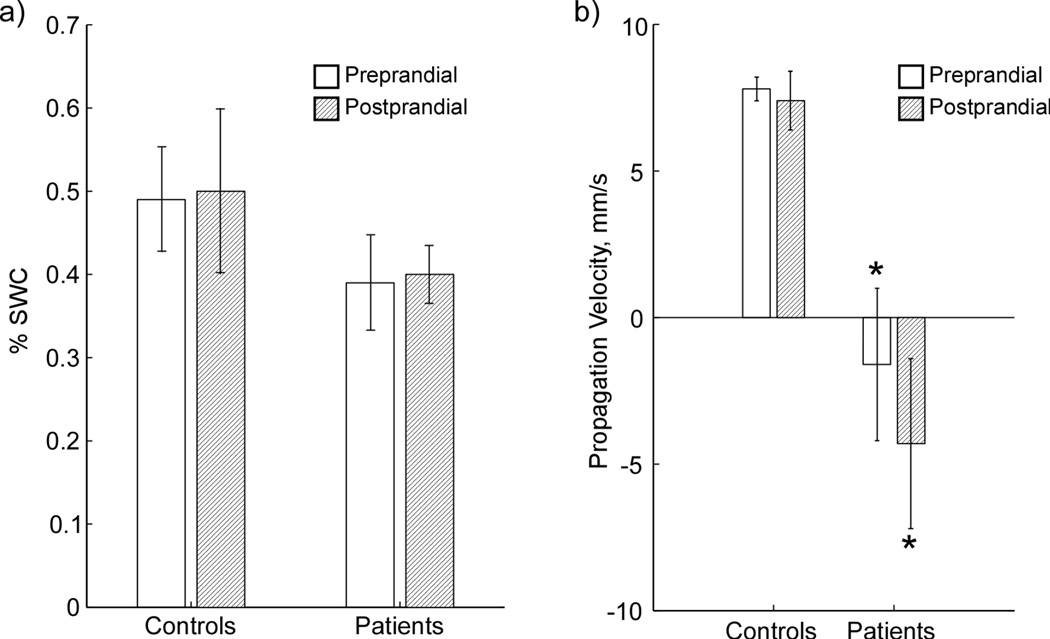
Analysis of propagation in multichannel data requires evidence of phase shifts between data from adjacent sensors. There were no continuous phase shifts observed between adjacent channels in raw or filtered 4-channel EGG data, in agreement with previous studies (24, 25), and this absence of phase shifts prevented computation of propagation velocity from raw or filtered EGG. However, coupling in EGG data can be inferred using %SWC analysis (16), which analyzes the PSD of adjacent EGG channels. In this study, %SWC analysis applied to EGG did not yield a significant difference between patients and controls in preprandial or postprandial data (Figure 5a).
Figure 5.
(a) Percent of Slow Wave Coupling (PSWC) from EGG measurements on normal controls and patients. EGG is able to detect a difference in slow wave coupling for patients, but propagation velocity cannot be determined. (b) Propagation velocity determined from SOBI-MGG for control subjects and gastroparesis patients pre- and postprandial. * indicates significant difference vs. control (p < 0.05).
In previous work, surface current density (SCD) analysis applied to respiration-free MGG segments identified phase shifts and was used to compute propagation velocity. However, that technique was confounded in the present study by the choice to include data segments with respiratory artifact. Propagation analysis with SOBI applied to MGG data did allow identification of propagating wavefronts consistent with the known characteristics of gastric slow wave propagation. The differences between propagation analysis with SOBI and with SCD are enumerated elsewhere (22).
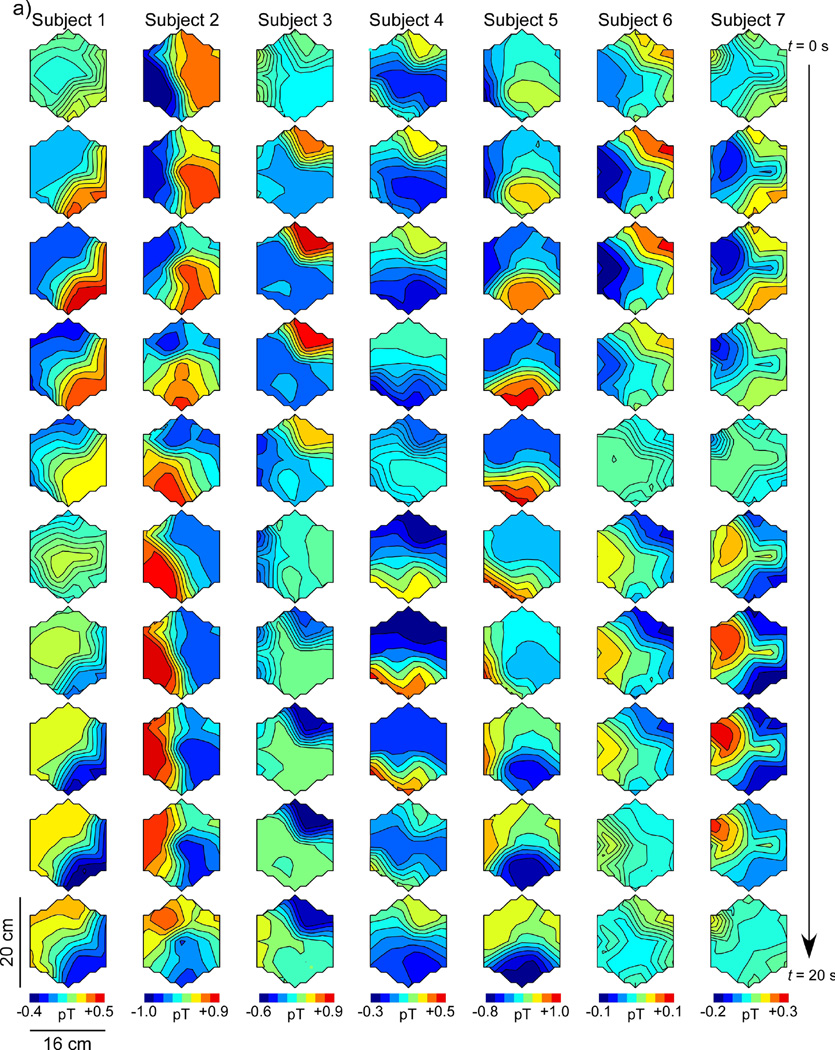
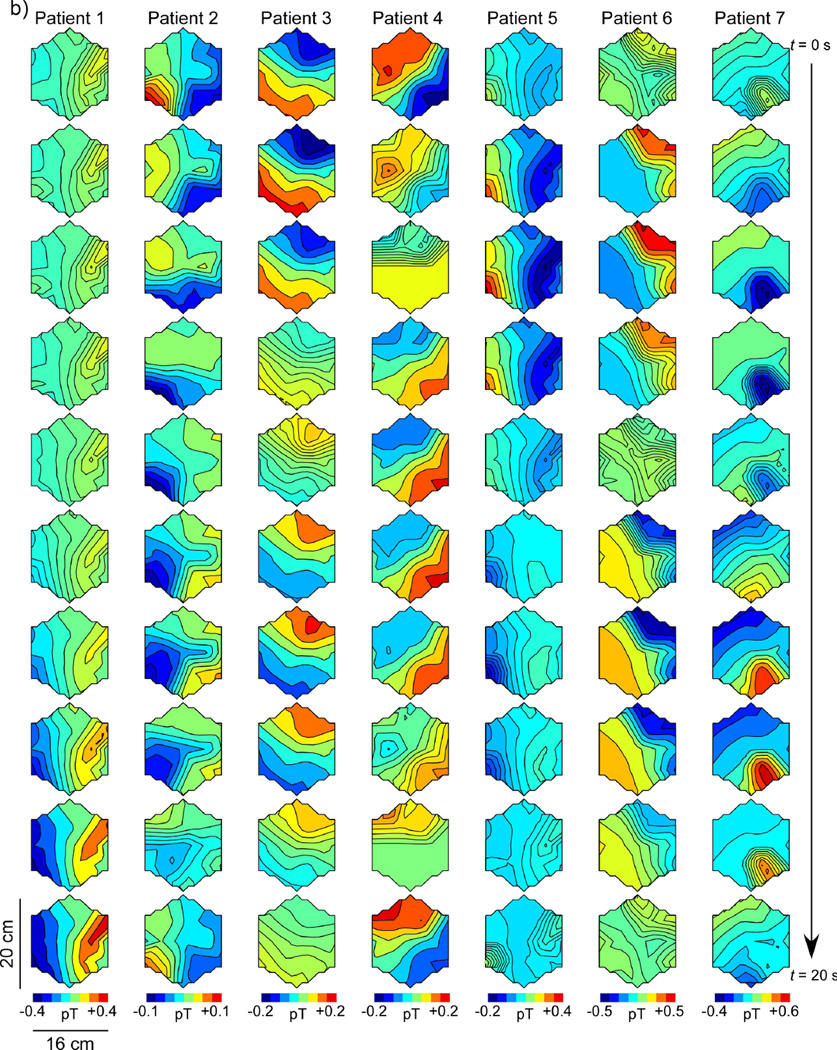
Figure 6 shows SOBI-MGG propagation patterns as maps of MGG amplitude with higher amplitude regions coded to dark shading. Maps at successive time points are plotted sequentially down the page with each column representing a separate subject. The patterns are calibrated so that the first frame has high intensity in the lower right portion of the array, corresponding to the presumed location of the pacemaker region in the stomach. Successive maps shown in this figure are sampled every two seconds, for a complete 20-second slow wave period from the top to the bottom of the figure. Figure 6a shows a representative propagation pattern from each of the seven normal controls and Figure 6b represents data from each of the seven gastroparesis patients.
Figure 6.
Spatiotemporal SOBI-MGG maps from (a) normal control subjects and (b) gastroparesis patients in postprandial periods. Each column shows 10 maps of magnetic field activity at two-second intervals in a single subject. Isocontour lines correspond to magnetic field values reconstructed using SOBI. In healthy controls (a), the magnetic field generally progresses from the subject’s left-to-right across the sensor array, consistent with the known gastric slow wave propagation. By contrast, SOBI-MGG propagation maps from patients (b) were characterized by static or retrograde patterns. Maxima of SOBI-MGG maps were tracked to determine propagation velocities.
MGG propagation patterns in healthy control subjects (Figure 6a) were anterograde, with activity in successive SOBI-MGG maps evidently moving from right to left (subject’s left to right). These wavefront trajectories are consistent with left-to-right slow wave propagation across the abdomen. The average SOBI-MGG propagation velocity was 7.8 ± 0.4 mm/s preprandial and 7.4 ± 1.0 mm/s postprandial in healthy controls (Figure 5b). Propagation patterns and velocities from gastroparesis patients varied widely but on average were retrograde with an average velocity of 1.6 ± 2.6 mm/s preprandial and 4.3 ± 2.9 mm/s, which was significantly different from controls (p < 0.05 preprandial and p < 0.01 postprandial). There was no significant difference between pre- and postprandial propagation velocities in controls (p = 0.7) or patients (p = 0.5). While the predominant pattern observed in patients was retrograde, static patterns were also observed in some patients. Only one patient consistently exhibited normal anterograde propagation (Patient 6 in Figure 6b).
We observed no significant differences in this study between male and female control subjects in either EGG or MGG data parameters analyzed, including frequency (p=0.10 EGG, p=0.18 MGG), propagation velocity (p=0.56), %SWC (p=0.34) or PPD (pEGG = [0.45, 0.67, 0.82] and pMGG = [0.74, 0.72, 0.62] for brady, normo- and tachygastric ranges, respectively).
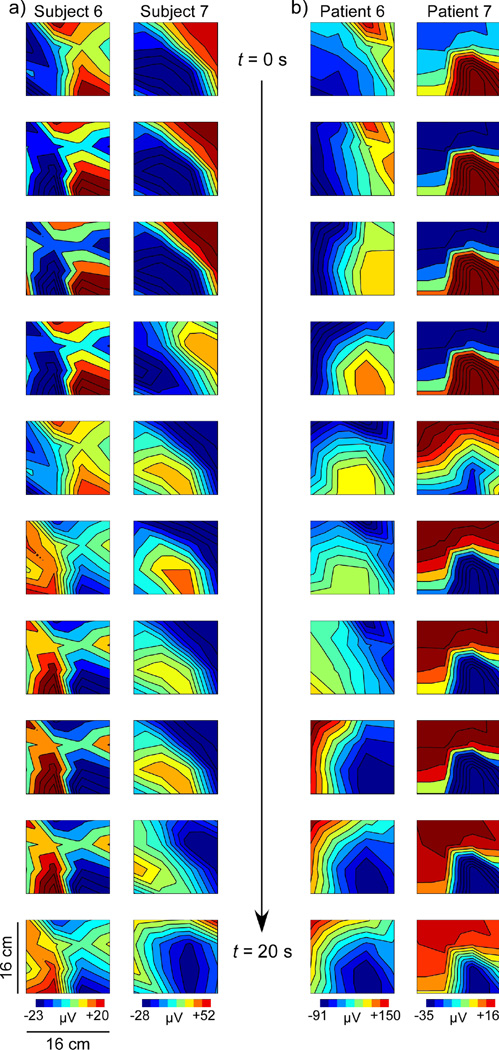
We attempted propagation analysis on SOBI-EGG data using 4-channel EGG. Phase shifts computed from the reconstructed patterns were highly erratic or nonexistent. No significant propagation pattern was observed and the average propagation velocity computed for SOBI-EGG was nonsensical. While SOBI-EGG patterns were somewhat similar to SOBI-MGG, phase shifts tended to be sudden in spatiotemporal data leading to a lower precision when computing propagation velocity. We also obtained 16-channel EGG measurements from two patients and two healthy controls, and postprandial propagation patterns computed from these data are shown in Figure 7. The results for both control subjects (Figure 7a) and one patient (Patient 6 in Figure 7b) showed SOBI-EGG patterns with a sudden phase reversal that could indicate global slow wave propagation but would not allow an accurate computation of propagation velocity. The other patient, however, (Patient 7 in Figure 7b) demonstrated a gradual phase shift consistent with normal slow wave propagation, similar to that observed in MGG propagation maps from healthy control subjects. Propagation velocities determined from these patterns were different from those determined from MGG in the same subjects. For one control subject, the propagation velocity computed from EGG-SOBI was slightly lower (5.8 mm/s vs 8.7 mm/s), but the other control subject showed a higher propagation velocity from SOBI-EGG than from SOBI-MGG (11.5 mm/s vs 5.4 mm/s). The two gastroparesis patients measured exhibited normal anterograde propagation when analyzed with SOBI-EGG at higher-than-average velocities (SOBI-EGG: 10.8 mm/s for Patient 6 and 13.4 mm/s for Patient 7; SOBI-MGG: −7.7 mm/s for Patient 6 and −2.9 mm/s for Patient 7). The extent to which the propagation velocity of these SOBI-EGG patterns relates to underlying slow wave propagation velocity remains to be studied.
Figure 7.
SOBI-EGG propagation maps at 2-second intervals from 16-channel EGG measurements for (a) two normal controls and (b) two gastroparesis patients. The normal subjects and one patient (Patient 6) show pattern variation indicative of phase reversal across the array that could correspond to a propagating slow wave, but would lead to inaccurate propagation velocity estimates. The sudden phase reversal is likely the result of decreased spatial resolution in EGG data. However, Patient 7 shows a regular propagation pattern similar to those observed in the MGG that would allow a more precise estimate of propagation velocity. It remains to be determined whether SOBI-EGG enhances the signal-to-noise ratio sufficiently to provide an accurate characterization of propagation, but these preliminary data are encouraging.
Discussion
Both EGG and MGG reflected gastric slow wave activity in all healthy control subjects, and we saw abnormalities in the slow wave when recording from gastroparesis patients. We found SOBI analysis effective for reducing noise contributions to the magnetic signals from motion artifact and from cardiac and respiratory interference without reducing signal contributions from underlying gastric activity. The dominant frequency from MGG and EGG was consistent with normal 3 cpm gastric slow waves in both control subjects and gastroparesis patients. Previous EGG studies had also found that slow waves in gastroparetic subjects tend to show dominant frequencies around 3 cpm (19, 26, 27), though dysrhythmia and increased tachygastria has been seen (28–30). In this study, we found significant differences in MGG PPDs between controls and patients while EGG PPDs did not show significant differences. We were not able to obtain serum glucose concentrations in patients or control subjects before the EGG/MGG studies, so future studies should address the potential contribution of hyperglycemia to gastric dysrhythmia.
The results of the PPD and propagation analyses suggest that the gastric syncytium is uncoupled in gastroparesis patients, although the EGG did not demonstrate a clear decrease in the percentage of slow wave coupling (%SWC). The use of the standard four electrodes provided a lower spatial sampling for EGG in five of our patients and it is possible that increasing the EGG array density could provide a more sensitive measure of uncoupling using %SWC, one potential explanation for the discrepancy between our results and those of previous studies (16). We defined the range of gastric frequencies more broadly than other studies (1–9 cpm) to ensure capture of any tachygastric signal, but defining a narrower range could improve results.
Uncoupling in the MGG is reflected in the PPD differences, but also in the analysis of propagation differences. The average value we calculated for the propagation velocity from normal controls was consistent with slow wave propagation velocities reported previously using serosal electrodes (2). In that study, O’Grady and colleagues determined a distinct gradient in propagation velocity; slow waves propagated at 8.0 mm/s in the pacemaker region, decelerating to 3.0 mm/s in the corpus and terminating in the antrum after again accelerating to 5.9 mm/s. Interestingly, a study using MRI found a contractile velocity closer to the lower value measured in the corpus by O’Grady and colleagues (31), which supports the relation of MGG to underlying electrical rather than mechanical events. The data from our magnetometer array allowed only a single global estimate of propagation velocity, but an MGG sensor array with a larger density of channels could provide for an estimate of the velocity gradient. Gastroparesis patients exhibited a wide variation in propagation velocities.
MGG spatiotemporal patterns in gastroparesis patients also exhibited deviations from the normal left-to-right anterograde patterns we saw in control subjects. We observed patterns in some patients that appeared to propagate from right-to-left, consistent with retrograde slow wave propagation. Similar results have been reported from invasive serosal electrode measurements (7). We also observed static field patterns that would oscillate with a normal slow wave frequency but with no change in location and so no evident propagation. These several different types of patterns occurred in patients while control subjects generally showed consistent left-right propagation. Nevertheless, the statistical power of this study is not sufficient to establish whether specific patterns match particular pathologies. More studies are needed to establish whether these different patterns are characteristic of particular severity levels or types of gastroparesis. Several studies suggest that disease etiology of gastroparesis varies between idiopathic and diabetic gastroparesis (32, 33). Furthermore, patients with functional dyspepsia and chronic unexplained nausea and vomiting have similar symptom presentation (34), but distinct underlying pathophysiology may well result in specific MGG slow wave pattern changes that could be assessed noninvasively with multichannel EGG or MGG (35–39).
It is important to consider that propagation determined from MGG slow wave patterns can only be assessed reliably if the SQUID data contain at least two SOBI components that are within the gastric frequency range and are sinusoidally rhythmic. Deviations from sinusoidal rhythmicity caused by motion or biological or ambient magnetic artifact could introduce spurious signals that might disrupt the characterization of normal left-right propagation. It should be noted that previous research has demonstrated multiple slow waves present simultaneously in serosal electrode recordings. Generally, SOBI-MGG maps in this study appeared to track one slow wave across the sensor array, although several map sequences appear to show a new slow wave originating in the pacing region before the previous wave terminates in the pylorus (Subjects 4, 6 and 7 in Figure 6a and Patients 5, 6 and 7 in Figure 6b). The apparent inconsistency in results could be explained by the summative integration of slow waves from distinct gastric regions and/or from an inadvertent introduction of ectopic pacemakers following surgical intervention or tissue manipulation. Because the magnetic field detected in a single sensor is the spatial summation of magnetic fields from currents across the musculature, it is difficult to ascertain whether retrograde and static abnormalities in propagation patterns reflect individual slow waves or the summed activity of uncoupled gastric regions. An inverse analysis that uses combined EGG/MGG data with anatomical imaging could address such questions.
The analysis procedure to compute frequency and PPD is entirely automated and requires no intervention by the researcher. The procedure for computing propagation velocities is not entirely automated at present; the investigator is required to manually enter SOBI components identified as primarily sinusoidal with peaks in the gastric frequency range and to manually select the position of pattern maxima. Although these procedures could be automated with more sophisticated software development and the intervention by the investigator at these analysis points is minimal, we used blinded researchers to perform these analyses and minimize any potential introduction of bias.
It is difficult to conclude from this study alone the degree to which EGG and MGG reflect underlying electrical and/or mechanical activity as it was not feasible for us to record with invasive internal serosal or mucosal electrodes or force transducers. However, previous studies have established that the MGG correlates highly with serosal slow wave activity in animal subjects (40), while a much more complicated relationship exists between EGG/MGG and intraluminal pressure in humans (41). These results suggest that potentials recorded in the EGG and magnetic fields recorded by the MGG arise from slow wave electrical activity. Though there is still some apparent confusion regarding the nature and origin of electrically-recorded slow waves (42, 43), it seems likely that magnetic recording methods will contribute substantially to the resolution of these questions. The differences we observed in propagation determined by EGG versus MGG might suggest that the modalities contain different levels of electrical and mechanical activity, but more study is needed to quantify the relative degree of those contributions.
Our patient population was entirely female, consistent with the known overrepresentation of gastroparesis in women (44, 45). Although the sex of our control subjects was mixed, we did not observe any differences between normal male and female subjects.
The spatial sampling of EGG used in this study, though consistent with clinical practice (16), was not on equal footing with MGG, with only four EGG electrodes compared to 17 MGG sensors. When we increased the spatial sampling resolution of the EGG to 16 electrodes, the results were inconclusive, but interesting. In the normal subjects, no clear propagation pattern could be discerned and propagation velocity was not related to MGG. In one of the two patients, however, analysis of EGG propagation using SOBI did yield patterns consistent with slow wave propagation, although the SOBI-EGG propagation velocity estimates were higher than those determined by SOBI-MGG. While the small sample size does not allow us to draw any conclusions about the efficacy of SOBI for determining propagation from EGG data, the fact that patients and not normal subjects demonstrate consistent propagation patterns suggests that further study is necessary to conclude the extent to which pattern differences in SOBI-EGG and SOBI-MGG reflect relative bioelectrical and biomechanical contributions to electrode signals.
This study shows that SQUID magnetometers can identify pathophysiology in gastric slow waves characteristic of gastroparesis. Although both EGG and MGG assess temporal frequency components, the measurement of propagation velocity and propagation patterns is unique to magnetic measurement techniques; no study has yet reported EGG propagation velocities consistent with serosal slow wave activity. Propagation patterns from MGG may provide critical distinction and characterization of specific pathologies.
Key Messages.
The multichannel electrogastrogram and magnetogastrogram were measured in seven healthy control subjects and in seven patients with diabetic gastroparesis.
Gastric slow wave characteristics of dominant frequency (DF), percent power distribution (PPD) and propagation were determined from EGG and MGG.
Propagation patterns in gastroparesis patients were static or retrograde and propagation velocity was significantly different. PPD analysis suggested syncytial uncoupling of the gastric musculature.
Gastric slow wave propagation and uncoupling determined from the MGG distinguished gastroparesis patients from healthy controls.
Acknowledgments
The authors gratefully acknowledge the assistance of the Vanderbilt Institute for Clinical and Translational Research. This research is supported in part by grants from the National Institutes of Health (NIH R01 DK58697 and NIH R01 DK64775).
Grant Support: NIH R01 DK05697
Footnotes
Abbreviations: EGG, MGG, SQUID, PPD, %SWC, SOBI, FFT
Author Contributions:
LAB designed and conducted experiments, analyzed data, and drafted and revised the manuscript.
LKC analyzed data and revised the manuscript.
EJC conducted experiments and analyzed data.
CKO conducted experiments and analyzed data.
JCE participated in data analysis and manuscript revision.
BNG participated in data analysis.
SS analyzed data and revised the manuscript.
WOR designed and conducted experiments, interpreted analyzed data and revised the manuscript.
Clinical Trial Registry: NCT00178984
No author has any known potential financial, professional or personal conflict to disclose.
References
- 1.Lammers WJ, Ver DL, Stephen B, Smets D, Schuurkes JA. Origin and propagation of the slow wave in the canine stomach: the outlines of a gastric conduction system. Am J Physiol GastrointestLiver Physiol. 2009;296(6):G1200–G1210. doi: 10.1152/ajpgi.90581.2008. [DOI] [PubMed] [Google Scholar]
- 2.O'Grady G, Du P, Cheng LK, Egbuji JU, Lammers WJ, Windsor JA, et al. Origin and propagation of human gastric slow-wave activity defined by high-resolution mapping. Am J Physiol Gastrointest Liver Physiol. 2010;299(3):G585–G592. doi: 10.1152/ajpgi.00125.2010. [DOI] [PMC free article] [PubMed] [Google Scholar]
- 3.Chen J, McCallum RW, Richards R. Frequency components of the electrogastrogram and their correlations with gastrointestinal contractions in humans. Medical & biological engineering & computing. 1993;31(1):60–67. doi: 10.1007/BF02446895. [DOI] [PubMed] [Google Scholar]
- 4.Chen J, McCallum RW. Gastric slow wave abnormalities in patients with gastroparesis. The American journal of gastroenterology. 1992;87(4):477–482. [PubMed] [Google Scholar]
- 5.Hasler WL, Soudah HC, Dulai G, Owyang C. Mediation of hyperglycemia-evoked gastric slow-wave dysrhythmias by endogenous prostaglandins. Gastroenterology. 1995;108(3):727–736. doi: 10.1016/0016-5085(95)90445-x. [DOI] [PubMed] [Google Scholar]
- 6.Koch KL. Gastric dysrhythmias and the current status of electrogastrography. Practical gastroenterology. 1989;13(4):37, 41–44. [PubMed] [Google Scholar]
- 7.O'Grady G, Angeli TR, Du P, Lahr C, Lammers WJ, Windsor JA, et al. Abnormal initiation and conduction of slow-wave activity in gastroparesis, defined by high-resolution electrical mapping. Gastroenterology. 2012;143(3):589–598. e1–e3. doi: 10.1053/j.gastro.2012.05.036. [DOI] [PMC free article] [PubMed] [Google Scholar]
- 8.Alvarez WC, Mahoney LJ. Action Currents in Stomach and Intestine. Am J Physiol. 1922;58(3):476–493. [Google Scholar]
- 9.Bradshaw LA, Richards WO, Wikswo JP., Jr Volume conductor effects on the spatial resolution of magnetic fields and electric potentials from gastrointestinal electrical activity. Med Biol Eng Comput. 2001;39(1):35–43. doi: 10.1007/BF02345264. [DOI] [PubMed] [Google Scholar]
- 10.Mintchev MP, Kingma YJ, Bowes KL. Accuracy of cutaneous recordings of gastric electrical activity. Gastroenterology. 1993;104(5):1273–1280. doi: 10.1016/0016-5085(93)90334-9. [DOI] [PubMed] [Google Scholar]
- 11.Mintchev MP, Stickel A, Otto SJ, Bowes KL. Reliability of percent distribution of power of the electrogastrogram in recognizing gastric electrical uncoupling. IEEE Trans Biomed Eng. 1997;44(12):1288–1291. doi: 10.1109/10.650001. [DOI] [PubMed] [Google Scholar]
- 12.Parkman HP, Harris AD, Miller MA, Fisher RS. Influence of age, gender, and menstrual cycle on the normal electrogastrogram. Am J Gastroenterol. 1996;91(1):127–133. [PubMed] [Google Scholar]
- 13.Simonian HP, Panganamamula K, Parkman HP, Xu X, Chen JZ, Lindberg G, et al. Multichannel electrogastrography (EGG) in normal subjects: a multicenter study. Dig Dis Sci. 2004;49(4):594–601. doi: 10.1023/b:ddas.0000026304.83214.50. [DOI] [PubMed] [Google Scholar]
- 14.Mazur M, Furgala A, Jablonski K, Madroszkiewicz D, Ciecko-Michalska I, Bugajski A, et al. Dysfunction of the autonomic nervous system activity is responsible for gastric myoelectric disturbances in the irritable bowel syndrome patients. J Physiol Pharmacol. 2007;58(Suppl 3):131–139. [PubMed] [Google Scholar]
- 15.Murakami H, Matsumoto H, Kubota H, Higashida M, Nakamura M, Hirai T. Evaluation of electrical activity after vagus nerve-preserving distal gastrectomy using multichannel electrogastrography. Journal of smooth muscle research = Nihon Heikatsukin Gakkai kikanshi. 2013;49:1–14. doi: 10.1540/jsmr.49.1. [DOI] [PMC free article] [PubMed] [Google Scholar]
- 16.Krusiec-Swidergol B, Jonderko K. Multichannel electrogastrography under a magnifying glass--an in-depth study on reproducibility of fed state electrogastrograms. Neurogastroenterol Motil. 2008;20(6):625–634. doi: 10.1111/j.1365-2982.2008.01087.x. [DOI] [PubMed] [Google Scholar]
- 17.Somarajan S, Muszynski ND, Obioha C, Richards WO, Bradshaw LA. Biomagnetic and bioelectric detection of gastric slow wave activity in normal human subjects--a correlation study. Physiological measurement. 2012;33(7):1171–1179. doi: 10.1088/0967-3334/33/7/1171. [DOI] [PMC free article] [PubMed] [Google Scholar]
- 18.Bradshaw LA, Irimia A, Sims JA, Richards WO. Biomagnetic signatures of uncoupled gastric musculature. Neurogastroenterol Motil. 2009 doi: 10.1111/j.1365-2982.2009.01265.x. [DOI] [PMC free article] [PubMed] [Google Scholar]
- 19.Wang ZS, Elsenbruch S, Orr WC, Chen JD. Detection of gastric slow wave uncoupling from multi-channel electrogastrogram: validations and applications. Neurogastroenterol Motil. 2003;15(5):457–465. doi: 10.1046/j.1365-2982.2003.00430.x. [DOI] [PubMed] [Google Scholar]
- 20.Erickson JC, Obioha C, Goodale A, Bradshaw LA, Richards WO. Detection of small bowel slow-wave frequencies from noninvasive biomagnetic measurements. IEEE Trans Biomed Eng. 2009;56(9):2181–2189. doi: 10.1109/TBME.2009.2024087. [DOI] [PMC free article] [PubMed] [Google Scholar]
- 21.Irimia A, Richards WO, Bradshaw LA. Comparison of conventional filtering and independent component analysis for artifact reduction in simultaneous gastric EMG and magnetogastrography from porcines. IEEE Trans Biomed Eng. 2009;56(11):2611–2618. doi: 10.1109/TBME.2009.2020694. [DOI] [PMC free article] [PubMed] [Google Scholar]
- 22.Bradshaw LA, Kim JH, Cassilly S, Somarajan S, Richards WO, Cheng LK. Characterization of electrophysiological propagation from multichannel sensors. Submitted. 2014 doi: 10.1109/TBME.2015.2502065. [DOI] [PMC free article] [PubMed] [Google Scholar]
- 23.Paskaranandavadivel N, O'Grady G, Du P, L KC. Comparison of filtering methods for extracellular gastric slow wave recordings. Neurogastroenterology and motility : the official journal of the European Gastrointestinal Motility Society. 2013;25(1):79–83. doi: 10.1111/nmo.12012. [DOI] [PMC free article] [PubMed] [Google Scholar]
- 24.Chen JD, Zou X, Lin X, Ouyang S, Liang J. Detection of gastric slow wave propagation from the cutaneous electrogastrogram. Am J Physiol. 1999;277(2 Pt 1):G424–G430. doi: 10.1152/ajpgi.1999.277.2.G424. [DOI] [PubMed] [Google Scholar]
- 25.Familoni BO, Abell TL, Bowes KL. A model of gastric electrical activity in health and disease. IEEE Trans Biomed Eng. 1995;42(7):647–657. doi: 10.1109/10.391163. [DOI] [PubMed] [Google Scholar]
- 26.Abid S, Lindberg G. Electrogastrography: poor correlation with antro-duodenal manometry and doubtful clinical usefulness in adults. World J Gastroenterol. 2007;13(38):5101–5107. doi: 10.3748/wjg.v13.i38.5101. [DOI] [PMC free article] [PubMed] [Google Scholar]
- 27.Mintchev MP, Bowes KL. Do increased electrogastrographic frequencies always correspond to internal tachygastria? Ann Biomed Eng. 1997;25(6):1052–1058. [PubMed] [Google Scholar]
- 28.Kim JH, Pullan AJ, Bradshaw LA, Cheng LK. Influence of body parameters on gastric bioelectric and biomagnetic fields in a realistic volume conductor. Physiological measurement. 2012;33(4):545–556. doi: 10.1088/0967-3334/33/4/545. [DOI] [PMC free article] [PubMed] [Google Scholar]
- 29.Kothapalli B. Electrogastrogram simulation using a three-dimensional model. Medical & biological engineering & computing. 1993;31(5):482–486. doi: 10.1007/BF02441983. [DOI] [PubMed] [Google Scholar]
- 30.Mathur R, Pimentel M, Sam CL, Chen JD, Bonorris GG, Barnett PS, et al. Postprandial improvement of gastric dysrhythmias in patients with type II diabetes: identification of responders and nonresponders. Dig Dis Sci. 2001;46(4):705–712. doi: 10.1023/a:1010736528276. [DOI] [PubMed] [Google Scholar]
- 31.Bharucha AE, Manduca A, Lake DS, Fidler J, Edwards P, Grimm RC, et al. Gastric motor disturbances in patients with idiopathic rapid gastric emptying. Neurogastroenterology and motility : the official journal of the European Gastrointestinal Motility Society. 2011;23(7):617–e252. doi: 10.1111/j.1365-2982.2011.01710.x. [DOI] [PMC free article] [PubMed] [Google Scholar]
- 32.Parkman HP, Yates K, Hasler WL, Nguyen L, Pasricha PJ, Snape WJ, et al. Similarities and differences between diabetic and idiopathic gastroparesis. Clinical gastroenterology and hepatology : the official clinical practice journal of the American Gastroenterological Association. 2011;9(12):1056–1064. doi: 10.1016/j.cgh.2011.08.013. quiz e133–4. [DOI] [PMC free article] [PubMed] [Google Scholar]
- 33.Grover M, Farrugia G, Lurken MS, Bernard CE, Faussone-Pellegrini MS, Smyrk TC, et al. Cellular changes in diabetic and idiopathic gastroparesis. Gastroenterology. 2011;140(5):1575–1585. e8. doi: 10.1053/j.gastro.2011.01.046. [DOI] [PMC free article] [PubMed] [Google Scholar]
- 34.Angeli TR, Cheng LK, Du P, Wang TH, Bernard CE, Vannucchi MG, et al. Loss of Interstitial Cells of Cajal and Patterns of Gastric Dysrhythmia in Patients With Chronic Unexplained Nausea and Vomiting. Gastroenterology. 2015;149(1):56–66. e5. doi: 10.1053/j.gastro.2015.04.003. [DOI] [PMC free article] [PubMed] [Google Scholar]
- 35.Geldof H, van der Schee EJ, van BM, Grashuis JL. Electrogastrographic study of gastric myoelectrical activity in patients with unexplained nausea and vomiting. Gut. 1986;27(7):799–808. doi: 10.1136/gut.27.7.799. [DOI] [PMC free article] [PubMed] [Google Scholar]
- 36.You CH, Chey WY, Lee KY, Menguy R, Bortoff A. Gastric and small intestinal myoelectric dysrhythmia associated with chronic intractable nausea and vomiting. Annals of internal medicine. 1981;95(4):449–451. doi: 10.7326/0003-4819-95-4-449. [DOI] [PubMed] [Google Scholar]
- 37.Camilleri M. Functional dyspepsia: mechanisms of symptom generation and appropriate management of patients. Gastroenterology clinics of North America. 2007;36(3):649–664. xi–x. doi: 10.1016/j.gtc.2007.07.001. [DOI] [PubMed] [Google Scholar]
- 38.Lacy BE. Functional dyspepsia and gastroparesis: one disease or two? The American journal of gastroenterology. 2012;107(11):1615–1620. doi: 10.1038/ajg.2012.104. [DOI] [PubMed] [Google Scholar]
- 39.Pasricha PJ, Colvin R, Yates K, Hasler WL, Abell TL, Unalp-Arida A, et al. Characteristics of patients with chronic unexplained nausea and vomiting and normal gastric emptying. Clinical gastroenterology and hepatology : the official clinical practice journal of the American Gastroenterological Association. 2011;9(7):567–576. e1–e4. doi: 10.1016/j.cgh.2011.03.003. [DOI] [PMC free article] [PubMed] [Google Scholar]
- 40.Bradshaw LA, Allos SH, Wikswo JP, Jr, Richards WO. Correlation and comparison of magnetic and electric detection of small intestinal electrical activity. Am J Physiol. 1997;272(5 Pt 1):G1159–G1167. doi: 10.1152/ajpgi.1997.272.5.G1159. [DOI] [PubMed] [Google Scholar]
- 41.Bradshaw LA, Irimia A, Sims JA, Gallucci MR, Palmer RL, Richards WO. Biomagnetic characterization of spatiotemporal parameters of the gastric slow wave. Neurogastroenterol Motil. 2006;18(8):619–631. doi: 10.1111/j.1365-2982.2006.00794.x. [DOI] [PubMed] [Google Scholar]
- 42.Bayguinov O, Hennig GW, Sanders KM. Movement based artifacts may contaminate extracellular electrical recordings from GI muscles. Neurogastroenterol Motil. 2011;23(11):1029–1042. e498. doi: 10.1111/j.1365-2982.2011.01784.x. [DOI] [PMC free article] [PubMed] [Google Scholar]
- 43.O'Grady G. Gastrointestinal extracellular electrical recordings: fact or artifact? Neurogastroenterol Motil. 2012;24(1):1–6. doi: 10.1111/j.1365-2982.2011.01815.x. [DOI] [PMC free article] [PubMed] [Google Scholar]
- 44.Parkman HP, Yates K, Hasler WL, Nguyen L, Pasricha PJ, Snape WJ, et al. Clinical features of idiopathic gastroparesis vary with sex, body mass, symptom onset, delay in gastric emptying, and gastroparesis severity. Gastroenterology. 2011;140(1):101–115. doi: 10.1053/j.gastro.2010.10.015. [DOI] [PMC free article] [PubMed] [Google Scholar]
- 45.Dudekula A, Rahim S, Bielefeldt K. Time trends in gastroparesis treatment. Digestive diseases and sciences. 2014;59(11):2656–2665. doi: 10.1007/s10620-014-3369-y. [DOI] [PubMed] [Google Scholar]


