

Abstract
Genome assembly in its two decades of history has produced significant research, in terms of both biotechnology and computational biology. This contribution delineates sequencing platforms and their characteristics, examines key steps involved in filtering and processing raw data, explains assembly frameworks, and discusses quality statistics for the assessment of the assembled sequence. Furthermore, the paper explores recent Ubuntu-based software environments oriented towards genome assembly as well as some avenues for future research.
1. Introduction
Genome assembly involves taking smaller fragments, called “reads,” and assembling them together to form a cohesive unit, called the “sequence.” However, simply assembling all the reads into one contiguous sequence, a “contig,” is not enough. One has to ensure that the assembled sequence does indeed resemble what is truly present in the cell. Some common hurdles are low coverage areas, false positive read-read alignments, false negative alignments, poor sequence quality, polymorphism, and repeated regions of the genome. An even more fundamental concern lies in the difficulty of determining which of the two strands was finally reported in the sequencing procedure. Moreover, as a number of research domains draw suitable conclusions from the sequence itself, a sequence that has not been reported accurately may potentially affect subsequent analyses [1].
Sanger's deoxydinucleotide sequencing with large and accurate reads opened the door to whole-genome sequencing and deciphered the first human genome in 2001 [2, 3]. Sanger's approach is still commercially available with improved capillary electrophoresis, enhanced speed and accuracy, and longer read lengths. NIH's $1,000 genome project led researchers to develop efficient, economical, and high-throughput sequencing platforms introducing a new paradigm called next-generation sequencing (NGS). For instance, Roche's 454 GS, Illumina's MiSeq and HiSeq, ABI's SOLiD, and Life Technologies' Ion Torrent and Proton Torrent platforms all sequence the same genome at a fraction of the time and cost of the first-generation sequencing methods [4].
NGS platforms now produce terabytes of data thereby challenging traditional software tools and hardware architectures which were not designed to process such large amounts of data. This triggered a need to develop algorithms and statistical tools with improved memory management and time complexity in parallel to the development of NGS platforms.
This contribution is intended to act as an introductory note to scientists and researchers working in the area of genome assembly. Section 2 provides an overview of NGS platforms. Section 3 discusses raw data, Sequencing Read Archive, and FASTA and FASTQ file formats. It provides particulars on filtering and correcting raw data. Additionally, the second section enforces the need to report accurate results. Section 4 supplies necessary answers addressing the draft assembly process. Section 5 reviews common metrics employed to evaluate the assembly and Section 6 highlights recent software environments oriented towards NGS. Finally, Section 7 projects considerations on possible future research trends.
2. Overview of Next-Generation Sequencing Platforms
Among NGS platforms, Roche's 454 sequencing is based on Nyren's pyrosequencing approach [5]. Roche's approach, referred to as “sequencing by synthesis” (SS), takes one DNA strand as a template and then uses it to synthesize the sequence of its complementary strand. Roche's SS uses four polymerase enzymes to extend several DNA strands in parallel. Whenever a nucleotide attaches itself onto template DNA, a pyrophosphate molecule is produced which emits light when triggered [6]. The bioluminescence produced by these bases helps in recognizing the bases and, therefore, the sequence. Some characteristics of Roche sequencing include its automated procedures and high speed, while some drawbacks are lower read accuracy for homopolymer segments of identical bases and relatively high operating costs [7].
Illumina, another NGS company, differs from Sanger in several features. Sanger's approach uses dideoxynucleotide for irreversible termination of primer extension, whereas Illumina employs reversible terminators for primer extension of the complementary strand. Illumina's 3-O-azidomethyl reversible terminators are tagged with four different colored fluorophores to distinguish between the four nucleotides. Therefore, using these reversible terminators aids in observing the identity of the nucleotides as they attach onto the DNA fragment because the fluorophores are detected by highly sensitive CCD cameras [8]. Illumina's method significantly reduces the duration of sequencing and assumes a $1000 price tag for 30× human genome. Illumina's sequencing scheme shows some benefits over Roche's pyrosequencing; however, its characteristic short read lengths (<300 bp) present challenges when resolving short sequence repeats.
In addition to Roche and Illumina, Applied Biosystems' SOLiD sequencer is another key player among genome sequencers. SOLiD uses the principle of “sequencing by ligation” (SL). SL differs from Illumina in its method for ligation of octamer oligonucleotides. SL uses dibase fluorescent labeled octaoligonucleotide adaptors which link the template DNA and are bound with 1 µm magnetic beads [9]. At each step, SOLiD's technique encrypts two bases simultaneously and every nucleotide is cross-examined twice: first as the right nucleotide of a pair and then as the left one. This approach reduces homopolymeric sequencing errors. However, similar to Illumina, SOLiD generates short read length data which incur complications in the sequence assembly.
Collectively, these high-throughput sequencers have substantially reduced the cost (≤$0.1/Mb) and duration of genome sequencing. However, additional technologies with enhanced performance have been proposed recently. The advent of nonoptic, semiconductor-based genome sequencers has shown potential. Manufacturers like Life Technologies developed Ion Proton and Ion PGM, both of which use SS amplification and hydrogen ion sensing semiconductors [10]. The sequence is obtained by sensing hydrogen ions emitted when nucleotides incorporate themselves onto template DNA, a process catalyzed by DNA polymerase. Massively parallel transistor-based integrated circuits with about two million wells allow simultaneous detection of multiple reactions. Furthermore, signal processing tools translate voltage fluctuations into base calls for successive nucleotides [10].
Another technique which has been recently proposed is the single-molecule real-time (SMRT) sequencing, introduced by HeliScope [11]. SMRT sequencing scheme is free of library preparation or amplification errors. PacBio RS II (by HeliScope) utilizes SMRT sequencing and can produce about 50,000 reads ranging from 15,000 to 40,000 bases in length in just three hours. The extended read length facilitates sequence alignment and improves precision in drafting an assembly, simply because long repetitive DNA fragments can be easily spanned. Interestingly, Roche will be phasing out its in-house 454 sequencers in 2016 in favor of PacBio's SMRT sequencers. Roche plans to maintain its participation in NGS market, not by developing its own sequencers, but rather by becoming an exclusive seller for in vitro diagnostic products based on PacBio's SMRT sequencing platform (http://www.bio-itworld.com/BioIT_Article.aspx?id=131053, accessed on Dec. 12, 2015). Together with nonoptic semiconductor nanopore technology, SMRT sequencers are referred to as “third-generation-sequencers” [12–14]. Overall, the above-mentioned high-throughput sequencers have substantially reduced the duration and cost of sequencing ($0.1/Mb).
Companies are investing significant resources to upgrade existing technologies and introduce newer machines. It is hoped that many third-generation-sequencers are expected to surface, coupling SMRT sequencing with principles of electrothermodynamics, quantum physics, and nanopore technology [13–15]. Existing platforms are currently designed to cater for de novo synthesis, wholegenome/whole-exome and transcriptome synthesis, targeted resequencing, RNA profile ChIP-Seq, mutation detection, and metagenomics. Platforms are usually accompanied by bioinformatics tools. Tables 1, 2, and 3 present some important details about current sequencers.
Table 1.
Comparison of current (as of Nov. 15, 2014) sequencing platforms. PCR: polymerase chain reaction, SS: sequencing by synthesis, SL: sequencing by ligation, SH: sequencing by hybridization, and SE: sequencing by expansion.
| Platform | Biochemistry/ biotechnology |
Amplification | Throughput | Reads per run | Read length (bp) | Seq run time | Error rate (%) | Machine cost ×1000 | Cost per run | Cost per unit data |
|---|---|---|---|---|---|---|---|---|---|---|
| Sanger (Applied Biosystems 3730xl) | Dideoxynucleotide termination of PCR | PCR | 0.06 Mb | 9600 | 1000 | 2 hrs | 0.1 | $100 | $100 | $8,000–$10,000/Gb |
|
| ||||||||||
| 454 GS+ | Bioluminescence on nucleotide incorporation | Emulsion PCR | ~70 Mb | 70 k~100 k | ~700 | 18 hours | <1.0 | $125 | $1,000 | $28.50/Gb |
|
| ||||||||||
| 454 GS FLX+ | Bioluminescence on nucleotide incorporation | Emulsion PCR | 700 Mb | 1 M | ~1000 | 23 hours | <1.0 | $500 | $6,000 | $8.50/Gb |
|
| ||||||||||
| MiSeq | Cleavage of 3′-O-azidomethyl reversible terminator and fluorescent tag on nucleotide incorporation | SS | 15 Gb | 25 M | 2W300 | 5~55 hrs | 0.1 | $125 | $1.4K | $93/Gb |
|
| ||||||||||
| HiSeq X Ten | Cleavage of 3′-O-azidomethyl reversible terminator and fluorescent tag on nucleotide incorporation | SS | 1000 Gb | 4000 M | 2W125 | 7 hrs~6 d | 0.1 | $1,000 | $12K | $7/Gb |
|
| ||||||||||
| NextSeq 500 | Cleavage of 3′-O-azidomethyl reversible terminator and fluorescent tag on nucleotide incorporation | SS | 129 Gb | 400 M | 2W150 | 26~29 hrs | 0.1 | $250 | $4K | $33/Gb |
|
| ||||||||||
| SOLiD 5500xl | Ligation of octamer oligonucleotide and cleavage of fluorescent tag | SL | 180 Gb | 2.8 B | 2W60 | 150 hrs | 0.01 | $595 | $10K | $9/Gb |
|
| ||||||||||
| Ion Proton I | Proton sensing by pH change | SS | 10 Gb | 40~80 M | 200 | 2~4 hrs | 1.0 | $149 | $1K | $100/Gb |
|
| ||||||||||
| Ion PGM 318 | Proton sensing by pH change | SS | 2 Gb | 5 M | 400 | 7.3 hrs | 1.0 | $52 | $750 | $350/Gb |
|
| ||||||||||
| Polonator G.007 | Cleavage of 3′-ONH2 reversible terminator and fluorescent tag on nucleotide incorporation | SL | 10 Gb | — | 26 | — | N.A | N.A | N.A | N.A |
|
| ||||||||||
| Helicos HeliScope | Single-molecule real-time sequencing | SS | 35 Gb | 20 M | 35 | 8 hrs | 0.5 | $1,000 | $10K | $330/Gb |
|
| ||||||||||
| PacBio RS II | Single-molecule real-time sequencing | SS | 1 Gb | 50,000 | 15,000 bp | 3 hrs | 15 | $700 | $400 | ~$1000/Gb |
Table 2.
The table enlists the strong points and challenges pertaining to some of the sequencing platforms.
| Platform | Positive points | Challenges |
|---|---|---|
| Sanger (Applied Biosystems 3730xl) | Long read length; good for individual gene analysis | Slow; expensive; poor quality due to primer dimer |
|
| ||
| 454 GS+ | Long read length; fast; low cost for small studies | High error rate for homopolymer read; low throughput; will be phased out in 2016 |
|
| ||
| 454 GS FLX+ | Long read length | High error rate homopolymer read; low throughput; large capital cost; will be phased out in 2016 |
|
| ||
| MiSeq | High throughput; ideal for small genome project | Short read length |
|
| ||
| HiSeq X Ten | High throughput; ideal for whole-genome project | Short read length |
|
| ||
| NextSeq 500 | High throughput; ideal for small to large scale project | Short read length |
|
| ||
| SOLiD 5500xl | High throughput | Short read length; poor output data distribution and arduous data analysis |
|
| ||
| Ion Proton I | Ideal for small project; shorter run time; leading future technology | Higher error rate; larger cost per Mb |
|
| ||
| Ion PGM 318 | Low capital investment and running cost; shorter run time | Higher error rate; larger cost per Mb |
|
| ||
| Polonator G.007 | Cost-effective; open resource | Obsolete |
|
| ||
| Helicos HeliScope | Single-molecule sequencing; simple sample preparation and data analysis | Short read length; obsolete |
|
| ||
| PacBio RS II | Single-molecule real-time sequencing; longest available read length | High error rate |
Table 3.
Recent sequencing platforms: these platforms are relatively new and to date (Nov. 15, 2014) there is not enough information to incorporate them into Table 1.
| Platform | Company | Biotechnology | Resource |
|---|---|---|---|
| GENIUS | GenapSys | Proton sensing by pH and temperature change | http://genapsys.com/ |
|
| |||
| NanoTag sequencer | Genia | Electric current change produced by nanotag released from incorporation of nucleotide | http://geniachip.com/ |
|
| |||
| GnuBIO platform | GnuBIO system | Oligo hexamers hybridization in microfluidics | http://gnubio.com/ |
|
| |||
| ∗ | Lasergene | 3′-OH unblocked reversible terminator | http://lasergen.com/ |
|
| |||
| ∗ | Nabsys | Hexamer oligonucleotides hybridization mapping through nanopore arrays | http://nabsys.com/ |
|
| |||
| MinION and GridION | Oxford Nanopore Technologies | Strand DNA or exonuclease cleaved nucleotides pass through nanopores change electric current flow rate | https://nanoporetech.com/ |
|
| |||
| ∗ | Strato Genomics Technology | Conversion of DNA into Xpandomer | http://stratosgenomics.com/ |
∗Lasergene, Nabsys, and Strato Genomics are working on newer platforms.
3. Preliminary Data Processing Steps
Software tools and applications enter the research process once the sequencers fulfill their role of generating reads. The aim of this and the next set of sections is to provide an outline of the individual steps involved in transforming raw data into the novel genome, as presented in Figure 1. The set of interconnected methods are referred to as a “pipeline.” The process starts by using the data generated by one's lab or by downloading the data from the Sequencing Read Archive (SRA) [16]. Data is present in “.SRA” format and must be converted into .FASTQ file format by employing the SRA toolkit (http://www.ncbi.nlm.nih.gov/Traces/sra/). Once converted, the FASTQ format adopts a four-line representation to display the sequence and its associated quality [1]:
-
@ Sequence Identifier
-
Sequence line(s)
-
+ Sequence Identifier
-
ASCII encoding of quality values
Figure 1.

Flow chart for DNA assembly pipeline. Some commonly used tools are mentioned next to each step [36]. Please refer to [19, 35, 37–88] for details on the above-mentioned tools.
ASCII characters utilized in the last line of the above-mentioned SRA format symbolize quality values (Q-values). Q-values are log-probabilities illustrating the quality of each base call. For example, for Sanger the formula is
| (1) |
where P e is the probability of determining a base incorrectly [17, 18]. For ASCII encoded quality values the following characters depict an increasing order of quality:
-
!”#$%&'()∗ + , −./0123456789:; < = >?@ABCDEFG
-
HIJKLMNOPQRSTUVWXYZ[∖∧ ‘abcdefghijklmno
-
pqrstuvwxyz{∣}~
Similar to FASTQ, FASTA format seems like an abridged version of FASTQ file format. It maintains a two-line arrangement to display the sequence and contains no mention of its quality:
-
@ Sequence Identifier
-
sequence line(s)
Once reads are received in their correct format, one must trim adapter sequences, filter, or trim low quality ends and collapse identical reads. A naive approach is to remove all reads that contain the flag “N.” An improved method retains all reads that have an overall quality P qual > q, where q is a user-defined parameter [19–23]. A more enhanced approach consists in matching reads against known ribosomal and heterochromatin DNA and removing them should they match [24]. Nevertheless, since a significant portion of raw data contains errors one must correct them.
4. Assembly Process
The primary aim of the assembly process is to connect all reads together, one after another, to form a single contiguous sequence. Interestingly, due to the inherent nature of the problem, graph theory, especially de Bruijn graph, models very well such a process [25]. In graphical models individual nodes symbolize reads whereas edges between the nodes emphasize “overlaps” between reads. Once the overlap between all reads is established, the task at hand is to generate a “layout” by searching for a single path from beginning, that is, the root of the graph structure, to the end, the leaf of the graph structure, as illustrated in Figures 2 and 3. As such, generating a layout is very challenging, because not one but multiple disjointed graphs are realized, each depicting a contig. In addition, each graph has many loops portraying repeat regions as well as multiple branches, both long and short. All these hazards need to be resolved. Branches that are small may be discarded, while longer branches compete with one another to serve as potential representatives for each contig. Loops portray repeat regions, so one must decide how many times the repeats should be placed within the final assembly. Nevertheless, assemblers do spend a significant amount of time resolving potential hazards, in multiple ways. The output is a collection of contigs that need to be ordered, appended, and elongated, a process called “scaffolding” [25–28].
Figure 2.
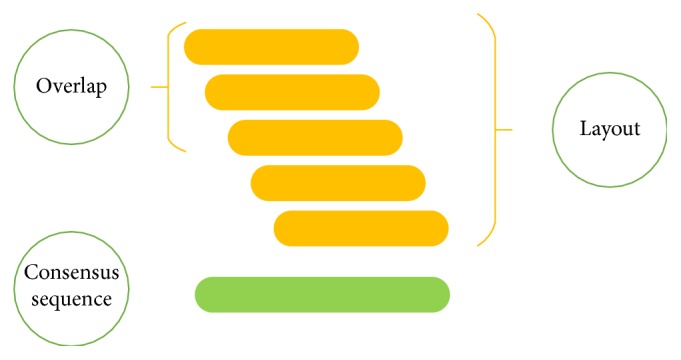
De novo assembly: reads that overlap each other are shown to align at appropriate places with respect to one another, thereby generating the layout. The layout, in turn, constructs a consensus sequence, simply by basing itself on the majority base call. The above-mentioned framework is called “Overlap-Layout-Consensus.”
Figure 3.

Reference assisted assembly: reads align relative to a reference sequence setting up the layout. The layout, in turn, constructs a consensus sequence, simply by basing itself on the majority base call. Please note that the reads do not need to match perfectly with the reference. The example shows a shaded region where the consensus sequence differs from the reference. This working scheme is called “Alignment-Layout-Consensus.”
5. Evaluating the Quality of an Assembly
Evaluating the quality of an assembly requires analyzing multiple metrics. These statistics measure an assembly from various standpoints. Table 4 illustrates some commonly used assembly metrics/statistics and their explanations. After evaluating the assembly it is recommended to visualize the assembly in order to obtain a pictorial view of the draft. Figure 1 presents common tools used in each part of the pipeline.
Table 4.
Some common assembly statistics. Here an ↑ indicates higher is better while a ↓ implies less is better.
| ↑/↓ | Description |
|---|---|
| ↑ | N50: quantified the length of the scaffold at which 50% of the total assembled size of the sequence is covered. NG50: evaluated in a way similar to N50. However, here the length of the sequence is either known or predicted [1, 29]. NA50 and NGA50: these metrics deal with aligned blocks rather than contigs [35]. Continuity: similar to N50, NA50, NG50, and NGA50 there are other metrics like N75, NA75, NG75, NGA75, N90, NA90, NG90, and NGA90. Number of Genes: an assembly which exhibits more highly conserved core Eukaryotic genes is considered better [29]. Accuracy: if an assembly reports at least 90% of its bases with a minimum of 5× coverage, it is considered accurate. Choppiness: the average contig length should be greater than a certain threshold. Otherwise, the assembly needs to be redrafted. Validity: the fraction of assembly that can be confirmed by a reference sequence [29]. Completeness: an assembly is considered complete if the scaffolds cover more than 90% of the actual genome. Length of the Longest Scaffold: typically the greater the length, the better the assembly. Similar is the case of the shortest scaffold. Number of scaffolds > X, where X is a user-defined length. Similarly, % age of scaffolds > X. Total Length of the Scaffolds and Total Scaffold Length as Percentage of Estimated Genome Size: the closer it is to 100%, the better it is. Percentage of Contigs Scaffolded: percentage of contigs that were connected with one another during the scaffolding process [1]. |
|
| |
| ↓ | Number of Gaps in the Assembly: by aligning paired-read data onto scaffolds one may determine scaffolding errors [1]. Number of Scaffolds: an assembly which has a smaller number of scaffolds would be assumed to be better. For example, the optimum assembly would be one continuous sequence depicting the true sequence. LG50 Scaffold Count: number of scaffolds counted in reaching NG50 threshold. Similar would be the case of LG75 and LG90. Percentage of Unscaffolded Contigs: since contigs may remain unscaffolded. |
6. Linux Based Distributions
The software environments pertaining to genome assembly are many and as such need to be constantly maintained, configured, and updated. This repeated and continuous configuration consumes a good amount of time and resources. Therefore, to address these challenges, engineers and computer scientists have proposed multiple solutions built on Linux systems that include within them all the necessary software needed by the research group. Table 5 mentions a few. As for genome assembly, both Baari, an Ubuntu-derived operating system (http://people.tamu.edu/~bilalwajidabbas/Baari.html), and Genobuntu, a software package, provide about 60+ genome assembly tools (https://sourceforge.net/projects/genobuntu/). It is hoped the current set of tools will be constantly updated to suit the ever growing needs of the scientific community.
Table 5.
Comparison of different Linux distributions. Here LTS stands for Long Term Support and GUI refers to Graphical User Interface.
| Operating system | Free | Base OS | Software | Open source | LTS | GUI | ×86/×64 | Cloud | Script files |
|---|---|---|---|---|---|---|---|---|---|
| Baari | ✓ | Ubuntu 13.10 | 60+ genome assembly tools | ✓ | ✓ | Unity | ×64 | × | ✓ |
|
| |||||||||
| Lxtoo | ✓ | Gentoo Linux 11 | Sequence analysis, protein-protein interactions | ✓ | ✓ | X11 Desktop | ×86/×64 | × | × |
|
| |||||||||
| Open Discovery 3 | × | Fedora Sulphur 9 | Molecular dynamics, docking, sequence analysis | × | ✓ | GNOME 2.22 | ×86/×64 | ✓ | × |
|
| |||||||||
| BioBrew | ✓ | Red Hat 7.3 | Appropriate for clusters | ✓ | × | KDE, GNOME | ×86 | × | × |
|
| |||||||||
| PhyLIS | ✓ | Ubuntu 8 | Phylogenetics | ✓ | × | Unity | ×86/×64 | × | × |
|
| |||||||||
| DNALinux | ✓ | Xubuntu | DNA and protein analysis | ✓ | × | XFCE 4.2.2 | ×86 | ✓ | × |
|
| |||||||||
| Bioconductor Buntu | ✓ | Ubuntu 12.04 | Bioconductor Buntu 2.11 |
✓ | ✓ | Unity | ×86/×64 | × | × |
|
| |||||||||
| BioLinux 7 | ✓ | Ubuntu 12.04 | 500+ bioinformatics applications with 7 assembly tools | ✓ | ✓ | Unity | ×64 | ✓ | × |
7. Considerations and Concerns
Genome Online Database (GOLD) reports that as of Dec 12, 2015, 1,136 Archaeal, 49,983 Bacterial, 4,473 Viruses, and 11,122 Eukaryotic genomes have been sequenced. There remains plenty of room for work. The $1000 genome project has reduced the cost significantly, but if personalized medication is expected to be effective and available to everyone, the cost and time duration for sequencing need to be reduced further. Processing raw data needs to be done both cheaply and at ultra-fast rates. Spending about 50 hours of processing time on a system with 20 microprocessor cores and 20 GB RAM is not uncommon (as of 2014) [29]. Imagine trying to sequence the genomes of an entire country's population. Transferring all the raw data via an Internet connection from one country to another is not feasible. Therefore, countries will have to provide for their own supercomputers, and algorithms will need to be parallelized with careful attention to Hadoop and MapReduce frameworks [30–34]. Hadoop and MapReduce are ideal as both are designed to process “big-data” using parallel and distributed algorithms on clusters of systems [30–34]. With so many obstacles ahead, genome assembly will remain challenging for many years to come.
Key Points
NIH's $1,000 genome project led researchers to develop efficient, economical, and high-throughput sequencing platforms. Examples include Roche's 454 GS, Illumina's MiSeq and HiSeq, ABI's SOLiD, and Life Technologies' Ion Torrent and Proton Torrent platforms. A brief comparison of these next-generation sequencing platforms is presented.
Data provided by these platforms is transformed into a sequence via a series of processes collectively called a “pipeline.” It starts with trimming adapter sequences, filtering low quality ends, and collapsing identical reads. The final set of reads are then connected together, one after another, to form contiguous sequences, called “contigs.” The collection of contigs needs to be ordered, appended, and elongated via a process called “scaffolding.”
A number of software environments providing bioinformatics solutions have been provided over the years. A brief comparison of some of these is presented here.
Conflict of Interests
The authors declare no conflict of interests regarding the publication of this paper.
References
- 1.Wajid B., Serpedin E. Do it yourself guide to genome assembly. Briefings in Functional Genomics. 2016;15(1):1–9. doi: 10.1093/bfgp/elu042. [DOI] [PubMed] [Google Scholar]
- 2.Venter J. C., Adams M. D., Myers E. W., et al. The sequence of the human genome. Science. 2001;291(5507):1304–1351. doi: 10.1126/science.1058040. [DOI] [PubMed] [Google Scholar]
- 3.Sanger F., Nicklen S., Coulson A. R., et al. DNA sequencing with chain-terminating inhibitors. Biotechnology. 1992;74(12):5463–5467. doi: 10.1073/pnas.74.12.5463. [DOI] [PMC free article] [PubMed] [Google Scholar]
- 4.Wheeler D. A., Srinivasan M., Egholm M., et al. The complete genome of an individual by massively parallel DNA sequencing. Nature. 2008;452(7189):872–876. doi: 10.1038/nature06884. [DOI] [PubMed] [Google Scholar]
- 5.Ahmadian A., Gharizadeh B., Gustafsson A. C., et al. Single-nucleotide polymorphism analysis by pyrosequencing. Analytical Biochemistry. 2000;280(1):103–110. doi: 10.1006/abio.2000.4493. [DOI] [PubMed] [Google Scholar]
- 6.Ahmadian A., Ehn M., Hober S. Pyrosequencing: history, biochemistry and future. Clinica Chimica Acta. 2006;363(1-2):83–94. doi: 10.1016/j.cccn.2005.04.038. [DOI] [PubMed] [Google Scholar]
- 7.Morozova O., Marra M. A. Applications of next-generation sequencing technologies in functional genomics. Genomics. 2008;92(5):255–264. doi: 10.1016/j.ygeno.2008.07.001. [DOI] [PubMed] [Google Scholar]
- 8.Bentley D. R., Balasubramanian S., Swerdlow H. P., et al. Accurate whole human genome sequencing using reversible terminator chemistry. Nature. 2008;456(7218):53–59. doi: 10.1038/nature07517. [DOI] [PMC free article] [PubMed] [Google Scholar]
- 9.Shendure J., Porreca G. J., Reppas N. B., et al. Molecular biology: accurate multiplex polony sequencing of an evolved bacterial genome. Science. 2005;309(5741):1728–1732. doi: 10.1126/science.1117389. [DOI] [PubMed] [Google Scholar]
- 10.Rothberg J. M., Hinz W., Rearick T. M., et al. An integrated semiconductor device enabling non-optical genome sequencing. Nature. 2011;475(7356):348–352. doi: 10.1038/nature10242. [DOI] [PubMed] [Google Scholar]
- 11.Milos P. Helicos BioSciences. Pharmacogenomics. 2008;9(4):477–480. doi: 10.2217/14622416.9.4.477. [DOI] [PubMed] [Google Scholar]
- 12.Eid J., Fehr A., Gray J., et al. Real-time DNA sequencing from single polymerase molecules. Science. 2009;323(5910):133–138. doi: 10.1126/science.1162986. [DOI] [PubMed] [Google Scholar]
- 13.Niedringhaus T. P., Milanova D., Kerby M. B., Snyder M. P., Barron A. E. Landscape of next-generation sequencing technologies. Analytical Chemistry. 2011;83(12):4327–4341. doi: 10.1021/ac2010857. [DOI] [PMC free article] [PubMed] [Google Scholar]
- 14.Venkatesan B. M., Bashir R. Nanopore sensors for nucleic acid analysis. Nature Nanotechnology. 2010;6(10):615–624. doi: 10.1038/nnano.2011.129. [DOI] [PubMed] [Google Scholar]
- 15.Schadt E. E., Turner S., Kasarskis A. A window into third-generation sequencing. Human Molecular Genetics. 2010;19(2):R227–R240. doi: 10.1093/hmg/ddq416. [DOI] [PubMed] [Google Scholar]
- 16.Leinonen R., Sugawara H., Shumway M. The sequence read archive. Nucleic Acids Research. 2011;39(1):D19–D21. doi: 10.1093/nar/gkq1019. [DOI] [PMC free article] [PubMed] [Google Scholar]
- 17.Cock P. J. A., Fields C. J., Goto N., Heuer M. L., Rice P. M. The Sanger FASTQ file format for sequences with quality scores, and the Solexa/Illumina FASTQ variants. Nucleic Acids Research. 2010;38(6):1767–1771. doi: 10.1093/nar/gkp1137. [DOI] [PMC free article] [PubMed] [Google Scholar]
- 18.Wajid B., Nounou M., Nounou H., et al. Gibbs-beca: gibbs sampling and bayesian estimation for comparative assembly. Proceedings of the 3rd International Conference on Biomedical Engineering, Electronics and Nanotechnology (MIC-BEN '13); 2013; Mosharaka for Researches and Studies; [Google Scholar]
- 19.Patel R. K., Jain M. NGS QC Toolkit: a toolkit for quality control of next generation sequencing data. PLoS ONE. 2012;7(2) doi: 10.1371/journal.pone.0030619.e30619 [DOI] [PMC free article] [PubMed] [Google Scholar]
- 20.Yuan B. Mapping next generation sequence reads. 2010.
- 21.Mane S. P., Modise T., Sobral B. W. Analysis of high-throughput sequencing data. Methods in Molecular Biology. 2011;678:1–11. doi: 10.1007/978-1-60761-682-5_1. [DOI] [PMC free article] [PubMed] [Google Scholar]
- 22.Gordon A., Hannon G. Fastx-toolkit. 2010, http://hannonlab.cshl.edu/fastx_toolkit/index.html.
- 23.Goecks J., Nekrutenko A., Taylor J., et al. Galaxy: a comprehensive approach for supporting accessible, reproducible, and transparent computational research in the life sciences. Genome Biology. 2010;11(8, article R86) doi: 10.1186/gb-2010-11-8-r86. [DOI] [PMC free article] [PubMed] [Google Scholar]
- 24.Myers E. W., Sutton G. G., Delcher A. L., et al. A whole-genome assembly of Drosophila. Science. 2000;287(5461):2196–2204. doi: 10.1126/science.287.5461.2196. [DOI] [PubMed] [Google Scholar]
- 25.Wajid B., Serpedin E. Review of general algorithmic features for genome assemblers for next generation sequencers. Genomics, Proteomics and Bioinformatics. 2012;10(2):58–73. doi: 10.1016/j.gpb.2012.05.006. [DOI] [PMC free article] [PubMed] [Google Scholar]
- 26.Miller J. R., Koren S., Sutton G. Assembly algorithms for next-generation sequencing data. Genomics. 2010;95(6):315–327. doi: 10.1016/j.ygeno.2010.03.001. [DOI] [PMC free article] [PubMed] [Google Scholar]
- 27.Meader S., Hillier L. W., Locke D., Ponting C. P., Lunter G. Genome assembly quality: assessment and improvement using the neutral indel model. Genome Research. 2010;20(5):675–684. doi: 10.1101/gr.096966.109. [DOI] [PMC free article] [PubMed] [Google Scholar]
- 28.Alkan C., Sajjadian S., Eichler E. E. Limitations of next-generation genome sequence assembly. Nature Methods. 2011;8(1):61–65. doi: 10.1038/nmeth.1527. [DOI] [PMC free article] [PubMed] [Google Scholar]
- 29.Bradnam K. R., Fass J. N., Alexandrov A., et al. Assemblathon 2: evaluating de novo methods of genome assembly in three vertebrate species. Gigascience. 2013;2(1, article 10) doi: 10.1186/2047-217X-2-10. [DOI] [PMC free article] [PubMed] [Google Scholar]
- 30.White T. Hadoop: The Definitive Guide. Sebastopol, Calif, USA: O'Reilly Media; 2012. [Google Scholar]
- 31.Zomaya A. Parallel Computing for Bioinformatics and Computational Biology. New York, NY, USA: John Wiley & Sons; 2006. [Google Scholar]
- 32.Talbi E., Zomaya A. Grid Computing for Bioinformatics and Computational Biology. Vol. 1. New York, NY, USA: John Wiley & Sons; 2008. [Google Scholar]
- 33.Augen J. Bioinformatics in the Post-Genomic Era: Genome, Transcriptome, Proteome, and Information-Based Medicine. Addison-Wesley Professional; 2004. [Google Scholar]
- 34.Chen Y. Bioinformatics Technologies. New York, NY, USA: Springer; 2005. [Google Scholar]
- 35.Gurevich A., Saveliev V., Vyahhi N., Tesler G. QUAST: quality assessment tool for genome assemblies. Bioinformatics. 2013;29(8):1072–1075. doi: 10.1093/bioinformatics/btt086. [DOI] [PMC free article] [PubMed] [Google Scholar]
- 36.Henry V. J., Bandrowski A. E., Pepin A. S., Gonzalez B. J., Desfeux A. OMICtools: an informative directory for multi-omic data analysis. Database. 2014;2014 doi: 10.1093/database/bau069.bau069 [DOI] [PMC free article] [PubMed] [Google Scholar]
- 37.Lindgreen S. AdapterRemoval: easy cleaning of next-generation sequencing reads. BMC Research Notes. 2012;5, article 337 doi: 10.1186/1756-0500-5-337. [DOI] [PMC free article] [PubMed] [Google Scholar]
- 38.Aronesty E. Comparison of sequencing utility programs. The Open Bioinformatics Journal. 2013;7(1):1–8. doi: 10.2174/1875036201307010001. [DOI] [Google Scholar]
- 39.Dodt M., Roehr J. T., Ahmed R., Dieterich C. FLEXBAR-flexible barcode and adapter processing for next-generation sequencing platforms. Biology. 2012;1(3):895–905. doi: 10.3390/biology1030895. [DOI] [PMC free article] [PubMed] [Google Scholar]
- 40.O'Connell J., Schulz-Trieglaff O., Carlson E., Hims M. M., Gormley N. A., Cox A. J. NxTrim: optimized trimming of Illumina mate pair reads. Bioinformatics. 2015;31(12):2035–2037. doi: 10.1093/bioinformatics/btv057. [DOI] [PubMed] [Google Scholar]
- 41.Wu Z., Wang X., Zhang X. Using non-uniform read distribution models to improve isoform expression inference in RNA-Seq. Bioinformatics. 2011;27(4):502–508. doi: 10.1093/bioinformatics/btq696. [DOI] [PubMed] [Google Scholar]
- 42.Kong Y. Btrim: a fast, lightweight adapter and quality trimming program for next-generation sequencing technologies. Genomics. 2011;98(2):152–153. doi: 10.1016/j.ygeno.2011.05.009. [DOI] [PubMed] [Google Scholar]
- 43.Xu H., Luo X., Qian J., et al. FastUniq: a fast de novo duplicates removal tool for paired short reads. PLoS ONE. 2012;7(12) doi: 10.1371/journal.pone.0052249.e52249 [DOI] [PMC free article] [PubMed] [Google Scholar]
- 44.Yang X., Liu D., Liu F., et al. HTQC: a fast quality control toolkit for Illumina sequencing data. BMC Bioinformatics. 2013;14, article 33 doi: 10.1186/1471-2105-14-33. [DOI] [PMC free article] [PubMed] [Google Scholar]
- 45.Schmieder R., Edwards R. Quality control and preprocessing of metagenomic datasets. Bioinformatics. 2011;27(6):863–864. doi: 10.1093/bioinformatics/btr026. [DOI] [PMC free article] [PubMed] [Google Scholar]
- 46.Davis M. P., Dongen S. V., Goodger C. A., Bartonicek N., Enright A. J. Kraken: a set of tools for quality control and analysis of high-throughput sequence data. Methods. 2013;63(1):41–49. doi: 10.1016/j.ymeth.2013.06.027. [DOI] [PMC free article] [PubMed] [Google Scholar]
- 47.Bao R., Huang L., Andrade J., et al. Review of current methods, applications, and data management for the bioinformatics analysis of whole exome sequencing. Cancer Informatics. 2014;13(supplement 2):67–82. doi: 10.4137/cin.s13779. [DOI] [PMC free article] [PubMed] [Google Scholar]
- 48.Edgar R. C., Haas B. J., Clemente J. C., Quince C., Knight R. UCHIME improves sensitivity and speed of chimera detection. Bioinformatics. 2011;27(16):2194–2200. doi: 10.1093/bioinformatics/btr381. [DOI] [PMC free article] [PubMed] [Google Scholar]
- 49.Haas B. J., Gevers D., Earl A. M., et al. Chimeric 16S rRNA sequence formation and detection in Sanger and 454-pyrosequenced PCR amplicons. Genome Research. 2011;21(3):494–504. doi: 10.1101/gr.112730.110. [DOI] [PMC free article] [PubMed] [Google Scholar]
- 50.Heo Y., Wu X.-L., Chen D., Ma J., Hwu W.-M. BLESS: bloom filter-based error correction solution for high-throughput sequencing reads. Bioinformatics. 2014;30(10):1354–1362. doi: 10.1093/bioinformatics/btu030. [DOI] [PMC free article] [PubMed] [Google Scholar]
- 51.Shi H., Schmidt B., Liu W., Müller-Wittig W. A parallel algorithm for error correction in high-throughput short-read data on CUDA-enabled graphics hardware. Journal of Computational Biology. 2010;17(4):603–615. doi: 10.1089/cmb.2009.0062. [DOI] [PubMed] [Google Scholar]
- 52.Medvedev P., Scott E., Kakaradov B., Pevzner P. Error correction of high-throughput sequencing datasets with non-uniform coverage. Bioinformatics. 2011;27(13):i137–i141. doi: 10.1093/bioinformatics/btr208. [DOI] [PMC free article] [PubMed] [Google Scholar]
- 53.Ilie L., Fazayeli F., Ilie S. HiTEC: accurate error correction in high-throughput sequencing data. Bioinformatics. 2011;27(3):295–302. doi: 10.1093/bioinformatics/btq653. [DOI] [PubMed] [Google Scholar]
- 54.Hackl T., Hedrich R., Schultz J., Förster F. Proovread: large-scale high-accuracy PacBio correction through iterative short read consensus. Bioinformatics. 2014;30(21):3004–3011. doi: 10.1093/bioinformatics/btu392. [DOI] [PMC free article] [PubMed] [Google Scholar]
- 55.Ilie L., Molnar M. RACER: rapid and accurate correction of errors in reads. Bioinformatics. 2013;29(19):2490–2493. doi: 10.1093/bioinformatics/btt407. [DOI] [PubMed] [Google Scholar]
- 56.Yang X., Chockalingam S. P., Aluru S. A survey of error-correction methods for next-generation sequencing. Briefings in Bioinformatics. 2013;14(1):56–66. doi: 10.1093/bib/bbs015. [DOI] [PubMed] [Google Scholar]
- 57.Warren R. L., Sutton G. G., Jones S. J. M., Holt R. A. Assembling millions of short DNA sequences using SSAKE. Bioinformatics. 2007;23(4):500–501. doi: 10.1093/bioinformatics/btl629. [DOI] [PMC free article] [PubMed] [Google Scholar]
- 58.D'Agostino D., Clematis A., Guffanti A., Milanesi L., Merelli I. A CUDA-based implementation of the SSAKE genomics application. Proceedings of the 20th Euromicro International Conference on Parallel, Distributed and Network-Based Processing (PDP '12); February 2012; Garching, Germany. IEEE; pp. 612–616. [DOI] [Google Scholar]
- 59.Jeck W. R., Reinhardt J. A., Baltrus D. A., et al. Extending assembly of short DNA sequences to handle error. Bioinformatics. 2007;23(21):2942–2944. doi: 10.1093/bioinformatics/btm451. [DOI] [PubMed] [Google Scholar]
- 60.Bryant D. W., Jr., Wong W.-K., Mockler T. C. QSRA—a quality-value guided de novo short read assembler. BMC Bioinformatics. 2009;10, article 69 doi: 10.1186/1471-2105-10-69. [DOI] [PMC free article] [PubMed] [Google Scholar]
- 61.Butler J., MacCallum I., Kleber M., et al. ALLPATHS: de novo assembly of whole-genome shotgun microreads. Genome Research. 2008;18(5):810–820. doi: 10.1101/gr.7337908. [DOI] [PMC free article] [PubMed] [Google Scholar]
- 62.Namiki T., Hachiya T., Tanaka H., Sakakibara Y. MetaVelvet: an extension of Velvet assembler to de novo metagenome assembly from short sequence reads. Nucleic Acids Research. 2012;40(20, article e155) doi: 10.1093/nar/gks678. [DOI] [PMC free article] [PubMed] [Google Scholar]
- 63.Zerbino D. R., Birney E. Velvet: algorithms for de novo short read assembly using de Bruijn graphs. Genome Research. 2008;18(5):821–829. doi: 10.1101/gr.074492.107. [DOI] [PMC free article] [PubMed] [Google Scholar]
- 64.Dohm J. C., Lottaz C., Borodina T., Himmelbauer H. SHARCGS, a fast and highly accurate short-read assembly algorithm for de novo genomic sequencing. Genome Research. 2007;17(11):1697–1706. doi: 10.1101/gr.6435207. [DOI] [PMC free article] [PubMed] [Google Scholar]
- 65.Simpson J. T., Wong K., Jackman S. D., Schein J. E., Jones S. J. M., Birol I. ABySS: a parallel assembler for short read sequence data. Genome Research. 2009;19(6):1117–1123. doi: 10.1101/gr.089532.108. [DOI] [PMC free article] [PubMed] [Google Scholar]
- 66.Drezen E., Rizk G., Chikhi R., et al. GATB: genome assembly & analysis tool box. Bioinformatics. 2014;30(20):2959–2961. doi: 10.1093/bioinformatics/btu406. [DOI] [PMC free article] [PubMed] [Google Scholar]
- 67.Hernandez D., François P., Farinelli L., Østerås M., Schrenzel J. De novo bacterial genome sequencing: millions of very short reads assembled on a desktop computer. Genome Research. 2008;18(5):802–809. doi: 10.1101/gr.072033.107. [DOI] [PMC free article] [PubMed] [Google Scholar]
- 68.Gnerre S., Lander E. S., Lindblad-Toh K., Jaffe D. B. Assisted assembly: how to improve a de novo genome assembly by using related species. Genome Biology. 2009;10(8, article R88) doi: 10.1186/gb-2009-10-8-r88. [DOI] [PMC free article] [PubMed] [Google Scholar]
- 69.Salzberg S. L., Sommer D. D., Puiu D., Lee V. T. Gene-boosted assembly of a novel bacterial genome from very short reads. PLoS Computational Biology. 2008;4(9) doi: 10.1371/journal.pcbi.1000186.e1000186 [DOI] [PMC free article] [PubMed] [Google Scholar]
- 70.Pop M., Phillippy A., Delcher A. L., Salzberg S. L. Comparative genome assembly. Briefings in Bioinformatics. 2004;5(3):237–248. doi: 10.1093/bib/5.3.237. [DOI] [PubMed] [Google Scholar]
- 71.Wajid B., Ekti A. R., Noor A., et al. Supersonic MiB. Proceedings of the IEEE International Workshop on Genomic Signal Processing and Statistics (GENSIPS '13); November 2013; Houston, Tex, USA. pp. 86–87. [DOI] [Google Scholar]
- 72.Wajid B., Serpedin E., Nounou M., Nounou H. MiB: a comparative assembly processing pipeline. Proceedings of the IEEE International Workshop on Genomic Signal Processing and Statistics (GENSIPS '12); December 2012; Washington, DC, USA. IEEE; pp. 86–89. [DOI] [Google Scholar]
- 73.Wajid B., Serpedin E., Nounou M., Nounou H. A modular approach to reference assisted sequence assembly. International Journal of Computational Biology and Drug Design. 2015;8(3) [Google Scholar]
- 74.Boetzer M., Henkel C. V., Jansen H. J., Butler D., Pirovano W. Scaffolding pre-assembled contigs using SSPACE. Bioinformatics. 2011;27(4):578–579. doi: 10.1093/bioinformatics/btq683. [DOI] [PubMed] [Google Scholar]
- 75.Salmela L., Mäkinen V., Välimäki N., Ylinen J., Ukkonen E. Fast scaffolding with small independent mixed integer programs. Bioinformatics. 2011;27(23):3259–3265. doi: 10.1093/bioinformatics/btr562.btr562 [DOI] [PMC free article] [PubMed] [Google Scholar]
- 76.Worley K. Improving draft genome assemblies using next-gen data with gap-filling and scaffolding assembly tools. Proceedings of the Plant and Animal Genome XX Conference; January 2012; Plant and Animal Genome; [Google Scholar]
- 77.Sahlin K., Vezzi F., Nystedt B., Lundeberg J., Arvestad L. BESST-efficient scaffolding of large fragmented assemblies. BMC Bioinformatics. 2014;15, article 281 doi: 10.1186/1471-2105-15-281. [DOI] [PMC free article] [PubMed] [Google Scholar]
- 78.Donmez N., Brudno M. SCARPA: Scaffolding reads with practical algorithms. Bioinformatics. 2013;29(4):428–434. doi: 10.1093/bioinformatics/bts716. [DOI] [PubMed] [Google Scholar]
- 79.Ghodsi M., Hill C. M., Astrovskaya I., et al. De novo likelihood-based measures for comparing genome assemblies. BMC Research Notes. 2013;6(1, article 334) doi: 10.1186/1756-0500-6-334. [DOI] [PMC free article] [PubMed] [Google Scholar]
- 80.Rahman A., Pachter L. CGAL: computing genome assembly likelihoods. Genome Biology. 2013;14(1, article R8) doi: 10.1186/gb-2013-14-1-r8. [DOI] [PMC free article] [PubMed] [Google Scholar]
- 81.Clark S. C., Egan R., Frazier P. I., Wang Z. ALE: a generic assembly likelihood evaluation framework for assessing the accuracy of genome and metagenome assemblies. Bioinformatics. 2013;29(4):435–443. doi: 10.1093/bioinformatics/bts723. [DOI] [PubMed] [Google Scholar]
- 82.Huang W., Marth G. EagleView: a genome assembly viewer for next-generation sequencing technologies. Genome Research. 2008;18(9):1538–1543. doi: 10.1101/gr.076067.108. [DOI] [PMC free article] [PubMed] [Google Scholar]
- 83.Laczik M., Tukacs E., Uzonyi B., et al. Geno viewer, a SAM/BAM viewer tool. Bioinformation. 2012;8(2):107–109. doi: 10.6026/97320630008107. [DOI] [PMC free article] [PubMed] [Google Scholar]
- 84.Andrews S. SeqMonk. 2007. [Google Scholar]
- 85.Popendorf K., Sakakibara Y. SAMSCOPE: an OpenGL-based real-time interactive scale-free SAM viewer. Bioinformatics. 2012;28(9):1276–1277. doi: 10.1093/bioinformatics/bts122. [DOI] [PubMed] [Google Scholar]
- 86.Milne I., Bayer M., Cardle L., et al. Tablet-next generation sequence assembly visualization. Bioinformatics. 2009;26(3):401–402. doi: 10.1093/bioinformatics/btp666. [DOI] [PMC free article] [PubMed] [Google Scholar]
- 87.Manske H. M., Kwiatkowski D. P. LookSeq: a browser-based viewer for deep sequencing data. Genome Research. 2009;19(11):2125–2132. doi: 10.1101/gr.093443.109. [DOI] [PMC free article] [PubMed] [Google Scholar]
- 88.Schatz M. C., Phillippy A. M., Sommer D. D., et al. Hawkeye and AMOS: visualizing and assessing the quality of genome assemblies. Briefings in Bioinformatics. 2013;14(2):213–224. doi: 10.1093/bib/bbr074. [DOI] [PMC free article] [PubMed] [Google Scholar]