

Abstract
Purpose
Amplifications and mutations in the KIT proto-oncogene in subsets of melanomas provide therapeutic opportunities.
Patients and Methods
We conducted a multicenter phase II trial of imatinib in metastatic mucosal, acral, or chronically sun-damaged (CSD) melanoma with KIT amplifications and/or mutations. Patients received imatinib 400 mg once per day or 400 mg twice per day if there was no initial response. Dose reductions were permitted for treatment-related toxicities. Additional oncogene mutation screening was performed by mass spectroscopy.
Results
Twenty-five patients were enrolled (24 evaluable). Eight patients (33%) had tumors with KIT mutations, 11 (46%) with KIT amplifications, and five (21%) with both. Median follow-up was 10.6 months (range, 3.7 to 27.1 months). Best overall response rate (BORR) was 29% (21% excluding nonconfirmed responses) with a two-stage 95% CI of 13% to 51%. BORR was significantly greater than the hypothesized null of 5% and statistically significantly different by mutation status (7 of 13 or 54% KIT mutated v 0% KIT amplified only). There were no statistical differences in rates of progression or survival by mutation status or by melanoma site. The overall disease control rate was 50% but varied significantly by KIT mutation status (77% mutated v 18% amplified). Four patients harbored pretreatment NRAS mutations, and one patient acquired increased KIT amplification after treatment.
Conclusion
Melanomas that arise on mucosal, acral, or CSD skin should be assessed for KIT mutations. Imatinib can be effective when tumors harbor KIT mutations, but not if KIT is amplified only. NRAS mutations and KIT copy number gain may be mechanisms of therapeutic resistance to imatinib.
INTRODUCTION
The clinical behavior of melanomas arising in mucosal and acral sites, such as palms, soles, and nail beds, is distinct from that of cutaneous melanoma. These melanoma subtypes do not result from the usual risk factors of sun exposure and family history.1–3 Because of their unique distribution and similar incidence across races, these melanomas have been linked to different genetic alterations and behavior.4 Unfortunately, on the development of metastatic disease, patient prognosis remains poor.
Mutations and amplifications in the KIT oncogene have been discovered in mucosal and acral melanomas as well as those arising on chronically sun-damaged (CSD) skin.5–8 KIT mutations are uncommon. Large series reported KIT mutations in 11.9% of acral melanomas in China7 and 2% of nonmucosal melanomas in Australia,9 lower incidences than originally described. Approximately 70% of KIT mutations are in the juxtamembrane region, thus predicting responsiveness to the tyrosine kinase inhibitor, imatinib mesylate.10
Imatinib inhibits proliferation and induces apoptosis in gastrointestinal stromal tumor (GIST) cells as well as melanoma cells with an activating KIT mutation.11 The discovery of KIT mutations in human melanoma tumors thus presents a clear rationale for testing the activity of imatinib in this patient population. We conducted a multicenter trial of imatinib in patients with metastatic melanoma arising from mucosal, acral, or CSD skin that harbored amplification of or mutations in KIT.
PATIENTS AND METHODS
Eligibility
Eligibility included history of primary melanoma arising from mucosa, acral sites, or CSD skin (defined by the presence of solar elastosis or increased abnormal elastin in the mid-upper dermis12 and determined as standard of care within the pathology department at the institution where the patient was treated before trial enrollment); unresectable stage III or IV melanoma; Eastern Cooperative Oncology Group (ECOG) performance status 0 to 2; normal end-organ function; and KIT mutation or amplification as determined by quantitative polymerase chain reaction (qPCR) or fluorescent in situ hybridization (FISH). Primary exclusions included prior treatment with a KIT inhibitor or brain metastasis.
KIT Molecular Status
KIT mutational status was determined by PCR, high-performance liquid chromatography, and DNA sequencing, with amplicons arising from exons 9, 11, 13, and 17. Additional oncogene mutation screening was performed on pretreatment tissue from all treated patients via a mass spectroscopy-based system (Sequenom, San Diego, CA) by using a panel of 643 hotspot mutations across 53 cancer genes notably including exons 14 and 15 of KIT.13 KIT gene amplification was assessed by qPCR.14 The threshold for increased KIT copy number was set relative to normal samples with the 95% confidence level according to Chebychev's inequality using the formula mean ± (4.47 × standard deviation). The threshold for positive was 5.29 copies of KIT relative to GAPDH. KIT gene amplification was also evaluated by FISH in 4-μm paraffin sections (Appendix Fig A1, online only). KIT gene copy number was determined in relationship to a chromosome 2 pericentromeric probe, which corresponds to a region rarely subject to gain or loss in melanoma. A sample (or histologically distinctive region) was scored as amplified if the probe:centromere ratio was more than 1.50 (highly amplified > 5.0).
Study Objectives and Statistics
The primary objectives of the study were to assess response rate (RR) per Response Evaluation Criteria in Solid Tumors (RECIST) 1.0 and time to progression (TTP). Secondary objectives included assessing tolerability and overall survival (OS) and exploring the association between mutation status and response to therapy. The study used a Simon two-stage design to compare a null RR of 5% with an alternative RR of 20% with 84% power and a one-sided type I error of 11%. The total sample size was 25 patients. Ten patients were enrolled in the first stage, with one response required to proceed to the second stage. Three responses among 25 patients were required for imatinib to be considered promising. A stopping rule was added such that if zero of 10 patients whose tumors were not mutated but were amplified had a response, then only patients with tumors that harbored mutations would be enrolled. Further description of statistical methods are found in the Appendix (online only).
Study Agent Dosing and Toxicity
Patients were treated with imatinib 400 mg orally once per day until disease progression. In other solid tumors, the optimal dose of imatinib is dependent on mutational status of the tumor, with certain mutations showing an improved RR to increased doses.15 Therefore, patients receiving 400 mg once per day were permitted to increase to 400 mg twice per day on disease progression. Treatment was discontinued for patients who progressed on 400 mg twice per day. Toxicities and adverse events (AEs) were classified according to Common Terminology Criteria for Adverse Events (CTCAE) version 3.0. Dose interruptions and reductions are described in the Appendix.
Radiographic Evaluation
18F-labeled 2-fluoro-2-deoxy-d-glucose positron emission tomography/computed tomography (PET/CT) studies were obtained before and 1 month following treatment initiation. Metabolic tumor response was classified by using European Organisation for Research and Treatment of Cancer (EORTC) criteria based on thresholds for percent change in maximum standardized uptake value (SUVmax). CT scans of chest, abdomen, and pelvis and magnetic resonance imaging scans of the head were obtained at baseline, after 6 weeks of therapy, and at 2-month intervals. Anatomic tumor response was classified by using RECIST 1.0. Assessments used SUVmax and metabolic volume with 70% threshold region of interest for each lesion, up to a maximum of 10 lesions.
RESULTS
Enrollment occurred at nine medical centers between July 6, 2006, and March 1, 2011. Of 213 patients screened, 25 (11.7%) were treated. Appendix Table A1 (online only) summarizes mutational and amplification status by melanoma type. One treated patient was initially described to have a KIT mutation by PCR but later mass spectroscopy genomic assessment determined that the patient did not harbor a KIT mutation or amplification. Data for this patient are not included in the analyses. The resulting analytic sample size is 24. Note that a two-stage design based on 24 patients has approximately 83% power to detect an RR of at least 20% against a null of 5% while maintaining a one-sided type I error of 11%. Therefore, losing one patient from the analysis did not compromise the power of the study.
Molecular classification of the study population included eight patients (33%) with KIT mutations, 11 (46%) with amplified KIT, and five (21%) with both. Patients with both were classified as having mutation (total 13). Nine patients (73%) were found to have mutations in exon 11: L576P (4), insertion PYD577-582 (1), V559A (1), V560D (1), deletion WKVVE 557-560 (1), and W557R (1). Other mutation sites included exon 17: D820Y (1) and exon 13: K642E (3). For patients who had KIT amplification by qPCR, the median copy number was 8. However, only one patient with KIT amplification by qPCR was confirmed to have high-level KIT amplification by FISH validations. Note that qPCR was used for study screening and FISH was performed retrospectively. Once the study had reached the accrual goal for KIT wild-type but amplified tumors, qPCR was no longer performed during the screening process. Thus, not all patients had both qPCR and FISH testing. One patient with amplified KIT was found after initial progressive disease (PD) to have had poor drug absorption (whole pills were observed in the patient's ostomy output) in the setting of taking a prohibited medication (proton pump inhibitor). Thus, a protocol deviation was obtained to treat an eleventh patient with KIT amplification.
Patients were predominantly female (75%) with M1c disease (63%). The median age was 65 years (range, 42 to 84 years), and the median ECOG performance status was zero (Table 1). Seventeen patients (71%) had mucosal melanoma, six (25%) had acral melanoma, and one had CSD melanoma. All patients had undergone cancer-directed surgery, with seven (29%) receiving radiation treatment, six (25%) chemotherapy, and seven (29%) both. For the 13 patients receiving prior chemotherapy, the median number of therapies was one (range, one to two). There were no statistically significant relationships between mutation status and other characteristics, although patients with KIT-amplified tumors were slightly older.
Table 1.
Demographic and Disease Characteristics and Prior Treatment
| Characteristic | Overall |
Amplified KIT (n = 11) |
Mutated KIT (n = 13) |
P | |||
|---|---|---|---|---|---|---|---|
| No. | % | No. | % | No. | % | ||
| Institution | .34 | ||||||
| Dana-Farber Cancer Institute | 7 | 29.2 | 5 | 45.5 | 2 | 15.4 | |
| Massachusetts General Hospital | 2 | 8.3 | — | — | 2 | 15.4 | |
| Moffitt Cancer Center | 5 | 20.8 | 2 | 18.2 | 3 | 23.1 | |
| University of Chicago | 3 | 12.5 | 1 | 9.1 | 2 | 15.4 | |
| The Angeles Clinic | 2 | 8.3 | 2 | 18.2 | — | — | |
| University of Colorado | 4 | 16.7 | 1 | 9.1 | 3 | 23.1 | |
| MD Anderson Cancer Center | 1 | 4.2 | — | — | 1 | 7.7 | |
| Age, years | .4 | ||||||
| Median | 65 | 69 | 64 | ||||
| Range | 42-84 | 55-84 | 42-80 | ||||
| Sex | .36 | ||||||
| Female | 18 | 75 | 7 | 63.6 | 11 | 84.6 | |
| Male | 6 | 25 | 4 | 36.4 | 2 | 15.4 | |
| Race | .44 | ||||||
| Unknown | 1 | 4.2 | — | — | 1 | 7.7 | |
| White | 19 | 79.2 | 8 | 72.7 | 11 | 84.6 | |
| African American | 1 | 4.2 | 1 | 9.1 | — | — | |
| Asian | 1 | 4.2 | 1 | 9.1 | — | — | |
| Multiracial | 1 | 4.2 | 1 | 9.1 | — | — | |
| Other | 1 | 4.2 | — | — | 1 | 7.7 | |
| Ethnicity | .22 | ||||||
| Hispanic or Latino | 3 | 12.5 | — | — | 3 | 23.1 | |
| Non-Hispanic | 21 | 87.5 | 11 | 100 | 10 | 76.9 | |
| Disease stage | .53 | ||||||
| M1a | 1 | 4.2 | 1 | 9.1 | — | — | |
| M1b | 8 | 33.3 | 4 | 36.4 | 4 | 30.8 | |
| M1c | 15 | 62.5 | 6 | 54.5 | 9 | 69.2 | |
| Melanoma subtype | .24 | ||||||
| Mucosal | 17 | 70.8 | 6 | 54.5 | 11 | 84.6 | |
| Acral | 6 | 25 | 4 | 36.4 | 2 | 15.4 | |
| CSD | 1 | 4.2 | 1 | 9.1 | — | — | |
| ECOG performance status | .99 | ||||||
| 0 | 17 | 70.8 | 8 | 72.7 | 9 | 69.2 | |
| 1 | 7 | 29.2 | 3 | 27.3 | 4 | 30.8 | |
| Site for KIT molecular testing | .99 | ||||||
| Primary | 12 | 50 | 5 | 45.5 | 7 | 53.8 | |
| Metastatic | 12 | 50 | 6 | 54.5 | 6 | 46.2 | |
| Prior radiation | .24 | ||||||
| No | 10 | 41.7 | 3 | 27.3 | 7 | 53.8 | |
| Yes | 14 | 58.3 | 8 | 72.7 | 6 | 46.2 | |
| Prior chemotherapy | .44 | ||||||
| No | 11 | 45.8 | 4 | 36.4 | 7 | 53.8 | |
| Yes | 13 | 54.2 | 7 | 63.6 | 6 | 46.2 | |
| Prior therapies | |||||||
| Median | 1 | 1 | 1 | — | |||
| Range | 1-2 | 1-2 | 1-2 | ||||
NOTE. Percentages are calculated down the columns (within type of mutation). Acral melanoma: six (11.8%; 90% CI, 5% to 22%) of 51 KIT mutations; mucosal melanoma: 15 (14.6%; 90% CI, 9% to 22%) of 103 KIT mutations; chronically sun-damaged (CSD) melanoma: two (3.9%; 90% CI, 1% to 12%) of 51 KIT mutations. P values compare amplified versus mutated KIT.
Abbreviation: ECOG, Eastern Cooperative Oncology Group.
At time of reporting, all patients were off study, with 88% stopping as a result of PD. Median follow-up of living patients was 10.6 months (range, 3.7 to 27.1 months), with 23 (96%) having progressed and 19 (79%) having died (Table 2). In all cases, death was attributed to disease progression. There were no statistical differences in rates of progression or survival by mutational status.
Table 2.
Response and Follow-Up Data
| Response | Overall |
Mutation Status |
Fisher's Exact P | ||||
|---|---|---|---|---|---|---|---|
| Amplified KIT |
Mutated KIT |
||||||
| No. | % | No. | % | No. | % | ||
| Best overall response | 7 | 29.2 | — | — | 7 | 53.8 | |
| PR | .003 | ||||||
| SD | 5 | 20.8 | 2 | 18.2 | 3 | 23.1 | |
| PD | 12 | 50.0 | 9 | 81.8 | 3 | 23.1 | |
| BORR (CR + PR) | .006 | ||||||
| No | 17 | 70.8 | 11 | 100.0 | 6 | 46.2 | |
| Yes | 7 | 29.2 | — | — | 7 | 53.8 | |
| Disease control (CR + PR + SD) | .01 | ||||||
| No | 12 | 50.0 | 9 | 81.8 | 3 | 23.1 | |
| Yes | 12 | 50.0 | 2 | 18.2 | 10 | 76.9 | |
| Progression | 1 | 4.2 | — | — | 1 | 7.7 | |
| No | .99 | ||||||
| Yes | 23 | 95.8 | 11 | 100.0 | 12 | 92.3 | |
| Survival status | 5 | 20.8 | 1 | 9.1 | 4 | 30.8 | |
| Alive | .33 | ||||||
| Dead | 19 | 79.2 | 10 | 90.9 | 9 | 69.2 | |
| Reason off study | 1 | 4.2 | — | — | 1* | 7.7 | |
| Unacceptable toxicity | .99 | ||||||
| Progressive illness | 21 | 87.5 | 10 | 90.9 | 11 | 84.6 | |
| Intercurrent illness | 1 | 4.2 | — | — | 1† | 7.7 | |
| Withdrew consent | 1 | 4.2 | 1 | 9.1 | — | — | |
NOTE. P values compare amplified versus mutated KIT.
Abbreviations: BORR, best overall response rate; CR, complete response; PD, progressive disease; PR, partial response; SD, stable disease.
Patient 2 off study because of grade 3 bleeding/hemorrhage.
Patient 14 ended study participation because of preceding and ongoing issues regarding ostomy strictures.
Response results are described in Table 2. The best overall response rate (BORR) was 29% (two-stage 95% CI, 13% to 51%). Note that RECIST responses were confirmed after 4 weeks except in two cases (BORR was 20.8% when these two patients were excluded). The BORR was significantly greater than the hypothesized null value of 5% (P < .001). There was a highly statistically significant relationship between best overall response and mutational status (Fisher's exact P = .003). BORR was statistically significantly different by mutational status (7 [54%] of 13 had mutated KIT v 0% with amplified KIT; Fisher's exact P = .006). Twelve patients achieved partial response (PR) or stable disease (SD) resulting in a disease control rate (DCR) of 50% (two-stage 95% CI, 29% to 71%). The DCR was significantly related to KIT mutational status (77% mutated v 18% amplified; Fisher's exact P = .01).
All responses observed were in patients with tumors harboring a KIT mutation. In contrast, nine of 12 with PD as best response had KIT-amplified-only tumors. Patients with SD were evenly divided between mutated and amplified. Individual patient data for KIT mutation, PCR, and FISH copy number, TTP, and response are presented in Table 3. There were no statistically significant differences in response, progression, or survival status by melanoma type, although notably, only mucosal primary tumors showed responses (BORR: 41% mucosal v 0% acral or CSD; P = .06).
Table 3.
Patient Molecular Disease Characteristics and Response
| Patient | Sex | Age (years) | Melanoma Type | M Stage | KIT Mutation | PCR Copy Number* | FISH Copy Number† | Months of Treatment | Best Response | Time to Progression (months) | Survival (months) | Survival Status | Sequenom |
|---|---|---|---|---|---|---|---|---|---|---|---|---|---|
| 1 | Female | 79 | Mucosal | M1c | Exon 11 insertion PYD577-582 | N/T | N/T | 6 | PR | 4.7 | 12.9 | Dead | |
| 2 | Female | 61 | Mucosal | M1c | Exon 17 D820Y | 12.25 | 1.5 | 10 | PR | 10.2 | 19.3 | Dead | |
| 3 | Female | 69 | Acral-lentiginous | M1b | 5.96 | 1.3 | 1 | PD | 7.4 | 8.8 | Dead | ||
| 4 | Male | 57 | Chronically sun-damaged | M1c | 16.59 | 1.8 | 3 | PD | 5.0 | 11.5 | Dead | ||
| 5 | Female | 62 | Mucosal | M1c | 7.58 | N/T | 2 | PD | 2.6 | 11.9 | Dead | ||
| 6 | Male | 56 | Acral-lentiginous | M1b | 6.19 | 2.4 | 2 | PD | 3.5 | 4.5 | Dead | ||
| 7 | Male | 69 | Mucosal | M1c | 12.75 | N/T | 4 | PD | 5.8 | 16.2 | Dead | ||
| 8 | Female | 81 | Mucosal | M1c | 7.94 | N/T | 1 | PD | 1.0 | 3.8 | Alive | NRAS G12C | |
| 9 | Female | 72 | Mucosal | M1a | 5.76 | 1.5 | 2 | PD | 1.3 | 9.8 | Dead | ||
| 10 | Female | 55 | Mucosal | M1b | 7.02 | 4.1 | 11 | SD | 10.6 | 18.3 | Dead | ||
| 11 | Female | 59 | Acral-lentiginous | M1c | 6.33 | 2.3 | 1 | PD | 0.9 | 2.8 | Dead | NRAS Q61K | |
| 12 | Female | 59 | Mucosal | M1b | Exon 11 L576P | 11.22 | N/T | 11 | PR | 27.1 | 27.1 | Alive | |
| 13 | Female | 75 | Mucosal | M1b | 5.37 | N/T | 3 | SD | 5.6 | 12.5 | Dead | ||
| 14 | Female | 47 | Mucosal | M1c | Exon 11 L576P | 14.22 | 6.8 | 3 | PR | 2.6 | 7.3 | Dead | |
| 15 | Male | 84 | Acral-lentiginous | M1c | 7.06 | 1 | 2 | PD | 1.6 | 21.8 | Dead | ||
| 16‡ | Female | 53 | Acral-lentiginous | M1b | Exon 11 deletion WKVVE557-560 | N/T | N/T | 11 | SD | 10.6 | 24.3 | Dead | |
| 17 | Female | 75 | Mucosal | M1b | Exon 11 W557R | 2.64 | 1.4 | 3 | PD | 3.9 | 4.8 | Dead | |
| 18 | Male | 52 | Mucosal | M1c | Exon 11 V559A | 4.31 | N/T | 2 | PD | 1.5 | 18.0 | Dead | NRAS Q61H |
| 19 | Male | 66 | Mucosal | M1c | Exon 13 K642E | 8.86 | 1.1 | 2 | PD | 0.9 | 1.5 | Dead | NRAS G12A |
| 20 | Female | 66 | Mucosal | M1c | Exon 11 L576P | 12.25 | 2.6 | 4 | PR | 3.4 | 5.5 | Dead | |
| 21 | Female | 64 | Mucosal | M1c | Exon 11 V560D | N/T | N/T | 5 | PR | 4.5 | 9.1 | Dead | |
| 22 | Female | 42 | Acral-lentiginous | M1b | Exon 11 L576P | N/T | N/T | 3 | SD | 2.7 | 15.4 | Alive | |
| 23‡ | Female | 80 | Mucosal | M1c | Exon 13 K642E | N/T | N/T | 4 | SD | 3.5 | 10.6 | Alive | |
| 24 | Female | 73 | Mucosal | M1c | Exon 13 K642E | N/T | N/T | 8 | PR | 6.6 | 6.6 | Alive |
Abbreviations: FISH, fluorescent in situ hybridization; N/T, not tested; PCR, polymerase chain reaction; PD, progressive disease; PR, partial response; SD, stable disease.
The threshold for increased KIT copy number was set relative to normal samples with the 95% CI according to Chebychev's inequality; the formula used was mean ± (4.47 × standard deviation). The threshold for positive was 5.29 copies of KIT relative to glyceraldehyde 3-phosphate dehydrogenase.
KIT gene copy number was determined in relationship to a chromosome 2 pericentromeric probe, which corresponds to a region rarely subject to gain or loss in melanoma. A sample (or histologically distinctive region) was scored as amplified if the probe:centromere ratio was > 1.50 (highly amplified > 5.0).
Denotes those patients who underwent post-treatment biopsy for evaluation of resistance mechanisms.
Median TTP was 3.7 months (95% CI, 2.6 to 5.6 months). Kaplan-Meier estimates of TTP by mutation and amplification status as well as OS are shown in Figure 1. There was no significant difference in TTP or OS by KIT status (mutated or amplified) or disease site (mucosal v other). Median OS was 12.5 months (95% CI, 8.8 to 18.0 months). Patients received an average of 4 months of treatment (median, 3 months; range, 1 to 11 months). Those with KIT mutations had significantly longer time on treatment compared with those with amplified KIT (Wilcoxon rank sum P = .01).
Fig 1.

Kaplan-Meier curves for clinical efficacy by KIT mutational status. Time to progression (TTP) analysis. (A) All patients showed a median TTP of 3.7 months (95% CI, 2.6 to 5.6 months). (B) Subset TTP analysis showed medians of 3.9 months (95% CI, 2.6 to 6.6 months) in those with mutations and 3.4 months (95% CI, 1.0 to 5.7 months) in those with amplifications. Overall survival (OS) analysis for (C) all patients showed a median of 12.5 months (95% CI, 8.8 to 18.0 months) with (D) subsets showing medians of 12.9 months (95% CI, 5.5 to 24.3 months) for those with mutations and 11.9 months (95% CI, 4.5 to 16.2 months) for those with amplifications.
Dose modifications were allowed on study and included seven dose modifications for PD (400 to 800 mg). For five of the dose increases, the patients continued to experience PD, and in two patients, SD was achieved for 2 months before progression. There were four dose reductions because of toxicity (400 to 300 mg): patient 1 had a best response of PR 2 months after starting treatment, dose reduction at month 3, and was taken off study for disease progression at month 5; patient 2 had a dose modification at month 4, best response of PR at month 6, and was taken off treatment for unacceptable toxicity at month 9. The other two patients had best response of PD in the context of amplified KIT with NRAS mutations.
All patients reported AEs with three patients experiencing grade 4 events and seven patients describing a total of 17 grade 3 events. Grade 3 to 4 AEs are described by KIT molecular status in Appendix Table A2 (online only). The most commonly reported AEs were nausea (n = 17), fatigue (n = 16), anemia (n = 12), hyperglycemia (n = 11), and vomiting (n = 10).
Seventeen patients underwent baseline and follow-up PET/CT. Representative PET/CT showing RECIST and metabolic response is demonstrated in Figure 2. Of 17 patients, four (24%) demonstrated metabolic PD, eight (47%) SD, and five (29%) PR. Response rates, BORR, and DCR compared for metabolic response classification are shown in Appendix Table A3 (online only). There was agreement of classification in 11 (65%) of 17 patients. The metabolic response at 1 month suggested a greater impact from therapy than measurements on conventional cross-sectional imaging. Metabolic response agreed with BORR in 15 (88%) of 17 patients. There were no statistical differences in the proportions of patients who were classified as responders (metabolic, 29% v trial, 29%; McNemar's test P = .99). The DCR according to metabolic response classification was 77% (13 of 17). This was significantly different from observed RECIST DCR (47% [eight of 17]; McNemar's test P = .03), suggesting higher early metabolic response.
Fig 2.

Representative computed tomography and positron emission tomography (PET) study of a responding patient. Cross-sectional axial slices from (A,B) computed tomography images and (C,D) [18F]fluorodeoxyglucose PET ([18F]FDG-PET) images at baseline (left) and after 1 month of therapy (right) show resolution of FDG uptake and decrease in the size of a right inguinal lymph node (gold arrow) and a left perirectal soft tissue nodule (blue arrow).
Additional oncogene mutation screening was performed on pretreatment samples using mass spectroscopy. A panel that detects hotspot mutations across 53 genes, including KIT, BRAF, NRAS, MAP2K1, PIK3CA, GNA11, and GNAQ, was run on all study patients and revealed four patients with NRAS mutation (two with KIT amplification and two with KIT mutations). All four patients had PD as best response. Two other patients who initially experienced a response had a biopsy performed at the time of progression. These samples harbored the same KIT mutations as pretreatment with no additional mutations. One of these (patient 16) did show amplification of KIT copy number after treatment, increasing from 14.2 copies pretreatment to 21.8 copies post-treatment.
DISCUSSION
The fundamental discoveries of BRAF,16 NRAS,17,18 KIT,5,6 GNAQ,19 and GNA1119 activating mutations in melanoma have highlighted its biologic diversity. These have importantly altered melanoma classification based on anatomic site of origin and genomic anomalies. Such classification has striking therapeutic implications.20
Three previously completed phase II studies of imatinib in unselected patients with melanoma failed to demonstrate clinical activity.21–23 Not until genomic alterations in KIT were identified did selection of patients become possible and the clinical efficacy of targeting KIT was demonstrated.24,25 Imatinib targeting KIT melanoma has been reported recently in two other phase II studies. The first study, using 400 mg twice per day, revealed an RR of 16% and median TTP of 3 months.8 The RR was superior with certain KIT mutations or mutant:wild-type allelic ratio greater than one. In the second study (imatinib dosing was the same as in our study), the median progression-free survival was 3.5 months and DCR was 53.5%.26 In nine of 10 patients experiencing a response, a mutation was found in KIT exon 11 or 13. In our study, the overall DCR was 50%, with clear superiority for tumors harboring KIT mutations over amplification. Responses were witnessed only in patients whose tumors had KIT mutations, and the median TTP (3.7 months) was not significantly different between KIT-mutated and KIT-amplified disease. This study included more KIT-amplified patients than did prior reports; it provides definitive evidence that activity of imatinib in a KIT-amplified (without mutation) population is substantially limited. Our study highlights the challenges of screening for KIT amplification, given that results by qPCR were often not confirmed by a complementary FISH method, perhaps reflecting genetic heterogeneity in KIT copy number gains. Our study also confirms the feasibility of imatinib administration in melanoma because the AE profiles of three studies do not vary substantially from that described in GIST.27
The importance of KIT as a therapeutic target has been demonstrated in GIST. Imatinib provides 75% to 90% stable or responsive disease with an 18-month median TTP. The mutational or amplification rate of KIT in melanoma is lower (8.6% to 23.4% melanoma v 75% to 90% GIST) as are the RR and durability. Most KIT mutations in melanoma are observed in exon 11 (similar to GIST) with a preponderance of L576P mutations. This emphasizes the biologic diversity of tumors that may be driven by similar oncogene activation, since additional factors influencing clinical benefit of KIT inhibition between melanoma and GIST must exist. In our study, only patients with mucosal melanoma demonstrated RECIST responses. Although not statistically significant, that suggests the possibility that KIT biology might vary even within different melanoma subtypes. Further studies will be required to examine KIT within these subtypes since KIT inhibitor responsiveness may be dependent on ETV1 expression, similar to GIST,28 although nonresponsive tumors may have different biology entirely. Despite these efficacy differences, recognition of KIT mutations in melanoma has provided novel treatment opportunities for this disease.
Given the low frequency of KIT mutations in melanoma, continued collaborative efforts are required to understand the clinical implications of individual mutations as well as resistance mechanisms. Although therapeutic resistance in GIST primarily involves acquisition of additional KIT mutations,29 resistant mechanisms in melanoma are seemingly more complex. De novo resistance in melanoma may be due to pre-existing mutations in other oncogenes. In our study, four patients had NRAS mutations before treatment. None of these patients had a response or sustained SD to imatinib. These results suggest that MAPK and PI3K pathways both play a role in resistance to KIT targeting in melanoma. This hypothesis is strengthened by cell line models describing both PI3K and MAPK pathways as important downstream outputs of activated KIT in melanoma.30 A separate mass spectroscopy–based screening of 59 KIT-mutant melanoma samples observed no mutations in BRAF and one NRAS exon 2 mutation. It appears that NRAS mutations are a likely cause for primary resistance to KIT targeting in some melanomas. This raises interesting possibilities for future research assessing combinations of KIT inhibitors with inhibitors of MAPK pathway members such as MEK. Little data are currently available regarding acquired resistance. In our study, two patients who experienced an initial response but subsequently progressed were found on mass spectroscopy of post-treatment biopsy to retain the original KIT mutation without a secondary mutation. One of these tumors did show an increase in KIT copy number from 14.2 to 21.8 copies. Thus, increase in amplification of KIT may be a similar phenomenon to that described in BRAF inhibitor resistance.31 This suggests that intermittent high-dose KIT inhibitor therapy or monitoring of drug plasma concentrations, as described in GIST,32 may be of interest to abrogate resistance in the future. Given the diversity in mechanisms of BRAF inhibitor resistance and the lack of secondary KIT mutations, it seems likely that mechanisms of resistance to KIT inhibitors in melanoma will be variable. However, on the basis of our experience, the MAPK pathway would be an obvious starting place for further investigation.
The clinical efficacy of imatinib provides a rationale for patients with primary mucosal, acral, or CSD melanomas to have their tumors tested for KIT mutations. Pharmacologic concerns should also be taken into consideration because drugs of greater potency and specificity could offer an improved therapeutic window and provide improved efficacy for wild-type amplified tumors in addition to those with mutations. Patients should be encouraged to participate in clinical trials testing KIT inhibitors.
Supplementary Material
Acknowledgment
We thank Kim Thoms for technical assistance with the fluorescent in situ hybridization assays.
Appendix
Methods (Statistics)
Differences in baseline demographic and disease characteristics between mutation groups were assessed by using a Wilcoxon rank sum test for continuous variables or Fisher's exact test for categorical variables. Best overall response rate (BORR) and disease control rate (defined as the total of complete response, partial response, and stable disease) are presented with two-stage 95% CIs. The comparison of BORR with hypothesized null rate of 5% was conducted by using exact binomial methods. Differences in response rates or disease control rate by mutation status were assessed by using Fisher's exact test. Time to progression and overall survival were presented by using the method of Kaplan and Meier, with point-wise 95% CIs estimated by using log[-log(survival)] methodology. Equality of survival curves by mutation status was assessed by using the log-rank test. Comparisons between the number of adverse events and months on treatment were performed by using Spearman correlations. Agreement of response and disease control classifications based on metabolic response and Response Evaluation Criteria in Solid Tumors (RECIST) BORR were conducted by using McNemar's test. The relationship between percent change in standardized uptake value and computed tomography longest diameter was assessed by using the Spearman correlation coefficient. All P values are two-sided, with statistical significance defined as P < .05. There were no corrections for multiple comparisons.
Dose Interruptions and Reductions
If grade 2 nonhematologic toxicity was observed, imatinib was held until toxicity resolved to grade ≤ 1. Imatinib was then restarted with no dose reduction. If grade 2 toxicity recurred, imatinib was held until resolution to grade ≤ 1 and then reduced to 300 mg. Therapy was discontinued if grade 2 nonhematologic toxicity recurred. For grade 3 to 4 nonhematologic toxicity, imatinib was withheld until toxicity resolved, and the dose was then reduced to 300 mg on restarting imatinib. If grade 3 to 4 toxicity recurred, therapy was discontinued. For grade 3 to 4 hematologic toxicity, imatinib was held until grade ≤ 2 was achieved. If grade 3 to 4 hematologic toxicity recurred (or lasted ≥ 2 weeks), imatinib was withheld until resolution to grade ≤ 2, and imatinib was restarted at 300 mg. If grade 3 to 4 toxicity recurred following dose reduction, therapy was discontinued.
Adverse Events by KIT Molecular Status
Patients with mutated KIT had a greater number of adverse event (AE) types than patients with amplified KIT (Wilcoxon rank sum P = .02). In subgroup analysis of seven patients with grade 3 to 4 AEs, there was a relationship between number of grade 3 or 4 AEs per patient and the number of months on treatment (Spearman correlation coefficient = 0.77; P = .04). Patients with KIT mutation were more likely to experience dermatologic (69% mutated [nine of 13] v 9% amplified [one of 11]; Fisher's exact P = .005) or gastrointestinal AEs (100% mutated [13 of 13] v 64% amplified [seven of 11]; Fisher's exact P = .03). No other differences in AE incidence by mutation status were noted.
Table A1.
Screening Summary With Row and Column Percents
| Type of Melanoma |
KIT Mutational Status |
|||||||||||
|---|---|---|---|---|---|---|---|---|---|---|---|---|
| Amplified |
Amplified and Mutated |
Mutated |
Neither Amplified nor Mutated |
Unknown |
All |
|||||||
| No. | % | No. | % | No. | % | No. | % | No. | % | No. | % | |
| Screening Summary With Row Percents | ||||||||||||
| Acral | 5 | 9.8 | — | — | 6 | 11.8 | 37 | 72.5 | 3 | 5.9 | 51 | |
| Mucosal | 10 | 9.7 | 5 | 4.9 | 15 | 14.6 | 68 | 66.0 | 5 | 4.9 | 103 | |
| Chronically sun damaged | 6 | 11.8 | — | — | 2 | 3.9 | 36 | 70.6 | 7 | 13.7 | 51 | |
| Not provided | 1 | 12.5 | — | — | — | — | 4 | 50.0 | 3 | 37.5 | 8 | |
| All | 22 | 10.3 | 5 | 2.3 | 23 | 10.8 | 145 | 68.1 | 18 | 8.5 | 213 | |
| Screening Summary With Column Percents | ||||||||||||
| Acral | 5 | 22.7 | — | — | 6 | 26.1 | 37 | 25.5 | 3 | 16.7 | 51 | 23.9 |
| Mucosal | 10 | 45.5 | 5 | 100 | 15 | 65.2 | 68 | 46.9 | 5 | 27.8 | 103 | 48.4 |
| Chronically sun damaged | 6 | 27.3 | — | — | 2 | 8.7 | 36 | 24.8 | 7 | 38.9 | 51 | 23.9 |
| Not provided | 1 | 4.5 | — | — | — | — | 4 | 2.8 | 3 | 16.7 | 8 | 3.8 |
| All | 22 | — | 5 | — | 23 | — | 145 | — | 18 | — | 213 | — |
NOTE. Row percents are calculated within Type of Melanoma. Column percents are calculated within Mutational Status.
Table A2.
Worst Grade of AEs Presented by CTCAE Grade 3 and 4
| Description of AE | Patient No. | Relationship to Treatment | KIT Mutation Status |
|---|---|---|---|
| Life-threatening (grade 4) | |||
| Neutrophils/granulocytes | 1 | Probable | Mutated |
| Hemoglobin | 17 | Probable | Mutated |
| Dyspnea | 19 | Unlikely | Mutated |
| Severe (grade 3) | |||
| Pruritus/itching | 1 | Definite | Mutated |
| Hemoglobin | 2 | Possible | Mutated |
| Leukocytes (total WBC) | 2 | Possible | Mutated |
| Lymphopenia | 2 | Possible | Mutated |
| GI hemorrhage (upper GI, not otherwise specified) | 2 | Unlikely | Mutated |
| Low serum potassium (hypokalemia) | 2 | Possible | Mutated |
| Lymphopenia | 6 | Probable | Amplified |
| Low serum sodium (hyponatremia) | 6 | Unlikely | Amplified |
| Fatigue (asthenia, lethargy, malaise) | 8 | Unknown | Amplified |
| GI obstruction (duodenum) | 12 | Not related | Mutated |
| GI stoma stricture/stenosis (including anastomotic) | 12 | Not related | Mutated |
| Low serum potassium (hypokalemia) | 12 | Not related | Mutated |
| Stomach pain | 12 | Not related | Mutated |
| Extremity pain (limb) | 17 | Not related | Mutated |
| GU obstruction (ureter) | 17 | Unlikely | Mutated |
| Hemoglobin | 19 | Unlikely | Mutated |
| Creatinine | 19 | Not related | Mutated |
NOTE. Adverse events (AEs) that were recorded multiple times for any patient are reported only once in the table according to the worst grade. GI and metabolic AEs occurred most frequently, followed by constitutional symptoms, blood and bone marrow, and pain. AEs are included in the table for all categories of “relatedness,” including “Not related.”
Abbreviations: CTCAE, Common Terminology Criteria for Adverse Events; GU, genitourinary.
Table A3.
Comparison of Metabolic and Anatomic Best Overall Response, Response Rate, and Disease Control Rates
| Metabolic Classification | Observed Best Overall Response |
|||||||
|---|---|---|---|---|---|---|---|---|
| PD |
PR |
SD |
Total |
|||||
| Frequency | % | Frequency | % | Frequency | % | Frequency | % | |
| Metabolic response classification | ||||||||
| PD | 4 | 23.5 | 0 | 0.0 | 0 | 0.0 | 4 | 23.5 |
| PR | 1 | 5.9 | 4 | 23.5 | 0 | 0.0 | 5 | 29.4 |
| SD | 4 | 23.5 | 1 | 5.9 | 3 | 17.7 | 8 | 47.1 |
| Total | 9 | 52.9 | 5 | 29.4 | 3 | 17.7 | 17 | 100.0 |
| Observed Response Rate |
||||||
|---|---|---|---|---|---|---|
| No |
Yes |
Total |
||||
| Frequency | % | Frequency | % | Frequency | % | |
| Metabolic response rate* | ||||||
| No | 11 | 64.7 | 1 | 5.9 | 12 | 70.6 |
| Yes | 1 | 5.9 | 4 | 23.5 | 5 | 29.4 |
| Total | 12 | 70.6 | 5 | 29.4 | 17 | 100.0 |
| Observed Disease Control Rate |
||||||
|---|---|---|---|---|---|---|
| No |
Yes |
Total |
||||
| Frequency | % | Frequency | % | Frequency | % | |
| Metabolic disease-control rate† | ||||||
| No | 4 | 23.5 | 0 | 0.0 | 4 | 23.5 |
| Yes | 5 | 29.4 | 8 | 47.1 | 13 | 76.5 |
| Total | 9 | 52.9 | 8 | 47.1 | 17 | 100.0 |
NOTE. Frequency missing for all = 5.
Abbreviations: PD, progressive disease; PR, partial response; SD, stable disease.
McNemar's test P = .99.
McNemar's test P = .03.
Fig A1.
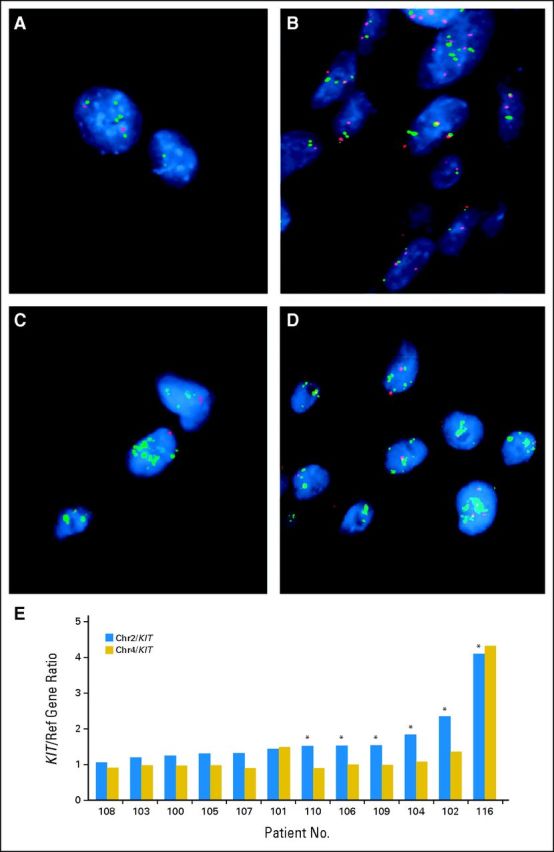
Examples of fluorescent in situ hybridization analyses. Probes were labeled by random octamer priming and hybridized after microwaving and pepsin digestion. Adjacent sections were stained by hematoxylin and eosin to identify tumor-containing regions. The KIT locus on the chromosome 4 (Chr4) long arm was evaluated by using a mini-contig of bacterial artificial chromosome (BAC) probes (digoxigenin-labeled BACs C00-840L10 and RP11-586A2) cohybridized with a biotinylated chromosome 2 (Chr2) centromeric probe, the latter serving as a copy number control, given that the chromosome 2 centromeric region is rarely deleted or gained in melanoma. Signal detection was strepavidin-Alexa598 (red) for the chromosome 2 centromere, and fluorescein isothiocyanate-antidigoxigenin (green) for KIT. Two hundred nuclei were analyzed by using guidelines proposed by Hopman et al (Curr Protoc Cytom Chapter 8:Unit 8.5, 2001). (A,B: patient 102) Both chromosome 4 and KIT were increased (low-level gain of a major part of chromosome 4). Chromosome 2 centromere was not increased (better copy number was a neutral indicator of genome ploidy). A: Chr2, red; KIT, green; B: Chr4, red; KIT, green. (C,D; patient 116) High-level/localized KIT amplification, not extending to chromosome 4 centromere. Both chromosome 2 and chromosome 4 centromeres were informative for copy number reference. C: Chr2, red; KIT, green; D: Chr4, red; KIT, green. (E) Examples of KIT/chromosome 2 and KIT/chromosome 4 ratios.
Footnotes
Processed as a Rapid Communication manuscript. See accompanying editorial on page 3173 and articles on pages 3176 and 3288.
Supported by Novartis, Ron Gelb Melanoma Research Fund at Dana-Farber Cancer Institute (F.S.H.), Veterans Administration Merit Review Grant No. 1I01BX000338-01 (M.C.H.), and Virginia and Daniel K. Ludwig Trust for Cancer Research (G.D.D.). Additional support was provided to G.D.D. and the Dana-Farber/Harvard Cancer Center by the Virginia and Daniel K. Ludwig Trust for Cancer Research.
Authors' disclosures of potential conflicts of interest and author contributions are found at the end of this article.
Clinical trial information: NCT00424515
AUTHORS' DISCLOSURES OF POTENTIAL CONFLICTS OF INTEREST
Although all authors completed the disclosure declaration, the following author(s) and/or an author's immediate family member(s) indicated a financial or other interest that is relevant to the subject matter under consideration in this article. Certain relationships marked with a “U” are those for which no compensation was received; those relationships marked with a “C” were compensated. For a detailed description of the disclosure categories, or for more information about ASCO's conflict of interest policy, please refer to the Author Disclosure Declaration and the Disclosures of Potential Conflicts of Interest section in Information for Contributors.
Employment or Leadership Position: None Consultant or Advisory Role: F. Stephen Hodi, Novartis (C); Christopher L. Corless, Novartis (C); Jonathan A. Fletcher, Novartis (C), Ariad Pharmaceuticals (C); Philip Friedlander, Bristol-Myers Squibb (C), Genentech (C); Jeffrey S. Weber, Novartis (C); Thomas F. Gajewski, Bristol-Myers Squibb (C), Roche/Genentech (C), GlaxoSmithKline (C), Abbvie (C), Jounce Therapeutics (C); Keith T. Flaherty, Novartis (C); Frances A. Collichio, Amgen (C); Michael C. Heinrich, Molecular MD (C), Novartis (C), Pfizer (C); George D. Demetri, Novartis (C), Pfizer (C), Foundation Medicine (C), GlaxoSmithKline (C), ZIOPHARM Oncology (C), sanofi-aventis (C), Johnson & Johnson (C), Merck (C), Amgen (C), N-of-One (U), Champions Biotechnology (C), Kolltan Pharmaceuticals (C), Blueprint Medicines (C) Stock Ownership: Michael C. Heinrich, Molecular MD; George D. Demetri, Kolltan Pharmaceuticals, Blueprint Medicines, Champions Biotechnology Honoraria: Christopher L. Corless, Novartis; Jonathan A. Fletcher, Novartis; Michael C. Heinrich, Novartis, Pfizer Research Funding: F. Stephen Hodi, Novartis, Pfizer; Christopher L. Corless, Novartis; Rene Gonzalez, Novartis; Thomas F. Gajewski, Bristol-Myers Squibb, Roche/Genentech, Eisai, Merck, Incyte; Steven J. O'Day, Novartis; Kevin B. Kim, Novartis; Frances A. Collichio, Amgen, Bristol-Myers Squibb, GlaxoSmithKline, Morphotek, Roche/Genentech; Michael C. Heinrich, Novartis, Bayer Pharmaceuticals, Arog Pharmaceuticals; Jeffrey T. Yap, Novartis; Annick D. Van den Abbeele, Novartis; George D. Demetri, Novartis, Pfizer, GlaxoSmithKline Expert Testimony: George D. Demetri, GlaxoSmithKline (U), Merck (U), Bayer Pharmaceuticals (U) Patents: None Other Remuneration: None
AUTHOR CONTRIBUTIONS
Conception and design: F. Stephen Hodi, Steven J. O'Day, Katherine A. Zukotynski, Annick D. Van den Abbeele, George D. Demetri, David E. Fisher
Provision of study materials or patients: F. Stephen Hodi, Steven J. O'Day, Donald Lawrence
Collection and assembly of data: F. Stephen Hodi, Christopher L. Corless, Meijun Zhu, Philip Friedlander, Rene Gonzalez, Jeffrey S. Weber, Thomas F. Gajewski, Kevin B. Kim, Donald Lawrence, Keith T. Flaherty, Marc S. Ernstoff, Michael C. Heinrich, Carol Beadling, Katherine A. Zukotynski, Jeffrey T. Yap, Annick D. Van den Abbeele
Data analysis and interpretation: F. Stephen Hodi, Christopher L. Corless, Anita Giobbie-Hurder, Jonathan A. Fletcher, Meijun Zhu, Adrian Marino-Enriquez, Thomas F. Gajewski, Steven J. O'Day, Keith T. Flaherty, Jason J. Luke, Frances A. Collichio, Marc S. Ernstoff, Michael C. Heinrich, Katherine A. Zukotynski, Jeffrey T. Yap, Annick D. Van den Abbeele, George D. Demetri
Manuscript writing: All authors
Final approval of manuscript: All authors
REFERENCES
- 1.Mendenhall WM, Amdur RJ, Hinerman RW, et al. Head and neck mucosal melanoma. Am J Clin Oncol. 2005;28:626–630. doi: 10.1097/01.coc.0000170805.14058.d3. [DOI] [PubMed] [Google Scholar]
- 2.Tomicic J, Wanebo HJ. Mucosal melanomas. Surg Clin North Am. 2003;83:237–252. doi: 10.1016/S0039-6109(02)00100-7. [DOI] [PubMed] [Google Scholar]
- 3.Batsakis JG, Suarez P. Mucosal melanomas: A review. Adv Anat Pathol. 2000;7:167–180. doi: 10.1097/00125480-200007030-00006. [DOI] [PubMed] [Google Scholar]
- 4.Stalkup JR, Orengo IF, Katta R. Controversies in acral lentiginous melanoma. Dermatol Surg. 2002;28:1051–1059. doi: 10.1046/j.1524-4725.2002.02082.x. discussion 1059. [DOI] [PubMed] [Google Scholar]
- 5.Curtin JA, Busam K, Pinkel D, et al. Somatic activation of KIT in distinct subtypes of melanoma. J Clin Oncol. 2006;24:4340–4346. doi: 10.1200/JCO.2006.06.2984. [DOI] [PubMed] [Google Scholar]
- 6.Curtin JA, Fridlyand J, Kageshita T, et al. Distinct sets of genetic alterations in melanoma. N Engl J Med. 2005;353:2135–2147. doi: 10.1056/NEJMoa050092. [DOI] [PubMed] [Google Scholar]
- 7.Kong Y, Si L, Zhu Y, et al. Large-scale analysis of KIT aberrations in Chinese patients with melanoma. Clin Cancer Res. 2011;17:1684–1691. doi: 10.1158/1078-0432.CCR-10-2346. [DOI] [PubMed] [Google Scholar]
- 8.Carvajal RD, Antonescu CR, Wolchok JD, et al. KIT as a therapeutic target in metastatic melanoma. JAMA. 2011;305:2327–2334. doi: 10.1001/jama.2011.746. [DOI] [PMC free article] [PubMed] [Google Scholar]
- 9.Handolias D, Salemi R, Murray W, et al. Mutations in KIT occur at low frequency in melanomas arising from anatomical sites associated with chronic and intermittent sun exposure. Pigment Cell Melanoma Res. 2010;23:210–215. doi: 10.1111/j.1755-148X.2010.00671.x. [DOI] [PubMed] [Google Scholar]
- 10.Frost MJ, Ferrao PT, Hughes TP, et al. Juxtamembrane mutant V560GKit is more sensitive to Imatinib (STI571) compared with wild-type c-kit whereas the kinase domain mutant D816VKit is resistant. Mol Cancer Ther. 2002;1:1115–1124. [PubMed] [Google Scholar]
- 11.Jiang X, Zhou J, Yuen NK, et al. Imatinib targeting of KIT-mutant oncoprotein in melanoma. Clin Cancer Res. 2008;14:7726–7732. doi: 10.1158/1078-0432.CCR-08-1144. [DOI] [PubMed] [Google Scholar]
- 12.Thomas NE, Kricker A, From L, et al. Associations of cumulative sun exposure and phenotypic characteristics with histologic solar elastosis. Cancer Epidemiol Biomarkers Prev. 2010;19:2932–2941. doi: 10.1158/1055-9965.EPI-10-0686. [DOI] [PMC free article] [PubMed] [Google Scholar]
- 13.Beadling C, Heinrich MC, Warrick A, et al. Multiplex mutation screening by mass spectrometry evaluation of 820 cases from a personalized cancer medicine registry. J Mol Diagn. 2011;13:504–513. doi: 10.1016/j.jmoldx.2011.04.003. [DOI] [PMC free article] [PubMed] [Google Scholar]
- 14.Beadling C, Jacobson-Dunlop E, Hodi FS, et al. KIT gene mutations and copy number in melanoma subtypes. Clin Cancer Res. 2008;14:6821–6828. doi: 10.1158/1078-0432.CCR-08-0575. [DOI] [PubMed] [Google Scholar]
- 15.Heinrich MC, Corless CL, Demetri GD, et al. Kinase mutations and imatinib response in patients with metastatic gastrointestinal stromal tumor. J Clin Oncol. 2003;21:4342–4349. doi: 10.1200/JCO.2003.04.190. [DOI] [PubMed] [Google Scholar]
- 16.Davies H, Bignell GR, Cox C, et al. Mutations of the BRAF gene in human cancer. Nature. 2002;417:949–954. doi: 10.1038/nature00766. [DOI] [PubMed] [Google Scholar]
- 17.Fecher LA, Cummings SD, Keefe MJ, et al. Toward a molecular classification of melanoma. J Clin Oncol. 2007;25:1606–1620. doi: 10.1200/JCO.2006.06.0442. [DOI] [PubMed] [Google Scholar]
- 18.Berger MF, Garraway LA. Applications of genomics in melanoma oncogene discovery. Hematol Oncol Clin North Am. 2009;23:397–414. doi: 10.1016/j.hoc.2009.03.005. [DOI] [PMC free article] [PubMed] [Google Scholar]
- 19.Van Raamsdonk CD, Bezrookove V, Green G, et al. Frequent somatic mutations of GNAQ in uveal melanoma and blue naevi. Nature. 2009;457:599–602. doi: 10.1038/nature07586. [DOI] [PMC free article] [PubMed] [Google Scholar]
- 20.Flaherty K. Advances in drug development: BRAF validation in melanoma. Clin Adv Hematol Oncol. 2010;8:31–34. [PubMed] [Google Scholar]
- 21.Wyman K, Atkins MB, Prieto V, et al. Multicenter Phase II trial of high-dose imatinib mesylate in metastatic melanoma: Significant toxicity with no clinical efficacy. Cancer. 2006;106:2005–2011. doi: 10.1002/cncr.21834. [DOI] [PubMed] [Google Scholar]
- 22.Kim KB, Eton O, Davis DW, et al. Phase II trial of imatinib mesylate in patients with metastatic melanoma. Br J Cancer. 2008;99:734–740. doi: 10.1038/sj.bjc.6604482. [DOI] [PMC free article] [PubMed] [Google Scholar]
- 23.Ugurel S, Hildenbrand R, Zimpfer A, et al. Lack of clinical efficacy of imatinib in metastatic melanoma. Br J Cancer. 2005;92:1398–1405. doi: 10.1038/sj.bjc.6602529. [DOI] [PMC free article] [PubMed] [Google Scholar]
- 24.Hodi FS, Friedlander P, Corless CL, et al. Major response to imatinib mesylate in KIT-mutated melanoma. J Clin Oncol. 2008;26:2046–2051. doi: 10.1200/JCO.2007.14.0707. [DOI] [PubMed] [Google Scholar]
- 25.Lutzky J, Bauer J, Bastian BC. Dose-dependent, complete response to imatinib of a metastatic mucosal melanoma with a K642E KIT mutation. Pigment Cell Melanoma Res. 2008;21:492–493. doi: 10.1111/j.1755-148X.2008.00475.x. [DOI] [PubMed] [Google Scholar]
- 26.Guo J, Si L, Kong Y, et al. Phase II, open-label, single-arm trial of imatinib mesylate in patients with metastatic melanoma harboring c-Kit mutation or amplification. J Clin Oncol. 2011;29:2904–2909. doi: 10.1200/JCO.2010.33.9275. [DOI] [PubMed] [Google Scholar]
- 27.Demetri GD, von Mehren M, Blanke CD, et al. Efficacy and safety of imatinib mesylate in advanced gastrointestinal stromal tumors. N Engl J Med. 2002;347:472–480. doi: 10.1056/NEJMoa020461. [DOI] [PubMed] [Google Scholar]
- 28.Chi P, Chen Y, Zhang L, et al. ETV1 is a lineage survival factor that cooperates with KIT in gastrointestinal stromal tumours. Nature. 2010;467:849–853. doi: 10.1038/nature09409. [DOI] [PMC free article] [PubMed] [Google Scholar]
- 29.Gounder MM, Maki RG. Molecular basis for primary and secondary tyrosine kinase inhibitor resistance in gastrointestinal stromal tumor. Cancer Chemother Pharmacol. 2011;67(suppl 1):S25–S43. doi: 10.1007/s00280-010-1526-3. [DOI] [PMC free article] [PubMed] [Google Scholar]
- 30.Todd JR, Scurr LL, Becker TM, et al. The MAPK pathway functions as a redundant survival signal that reinforces the PI3K cascade in c-Kit mutant melanoma. Oncogene. doi: 10.1038/onc.2012.562. [epub ahead of print on December 17, 2012] [DOI] [PubMed] [Google Scholar]
- 31.Shi H, Moriceau G, Kong X, et al. Melanoma whole-exome sequencing identifies (V600E)B-RAF amplification-mediated acquired B-RAF inhibitor resistance. Nat Commun. 2012;3:724. doi: 10.1038/ncomms1727. [DOI] [PMC free article] [PubMed] [Google Scholar]
- 32.Demetri GD. Therapeutic monitoring of drug plasma concentrations and improved clinical outcomes in GIST. Clin Adv Hematol Oncol. 2009;7:S6–S7. [PubMed] [Google Scholar]
Associated Data
This section collects any data citations, data availability statements, or supplementary materials included in this article.