

Abstract
Colorectal cancer (CRC) is the third most common cancer world-wide with 1.2 million patients diagnosed yearly. In late stage CRC, the most commonly used targeted therapies are monoclonal antibodies cetuximab and panitumumab, which inactivate EGFR1. Recent studies have identified alterations in KRAS2–4 and other genes5–13 as likely mechanisms of primary and secondary resistance to anti-EGFR antibody therapy. Despite these efforts, additional mechanisms of resistance to EGFR blockade are thought to be present in CRC and little is known about determinants of sensitivity to this therapy. To examine the effect of somatic genetic changes in CRC on response to anti-EGFR antibody therapy, we performed complete exome sequence and copy number analyses of 129 patient-derived tumorgrafts and targeted genomic analyses of 55 patient tumors, all of which were KRAS wild-type. We analyzed the response of tumors to anti-EGFR antibody blockade in tumorgraft models or in clinical settings. In addition to previously identified genes, we detected mutations in ERBB2, EGFR, FGFR1, PDGFRA, and MAP2K1 as potential mechanisms of primary resistance to this therapy. Novel alterations in the ectodomain of EGFR were identified in patients with acquired resistance to EGFR blockade. Amplifications and sequence changes in the tyrosine kinase receptor adaptor gene IRS2 were identified in tumors with increased sensitivity to anti-EGFR therapy. Therapeutic resistance to EGFR blockade could be overcome in tumorgraft models through combinatorial therapies targeting actionable genes. These analyses provide a systematic approach to evaluate response to targeted therapies in human cancer, highlight new mechanisms of responsiveness to anti-EGFR therapies, and provide new avenues for intervention in the management of CRC.
To examine genetic alterations that affect response to anti-EGFR therapy, we selected 137 CRCs from liver metastases that were KRAS wild-type as determined by Sanger sequencing (Supplementary Table 1). To elucidate genetic alterations in these cancers, we enriched for neoplastic cells using patient-derived tumorgrafts and performed exome sequencing of tumorgraft and matched normal DNA (Supplementary Tables 1–2). This approach identified sequence changes and copy number alterations in >20,000 genes with an average coverage within the target regions of nearly 150-fold for each sample (Supplementary Tables 3–4).
Sequence analyses of 135 of 137 tumors identified a median of 117 somatic mutations in each cancer. Two tumors displayed an elevated number of somatic alterations (2979 and 2480 changes per exome), consistent with a mutator phenotype. Common CRC driver genes were identified at expected frequencies in the tumors analyzed (Supplementary Tables 3–5). Eight tumors were identified as having KRAS alterations that were not initially detected by Sanger sequencing and were excluded from further analysis, resulting in 129 KRAS wild-type tumors.
To evaluate whether identified alterations were associated with resistance to EGFR inhibitors, we determined tumorgraft response to cetuximab therapy for 116 of the 129 KRAS wild-type CRCs (Figs. 1, 2). The volume of each tumorgraft was evaluated at three and six weeks and tumors were categorized as showing disease progression, regression, or stabilization. Among tumorgrafts with disease progression (increase in tumor volumes over 35%) or suboptimal stabilization (increase in tumor volumes between 20 and 35%), we detected alterations in all genes known to be involved in EGFR therapeutic resistance: NRAS codon 12 or 61 mutations (7 cases), BRAF V600E mutation (3 cases), MET amplification (3 cases), and ERBB2 amplification (4 of 5 cases). Additionally, 3 of 4 tumors with alterations in exon 20 of PIK3CA and 4 of 5 tumors with protein truncating or homozygous deletions of PTEN were resistant to anti-EGFR blockade.
Figure 1. Schematic diagram of integrated genomic and therapeutic analyses.
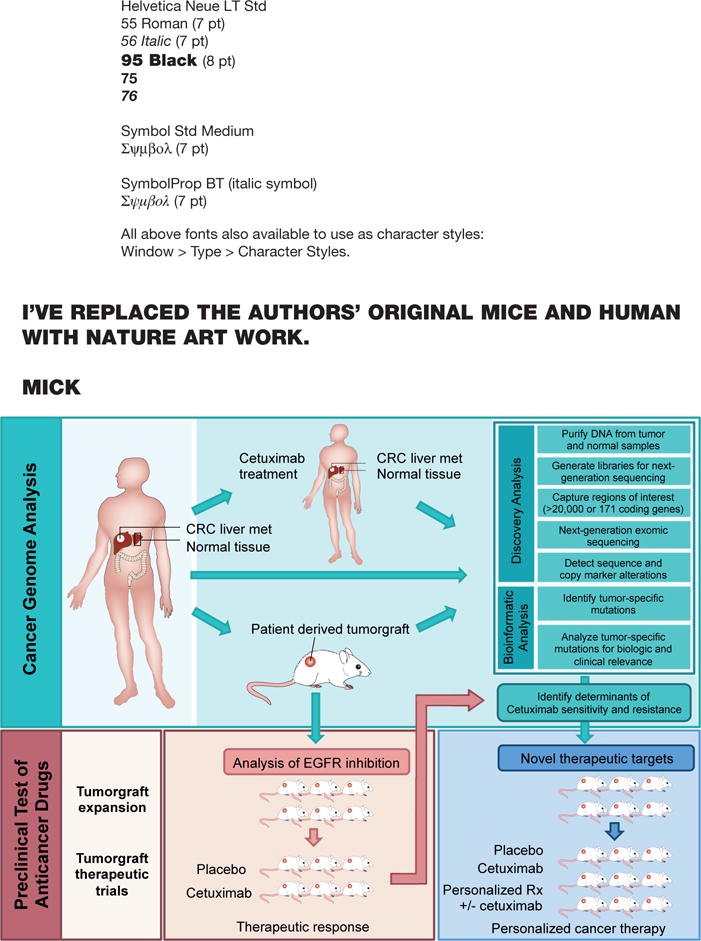
To examine the effect of genomic alterations on sensitivity to anti-EGFR blockade, we performed whole exome and copy number analyses of 129 early passage tumorgrafts and targeted analyses of 55 patient tumors, all of which were KRAS wild-type (top box). Twenty-two of tumorgrafts were from patients that had been previously treated with anti-EGFR therapy. 116 of these tumorgrafts were evaluated for response to cetuximab in preclinical therapeutic trials (bottom left box). Integration of genomic and therapeutic information was used to identify candidate resistance and response genes, and to design preclinical trials using novel compounds to overcome resistance to EGFR blockade (bottom right box).
Figure 2. Effect of cetuximab treatment on growth of colorectal tumors with different somatic alterations.
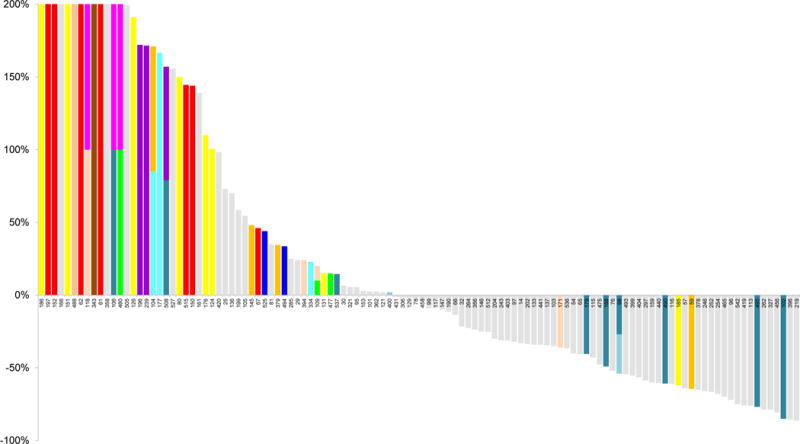
Waterfall plot of tumor volume changes after cetuximab treatment, compared with baseline, in 116 KRAS wild-type tumorgrafts. Alterations related to therapeutic resistance or sensitivity are shown in the indicated colors (complete list of alterations are in Tables S3, S4 and S6). For the following genes a subset of alterations are indicated: MET amplification; FGFR1 amplification; PDGFRA kinase domain mutations; BRAF V600 hotspot mutations; PTEN homozygous deletion or truncating mutations; PIK3CA exon 20 mutations; EGFR ecto- and kinase domain mutations and amplifications. The maximum threshold for tumor growth was set at 200%.
We evaluated potential mechanisms of resistance that have not been previously described in CRC. We focused on cell surface receptors or members of the EGFR signaling pathway to identify candidate genes that were altered in therapy-resistant tumors (Fig. 2, Extended Data Fig. 1; Supplementary Tables 3–4). We observed point mutations affecting the ERBB2 kinase domain, including in two tumors with the same change at V777L and another tumor harboring an L866M mutation, as well as a sequence change in the ectodomain at S310Y, all of which correlated with cetuximab resistance. Although amplification of ERBB2 has been reported in CRCs9,10,14, sequence alterations of this gene have not been linked to therapeutic resistance to anti-EGFR blockade. These data suggest that somatic mutations in ERBB2 may provide an alternative mechanism for ERBB2 pathway activation that is complementary to ERBB2 amplification in CRC. Similarly, we found sequence alteration in the kinase domain of EGFR (V843I) in one case that showed tumor growth in the presence of cetuximab. Although EGFR kinase alterations are rare in CRC15,16, the observed case suggests that in principle such changes may provide a mechanism of resistance to anti-EGFR therapy.
We identified alterations in additional protein kinase receptors in tumors resistant to cetuximab treatment: amplification of the fibroblast growth factor receptor FGFR1 and sequence alterations in the platelet-derived growth factor receptor PDGFRA. Each of these was altered in four of the 129 CRC samples analyzed (8 samples total, 6%). FGFR1 is a known driver in human cancers17 and has been reported to be amplified in different tumor types. PDGFRA is a tyrosine kinase receptor that is known to be mutated in gastro-intestinal stromal tumors18. The detected sequence alterations in PDGFRA, including a mutation that affected the same residue in two different patients (R981H), were all located in or near the catalytic domain of the protein. Similar to ERBB2 and MET, the receptors encoded by these genes transmit signals through the RAS/MEK cascade and when mutated can lead to constitutive activation of oncogenic pathways17,19.
We further examined candidate alterations within the RAS pathway and observed a K57R change in the mitogen activated protein kinase gene MAP2K1 in a cetuximab-resistant case. Alterations of MAP2K1 at the same or nearby residues have been previously described in various cancers, are adjacent to the catalytic domain, and have been shown to confer IL-3-independent cell growth in vitro, suggesting that this mutation may be functionally active20. Overall, the enrichment of mutations in these pathways in the resistant tumorgrafts was statistically significant (p<0.001, Welch Two Sample t-test) and suggests that alterations in any of these members may be sufficient to render cells insensitive to EGFR inhibition.
To extend the observations, we analyzed 65 cetuximab-naïve samples from patients who were subsequently treated with anti-EGFR therapy as part of clinical trials or standard of care. We detected coding alterations in genes known to be involved in EGFR therapeutic resistance, including KRAS, NRAS, BRAF, PIK3CA and PTEN sequence mutations, and amplification of MET and ERBB2 (total of 25 cases with mutation in at least one resistance gene). In the remaining 40 cases, we confirmed observations of alterations in several genes with novel resistance mechanisms, including sequence changes in ERBB2 and PDGFRA (Supplementary Tables 1–3).
Although some tumors respond to cetuximab, virtually all CRC patients develop disease recurrence. In our analyses, 22 tumors were from patients that received cetuximab within six months prior to resection (Supplementary Table 1). We examined whether alterations in these cases may have arisen as acquired (secondary) resistance to therapy. Two of these 22 tumors had somatic sequence changes in EGFR (G465R or G465E) affecting domain III of the extracellular portion of the receptor. Structural analyses suggested that these mutations were likely to affect cetuximab binding as they were located at the interface of EGFR – cetuximab interaction (Fig. 3A, Extended Data Fig. 2). Interestingly, G465 is structurally adjacent to residue S492 that has been shown, when altered, to interfere with cetuximab binding11 (Fig. 3A). We sequenced pre- and post-therapy specimens for the two patients (CRC104 and CRC177) whose tumors harbored the ectodomain mutations. In both cases, we confirmed the EGFR mutations in the post-cetuximab metastases while the original pre-treatment specimens did not have detectable alterations (Fig. 3B–C).
Figure 3. Genetic alterations involved in secondary resistance to anti EGFR therapy.
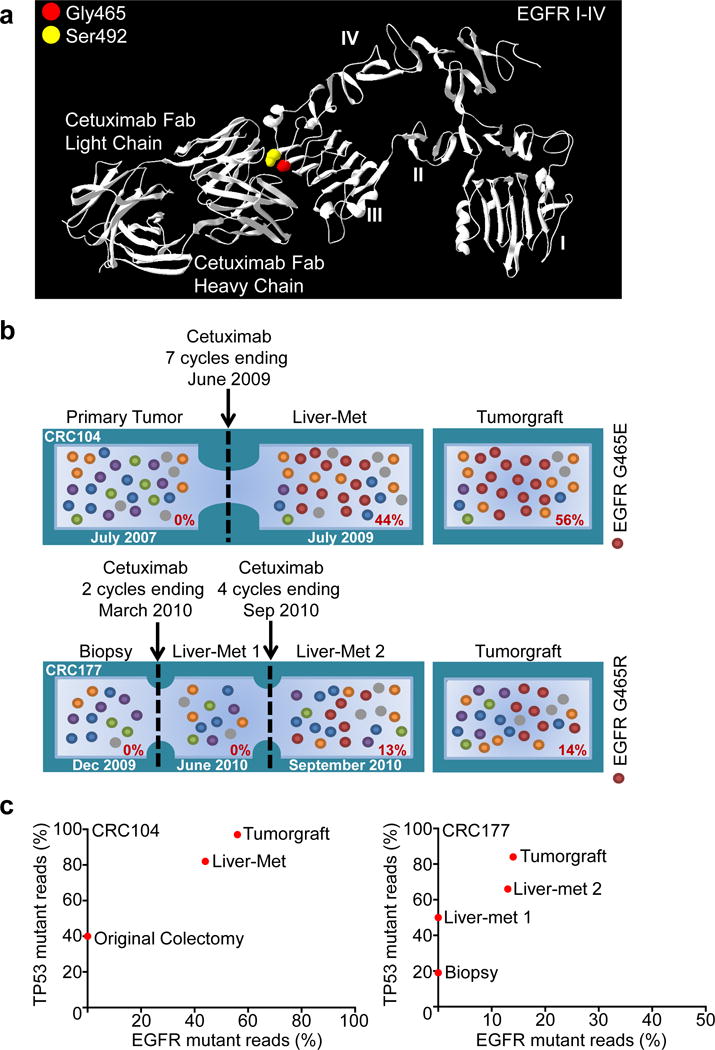
a, The location of mutations in EGFR ectodomain are shown including G465 (red) and the S492 residue known to confer cetuximab resistance11 (yellow). b, Evolution of EGFR mutations in two CRCs with acquired resistance to cetuximab. Cetuximab-naïve samples were sequenced to investigate the presence of EGFR G465 mutations (red) prior to treatment. For each sample, the fraction of mutant tags is indicated. c, As a control for tumor cellularity, for each lesion the fraction of TP53 mutant reads (vertical axis) was plotted against the fraction of reads with EGFR ectodomain mutations (horizontal axis).
Among CRC patients with KRAS wild-type tumors, only 12–17% have durable responses to anti-EGFR monotherapy4,6. We wondered whether such responses may be due to alterations in genes that confer therapeutic sensitivity. EGFR was found to be amplified in two tumors that showed either regression (CRC98, 26 fold amplified) or disease stabilization (CRC400, 3 fold amplified) (Fig. 2) consistent with previous observations21,22. Given the importance of EGFR signaling in CRC, we analyzed other pathway members that were preferentially mutated in responsive tumors and identified IRS2, a cytoplasmic adaptor that mediates signaling between receptor tyrosine kinases and downstream targets (Fig. 2., Supplementary Table 6) (p<0.05, Welch Two Sample t-test). IRS2 had amplifications or sequence alterations in 7 tumors (10%) that showed increased sensitivity or stable disease when treated with cetuximab. Expression analyses of 100 CRC tumorgrafts with wild-type KRAS, NRAS, BRAF, and PIK3CA identified increased IRS2 levels as a significant predictor of cetuximab sensitivity (Extended Data Fig. 3). A few tumors that were not responsive to cetuximab harbored IRS2 alterations together with known resistance changes including those in MET or BRAF. These observations suggest that IRS2 mutations may predict anti-EGFR sensitivity in cases without other mechanisms of resistance to EGFR therapy. We and others have previously identified alterations in IRS2 in CRCs and other tumor types, but no reports to date have linked the effects of these alterations to therapeutic sensitivity14,23.
To evaluate the role of these novel alterations, we performed functional assays in NCI-H508, a cetuximab-sensitive CRC cell line that does not harbor known resistance-conferring mutations24,25 and displays a 3-fold gene copy number gain of the IRS2 gene (Supplementary Tables 3–4). We found that ectopic introduction of either EGFR G465E or MAP2K1 K57N into NCI-H508 cells induced resistance to EGFR inhibition and increased activation of downstream signals, which were not affected by EGFR blockade (Extended Data Fig. 4A–B). Conversely, knockdown of IRS2 by short hairpin RNA (shRNA) resulted in reduced sensitivity to cetuximab and less pronounced activation of ERK and AKT following ligand stimulation (Extended Data Fig. 4C). This is consistent with the role of IRS2 as a scaffold/adaptor protein that amplifies signals downstream from tyrosine kinase receptors.
Given the poor outcome of patients diagnosed with late stage CRC, we investigated whether mutant genes observed in individual cases may be clinically actionable using existing or investigational therapies. We identified somatic alterations with potentially actionable consequences in 100 of the 129 patients (77%) (Supplementary Table 7). To test whether any of the identified alterations may be successfully targeted in tumors with cetuximab resistance, we used the tumorgrafts to perform proof-of-principle trials for targeted therapies and evaluated the signaling consequences of these therapies in vivo (Fig. 4 and Extended Data Fig. 5–10). We chose a cetuximab-resistant tumor with FGFR1 amplification (CRC477) and examined whether inhibition of both FGFR1 and EGFR would be more effective than inhibition of EGFR alone. We confirmed resistance to cetuximab alone and, as may be expected using a single inhibitor, the tumorgraft was also resistant to monotherapy with the selective FGFR kinase inhibitor BGJ398, which is currently in clinical trials (Fig. 4A). However, combination of BGJ398 with cetuximab led to a substantial and durable suppression of tumor growth in all treated mice. This model confirmed that combinatorial therapies may be effective in overcoming EGFR therapeutic resistance in tumors with alterations in other cell surface receptors.
Figure 4. Therapeutic intervention in preclinical trials to overcome resistance to anti-EGFR antibody blockade.
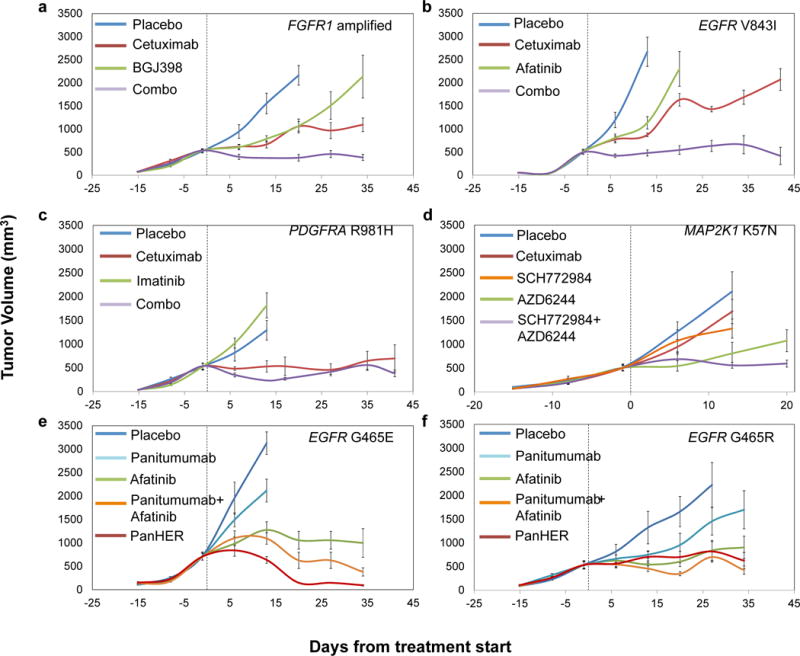
Tumor growth curves in tumorgraft cohorts from individual patients with a, FGFR1 amplification (CRC477) b, EGFR kinase mutation (CRC334) c, PDGFRA R981H mutation (CRC525) d, MAP2K1 K57N mutation (CRC343) and e, f, EGFR ectodomain mutations (e, CRC104 and f, CRC177) treated with placebo or targeted treatments. Mean tumor volumes ± standard error of the mean are shown (n = 5 mice per group for CRC525 and CRC177 and n = 6 mice per group for all other models). a, b, combo versus cetuximab, P < 0.01; c, combo versus cetuximab, not significant; d, SCH772984+AZD6244 versus either monotherapy, P < 0.01; e, f, afatinib, Pan-HER or panitumumab+afatinib versus panitumumab, P < 0.01. Statistical analyses was performed by two-way ANOVA.
An analogous approach was used to evaluate the EGFR small-molecule inhibitor afatinib in tumor CRC334 containing sequence change V843I in the protein kinase domain of EGFR. Similar to our observations for FGFR1 targeting, treating tumorgrafts with afatinib or cetuximab alone was not effective but the combination resulted in marked and long lasting tumor growth inhibition (Fig. 4B). We also found that combinations of MEK and ERK inhibitors in tumorgraft CRC343 (MAP2K1 K57N), and the PDGFR inhibitor imatinib and cetuximab in tumorgraft CRC525 (PDGFRA R981H), exerted strong antitumor activities (Fig. 4C and D), although the effect was short-lived in the PDGFRA mutant tumor. Targeting of ERBB2 mutations in cetuximab-resistant CRC tumorgrafts has been recently demonstrated using dual HER2-targeted therapy in a separate study (Kavuri SM et al., in press). Consistent with the observed higher efficacy of combination therapies, we found that the impact of therapies on downstream signals was stronger when tumors were targeted by drug combinations compared with single-agent treatments (Extended Data Fig. 5–10).
Next, we evaluated alternative therapeutic approaches in tumors with secondary cetuximab-resistant alterations in the EGFR ectodomain. Although previous reports have shown that cetuximab-resistant tumors with S492R alterations in EGFR are sensitive to panitumumab11, tumorgrafts with EGFR G465E mutation were poorly sensitive to panitumumab (Fig. 4E). Structural analyses indicate that the S492 residue is in the cetuximab binding site within EGFR domain III while G465 is located in the center of the region in which the epitopes of both antibodies overlap26 (Extended Data Fig. 2). This lack of sensitivity was not due to absence of EGFR dependence as kinase inhibition of EGFR using afatinib resulted in reduction of tumor growth (Fig. 4E). To explore whether EGFR inhibition by antibodies targeting epitopes far from G465 might overcome resistance we used Pan-HER (Symphogen), a monoclonal antibody mixture that binds EGFR epitopes different from those recognized by cetuximab and panitumumab27 (Extended Data Fig. 2). Similar results using Pan-HER were observed in CRC177 with EGFR G465R mutation (Fig. 4F).
Our genomic analyses have detected essentially all previously known mechanisms of resistance to cetuximab in CRC. The results identified novel candidate mechanisms of primary and secondary resistance through alterations affecting EGFR, its downstream signaling pathway, and other cell surface receptors (Extended Data Fig. 1). These alterations, together with KRAS, comprise over three quarters of cetuximab resistant tumors and suggest that the vast majority of mechanisms of primary resistance have now been determined and can be identified prior to the initiation of anti-EGFR treatment.
Some of the mechanisms of resistance to EGFR therapy provide new avenues for intervention, including amplification of FGFR1 and mutations of PDGFR1, ERBB2, and MAP2K1. As we have shown, combinations of therapies targeting both the protein products encoded by resistance genes as well as EGFR or other signaling partners are likely to be crucial for inhibiting the multiple genetic components within a tumor. Although combinatorial treatments in tumorgrafts often led to arrest of tumor growth rather than regression, disease stabilization is prognostically relevant and is the most common consequence of EGFR-targeted therapies in responsive CRC patients4. The high fraction of tumors with actionable alterations suggests that additional combinatorial therapies may be clinically useful for CRC patients.
An unexpected finding was the identification of IRS2 alterations as a novel mechanism of sensitivity to anti-EGFR therapy. Our genetic and functional data suggest that IRS2 alterations may identify tumors that are dependent on receptor signaling and therefore sensitive to its therapeutic inhibition. Consistent with this prediction are reports that IRS2 amplification is a significant indicator of response to the IGF1R inhibitor figitumumab in colorectal and lung cancer cell lines28. Given the interaction of IRS2 with multiple cell surface receptors, we would predict that combinatorial inhibition of these receptors in tumors with IRS2 alterations may provide additional avenues of intervention in such patients.
This study highlights information that may be obtained through the integration of large-scale genomic and targeted therapeutic analyses in CRC and provide an unprecedented view into mechanisms of sensitivity as well as primary and secondary resistance to EGFR blockade. This information provides a framework for analysis of responses to targeted therapies in CRC and suggests interventional clinical trials using combinatorial therapies based on potentially actionable alterations.
Methods
Specimens obtained for sequencing analysis
The study population consisted of matched tumor and normal samples from 137 colorectal cancer patients that underwent surgical resection of liver metastases at the Candiolo Cancer Institute (Candiolo, Torino, Italy), the Mauriziano Umberto I Hospital (Torino) and the San Giovanni Battista Hospital (Torino) from 2008–2012. Informed consent for research use was obtained from all patients at the enrolling institution prior to tissue banking and study approval was obtained from the ethics committees of the three centers. Tumors with KRAS alterations at codons 12, 13 and 61 that were detected using Sanger sequencing were not included in the study. From the resected tumor samples, tumorgraft models were established as described below. Following exome sequence analyses, 8 tumorgrafts were detected to have KRAS mutations (patients CRC18, CRC58, CRC68, CRC237, CRC312, CRC328, CRC344, CRC382) and were excluded from further analyses. To assess genomic similarity between tumorgrafts and the tumors from which they were derived, 18 pre-implantation liver metastases were analyzed through targeted next generation sequencing and compared to the corresponding tumorgrafts. Pathological analyses showed that tumor cellularity of the metastatic samples ranged from 15% to 90% (average 59%), supporting the need for enrichment of tumor cells through growth of tumorgrafts. Targeted next generation sequencing revealed that all the clonal alterations identified in these tumorgrafts were present in the tumors from which they were derived (Supplementary Table 3), similar to previous comparisons of tumorgrafts and primary tumors in CRC29. To extend observations of alterations in resistance mechanisms that we have identified in tumorgrafts, an additional 65 patient-derived cetuximab-naïve clinical samples from patients who were subsequently treated with EGFR blockade through standard of care or various clinical trials including NCT00113763, NCT00891930, NCT00113776, and NCT0112645030 were analyzed through targeted genomic analyses (Supplementary Table 9). Available clinical information for all samples is shown in Supplementary Table 2.
Tumorgraft models and in vivo treatments
Tissue from hepatic metastasectomy in affected individuals was fragmented and either frozen or prepared for implantation as described previously9,31. NOD/SCID (nonobese diabetic/severe combined immunodeficient) female mice (4 to 6 weeks old) were used for tumor implantation. Nucleic acids were isolated from early passaged tumorgrafts. The remaining tumorgraft material was further passaged and expanded into treatment groups. The size of the animal groups (n = 5–6) and schedule of measurements (1 measurement at baseline and 5 sequential weekly measurements on treatment) were calculated to detect a difference of tumor volumes between mice treated with monotherapy and mice treated with combination therapies. Therefore, 3 comparisons were considered as primary objective for each experiment. To preserve a family-wise error of 5% (1 side), a Bonferroni correction was applied and a type 1 error of 0.017 for each of the three comparisons was considered. This resulted in a power of 80% to detect a standardized comparison of 0.70. Animals with established tumors defined as an average volume of 400 mm3 were treated with vehicle or drug regimens, either as a single-agent or in combination as indicated: cetuximab (Merck, White House Station, NJ) 20 mg/kg/twice-weekly i.p.; BGJ398 (Sequoia Research Products, Pangbourne, United Kingdom), 30 mg/kg/once-daily by oral gavage; imatinib (Sequoia Research Products), 100 mg/kg/once-daily by oral gavage; panitumumab (Amgen, Thousand Oaks, CA), 20 mg/kg/twice-weekly i.p.; afatinib (Sequoia Research Products), 20 mg/kg/once-daily by oral gavage; AZD6244 (Sequoia Research Products), 25 mg/kg/once-daily by oral gavage; SCH772984 (ChemieTek, Indianapolis, IN), 75 mg/kg/once daily i.p.; Pan-HER (Symphogen), 60 mg/kg twice-weekly i.p. To evaluate sensitivity to cetuximab monotherapy, each tumorgraft was evaluated at three and six weeks in 12 or 24 mice (depending on individual models) that were randomized to treatment and control arms at a 1:1 ratio. For assessment of tumor response to therapy, we used volume measurements normalized to the tumorgraft volume at the time of cetuximab treatment initiation. Tumorgrafts were classified as follows: (i) tumor regression with a decrease of at least 35% in tumor volume (39 cases, 34%), (ii) disease progression with at least a 35% increase in tumor volume (36 cases, 31%), and (iii) disease stabilization with a tumorgraft volume at levels <35% growth and <35% regression (41 cases, 35%). Tumors displaying regression or stabilization continued treatment for additional 3 weeks. Tumor size was evaluated once per week by caliper measurements and the approximate volume of the mass was calculated. Statistical significance for tumor volume changes was calculated using mixed-design ANOVA (repeated measures) when all mice were available for measurements in each treatment group at each timepoint, and two-way ANOVA when one or more mice died accidentally over the course of the experiments. Results were considered interpretable when at least half of mice per treatment group (n = 3) survived until the pre-specified endpoints (minimum, 3 weeks of treatment). All mice alive at endpoint were included in the analysis (CRC477: 6 mice treated with placebo or cetuximab, 4 mice treated with BGJ398, 3 mice treated with cetuximab + BGJ398; CRC334: 5 mice treated with cetuximab + afatinib, 6 mice per treatment group in all other arms; CRC525: 5 mice per treatment group in all arms; CRC343: 5 mice treated with AZD6244 + SCH772984, 6 mice per treatment group in all other arms; CRC104: 4 mice treated with panitumumab + afatinib, 6 mice per treatment group in all other arms; CRC177: 5 mice per treatment group in all arms). Operators allocated mice to the different treatment groups during randomization but were blinded during measurements. In vivo procedures and related biobanking data were managed using the Laboratory Assistant Suite (LAS), a web-based proprietary data management system for automated data tracking32. All experiments were conducted with approval from the Animal Care Committee of the Candiolo Cancer Institute, in accordance with the Italian legislation on animal experimentation.
Sample preparation and next-generation sequencing
DNA was extracted from patient’s tumor, early passage tumorgrafts developed from liver metastases, normal samples (adjacent non-cancerous liver or peripheral blood), and from normal tissue of the same mouse strain as those used to grow the xenografts using the Qiagen DNA FFPE tissue kit or Qiagen DNA blood mini kit (Qiagen, CA). Additional analyses were performed for CRC334 after afatinib anti-EGFR therapy and tumorgraft regrowth (indicated in footnote of Supplementary Table 4). Genomic DNA from tumor and normal samples were fragmented and used for Illumina TruSeq library construction (Illumina, San Diego, CA) according to the manufacturer’s instructions or as previously described33. Exonic or targeted regions were captured in solution using the Agilent SureSelect v.4 kit or a custom targeted panel according to the manufacturer’s instructions (Agilent, Santa Clara, CA) (Supplementary Table 9). The captured library was then purified with a Qiagen MinElute column purification kit and eluted in 17 μl of 70°C EB to obtain 15 μl of captured DNA library. The captured DNA library was amplified in the following way: Eight 30uL PCR reactions each containing 19 μl of H2O, 6 μl of 5 × Phusion HF buffer, 0.6 μl of 10 mM dNTP, 1.5 μl of DMSO, 0.30 μl of Illumina PE primer #1, 0.30μl of Illumina PE primer #2, 0.30 μl of Hotstart Phusion polymerase, and 2 μl of captured exome library were set up. The PCR program used was: 98°C for 30 seconds; 14 cycles (exome) or 16 cycles (targeted) of 98°C for 10 seconds, 65°C for 30 seconds, 72°C for 30 seconds; and 72°C for 5 min. To purify PCR products, a NucleoSpin Extract II purification kit (Macherey-Nagel, PA) was used following the manufacturer’s instructions. Paired-end sequencing, resulting in 100 bases from each end of the fragments for exome libraries and 100 or 150 bases from each end of the fragment for targeted libraries, was performed using Illumina HiSeq 2000/2500 and Illumina MiSeq instrumentation (Illumina, San Diego, CA).
Primary processing of next-generation sequencing data and identification of putative somatic mutations
Somatic mutations were identified using VariantDx33 custom software for identifying mutations in matched tumor and normal samples. Prior to mutation calling, primary processing of sequence data for both tumor and normal samples were performed using Illumina CASAVA software (v1.8), including masking of adapter sequences. Sequence reads were aligned against the human reference genome (version hg18) using ELAND with additional realignment of select regions using the Needleman-Wunsch method34. Candidate somatic mutations, consisting of point mutations, insertions, and deletions were then identified using VariantDx across the either the whole exome or regions of interest. VariantDx examines sequence alignments of tumor samples against a matched normal while applying filters to exclude alignment and sequencing artifacts. In brief, an alignment filter was applied to exclude quality failed reads, unpaired reads, and poorly mapped reads in the tumor. A base quality filter was applied to limit inclusion of bases with reported phred quality score > 30 for the tumor and > 20 for the normal. A mutation in the tumor was identified as a candidate somatic mutation only when (i) distinct paired reads contained the mutation in the tumor; (ii) the number of distinct paired reads containing a particular mutation in the tumor was at least 2% of the total distinct read pairs for targeted analyses and 10% of read pairs for exome and (iii) the mismatched base was not present in >1% of the reads in the matched normal sample as well as not present in a custom database of common germline variants derived from dbSNP and (iv) the position was covered in both the tumor and normal. Mutations arising from misplaced genome alignments, including paralogous sequences, were identified and excluded by searching the reference genome. Potential alterations were compared to mouse sequences from experimentally obtained mouse whole-exome and targeted sequence data as well as the reference mouse genome (mm9) to remove mouse-specific variants. Candidate somatic mutations were further filtered based on gene annotation to identify those occurring in protein coding regions. Functional consequences were predicted using snpEff and a custom database of CCDS, RefSeq and Ensembl annotations using the latest transcript versions available on hg18 from UCSC (https://genome.ucsc.edu/). Predictions were ordered to prefer transcripts with canonical start and stop codons and CCDS or Refseq transcripts over Ensembl when available. Finally mutations were filtered to exclude intronic and silent changes, while retaining mutations resulting in missense mutations, nonsense mutations, frameshifts, or splice site alterations. A manual visual inspection step was used to further remove artifactual changes. Amplification analyses were performed using the Digital Karyotyping approach35 by comparison of the number of reads mapping to a particular gene compared to the average number of reads mapping to each gene in the panel, along with a minor allele fraction analysis of heterozygous single nucleotide polymorphisms (SNPs) contained within each gene. For comparison of somatic alterations in tumorgraft and pre-implantation material, we considered all alterations where the mutation was present in at least 20% of the read pairs in the tumorgraft samples. To evaluate whether mutant genes observed in individual cases may be clinically actionable using existing or investigational therapies, we examined altered genes that were associated with 1) FDA-approved therapies for oncologic indications, 2) therapies in published prospective or retrospective clinical studies, and 3) ongoing clinical trials for patients with CRC or other tumor types.
Gene expression analyses
Data were obtained using a HumanHT-12 v4 Illumina beadarray technology. Following data normalization, genes were collapsed to the probe displaying highest mean signal. Gene expression values were then Log2-transformed and centered to the median (Supplementary Table 10). IRS2 expression in 100 tumorgrafts with wild-type forms of KRAS, NRAS, BRAF, and PIK3CA was compared to cetuximab response by one-way ANOVA and Bonferroni’s multiple comparisons test.
Statistical analyses for genes with somatic alterations
Using the approach previously described36, we analyzed 24,334 somatic mutations (nonsynonymous and synonymous single base substitutions plus indels) identified in the protein coding sequence of 127 tumorgraft samples, after samples with KRAS hotspot mutations (codons 12 or 13) and those with a mutator phenotype were excluded. We implemented the following statistical framework to identify significantly mutated genes by incorporating background mutation rates, gene length, and base composition.
Inspired by previous works37,38, our model defines gene-specific background mutation rates, which capture exome-wide as well as gene-specific sequence-based parameters. We define 8 exhaustive and disjoint sequence-based dinucleotide contexts: C in CpG, G in CpG, C in TpC, G in GpA, and all other A, G, C, T. We represent the occurrences of each context in the entire protein coding sequence by Ni, and in each gene of interest by gi. Subsequently, we identify the dinucleotide context for all single base substitution (SBS) somatic mutations identified and derive the counts of mutations in each context over all CDS (protein coding sequence) (ni). We derive the expected probability of observing a mutation in a base occurring in the CDS of a gene of interest as follows:
| (1) |
| (2) |
where fi denotes the fraction of bases in dinucleotide context i in the entire CDS, where a mutation has been observed. The context parameters Ni and gi are defined as the total number of occurrences of each context sequenced across all of the samples; therefore following the simplifying assumption of full coverage of the entire protein coding sequence, and assuming K samples total, these parameters will be K times those of a single haploid exome.
Following the definition of fi, we derive the background probability of observing at least mg,obs mutations in a gene of interest, using the binomial tail probability of Lg trials with mg,obs successes and Pmut probability of success in each trial. Here, Lg represents the length of the CDS of the gene times the number of samples.
| (3) |
We use an equivalent formulation to model the statistical significance of observing qg,obs insertions/deletions (indels) in a gene of interest. The background indel frequency (Pindel) is defined as the number of indels recovered in the entire CDS of the sequenced samples divided by the length of the entire CDS available in these samples.
| (4) |
The two statistical tests described above (3,4) reflect the significance of mutation counts in a gene, but are blind to the protein-level consequence of mutations. To capture the impact of mutation on protein, we apply an extension of the tests above that examines enrichment for nonsynonymous mutations in the set of single base substitution mutations identified in a gene of interest. We define a background, gene-specific ratio of non-synonymous to synonymous (NS/S) mutations, given the exome-wide NS/S ratio in each dinucleotide context (ri) and the sequence composition of each gene as follows. Note that gi has the same definition as in (1).
| (5) |
Given the NS/S ratio for a gene of interest, the probability of an observed mutation in the gene being nonsynonymous is:
| (6) |
Following this step, the binomial tail probability of observing from the total of mg,obs mutations in a gene of interest is:
| (7) |
The three test statistics (3, 4, 7) rely on three distinct measures for calling a gene significantly mutated: the counts of single base substitutions, the counts of indels, and the relative counts of nonsynonymous to synonymous single base substitutions. Assuming the independence of these measures, given gene-specific parameters of gi and Lg, we combine them using Fisher’s combined probability test to derive a measure of overall significance for each gene of interest (combined p-value). We acknowledge the fact that Fisher’s combined probability test is best suited to p-values derived from continuous probability distribution functions; however, it has been shown that its application to p-values derived from discrete probability distributions results in conservative estimates of p-value.
Finally, we apply Bonferroni and Benjamini-Hochberg’s correction method to combined p-values to control for multiple testing.
Statistical analyses for therapeutic resistance or sensitivity
Statistical models for tumor growth were implemented for each of four mutation profiles that were correlated to resistance or sensitivity to cetuximab treatment. Group A samples had ERBB2 mutations and/or amplification, MET amplification, EGFR mutations affecting the ectodomain or kinase domain, NRAS mutation, BRAF V600E, FGFR1 amplification, PDGFRA mutations affecting the kinase domain and MAP2K1 K57N. Group B samples had ERBB2 mutations, EGFR mutations affecting the ectodomain or kinase domain, FGFR1 amplification, PDGFRA mutations affecting the kinase domain or MAP2K1 K57N. Group C samples had amplification of EGFR or a mutation or amplification of IRS2 while group D samples had amplification or mutation of IRS2. As IRS2 alterations are likely to be predictive of anti-EGFR response in cases without other mechanisms of resistance to EGFR therapy, we excluded two samples that harbored a MET amplification or BRAF mutation from Group C and D. For each group, Wilcoxon rank sum and two sample Welch t-tests were used to evaluate differences in the mean tumor growth between samples with mutation and those without.
Protein structure modeling
The crystal structure of the extracellular domain of the epidermal growth factor receptor in complex with the Fab fragment of cetuximab was retrieved from the protein data bank (PDB entry #1YY9). This PDB entry contains a complex of 3 biomacromolecules including the extracellular portion of EGFR, cetuximab Fab Light chain, and cetuximab Fab Heavy chain. The EGFR-cetuximab complex was visualized using Deep View Swiss-pdbviewer (SPDBV_4.10_PC).
Cell cultures, plasmids, antibodies, and biological assays
NCI-H508 and 293T cells were obtained from ATCC and cultured in RPMI 1640 and Iscove medium, respectively. Cell lines were authenticated for genetic identity by short tandem repeat profiling (Cell ID, Promega, Fitchburg, WI) and routinely PCR-tested for mycoplasma contamination (Minerva Biolabs, Berlin, Germany). EGFR G465E and MAP2K1 K57N in the PS100069 lentiviral vectors were custom-cloned by and purchased from OriGene (Rockville, MD). The MISSION lentiviral pLKO.1-puro shRNA vector targeting IRS2 (target sequence: GTGAAGATCTGTCTGGCTTTA), as well as the non-targeting control vector, were purchased from Sigma (St. Louis, MO). All vectors were produced by lipofectAMINE 2000 (Life Technologies, Monza, Italy)-mediated transfection of 293T cells. Primary antibodies included: rabbit anti-phospho-Tyr1068-EGFR (ab5644) (Abcam, Cambridge, United Kingdom); rabbit anti-EGFR (D38B1), rabbit anti-IRS2 (L1326), rabbit anti-phospho-Ser473-AKT (D9E), rabbit anti-AKT (11E7), rabbit anti-phospho-Thr202/Tyr204-ERK (D13.14.4E), rabbit anti-ERK (137F5) (Cell Signaling Technology, Billerica, MA); mouse anti-DDK (4C5) (Origene); mouse anti-tubulin (DM1A) (Sigma-Aldrich, St. Louis, MO). Proliferative response was assessed with an ATP content assay as an indicator of cellular viability. On day 0, cells were plated at clonal density (20 cells/μl) in complete medium. On day 1, serially-diluted cetuximab or vehicle (PBS) was added to the cells. On day 6, cell viability was measured by CellTiter-Glo (Promega) using Victor X4 (PerkinEmler, Waltham, MA) or GloMax (Promega) microplate luminometers.
Pharmacodynamic analyses
Tumorgrafts were embedded in paraffin and subjected to immunoperoxidase staining with rabbit monoclonal antibodies against phospho-S6 (Ser235/236, clone D57.2.2E, Cell Signaling Technology, Billerica, MA) or phospho-ERK1/2 (Thr202/Tyr204, clone D13.14.4E, Cell Signaling Technology). After incubation with secondary antibodies, immunoreactivities were revealed by incubation in DAB chromogen (Dako, Cernusco sul Naviglio, Italy). Images were captured with the Leica LAS EZ software using a Leica DM LB microscope (Mannheim, Germany). For morphometric quantitation, 5 fields/section at 40× from two tumors from two different mice for each treatment modality (n = 10) were analyzed using ImageJ. Immunoreactivity for phospho-ERK and phospho-S6 was quantified by spectral segmentation of images in two layers: one layer excluded stroma and empty spaces (such as lumens); the second layer measured DAB positivity. The percentage of immunoreactive cells was calculated as DAB positivity divided by total cancer cell area. Software outputs were manually verified by visual inspection of digital images.
Extended Data
Extended Data Figure 1. EGFR signaling pathway genes involved in cetuximab resistance or sensitivity.
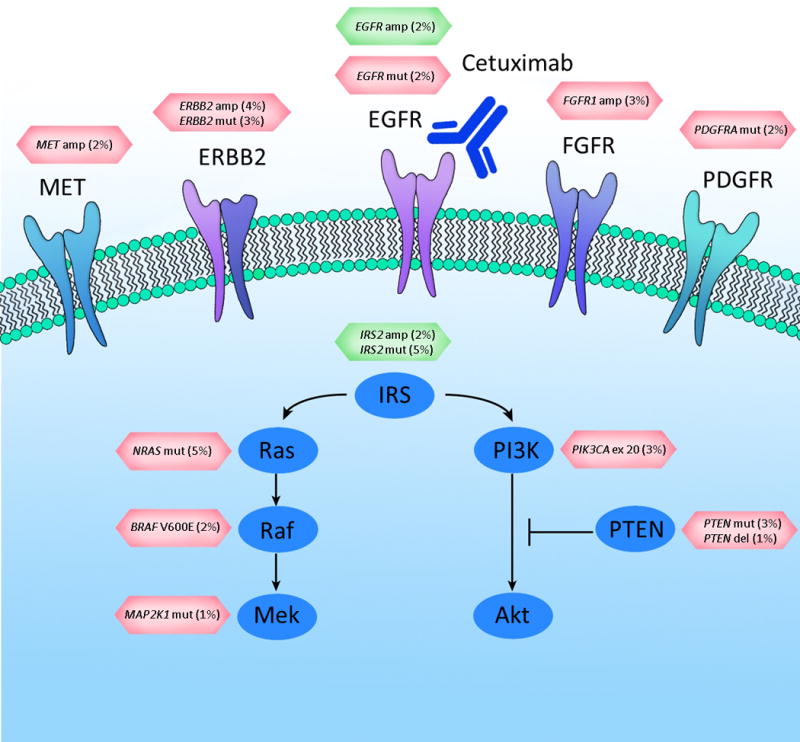
Altered cell surface receptors or members of RAS or PI3K pathways identified in this study are indicated. Somatic alterations related to resistance or sensitivity are highlighted in red or green boxes, respectively. The percentages indicate the fraction of KRAS WT tumors containing the somatic alterations in the specified genes. For the following genes a subset of alterations are indicated: PDGFRA kinase domain mutations; EGFR ecto- and kinase domain mutations and amplifications.
Extended Data Figure 2. Pan-HER monoclonal antibody mixture binds epitopes different from those recognized by cetuximab.
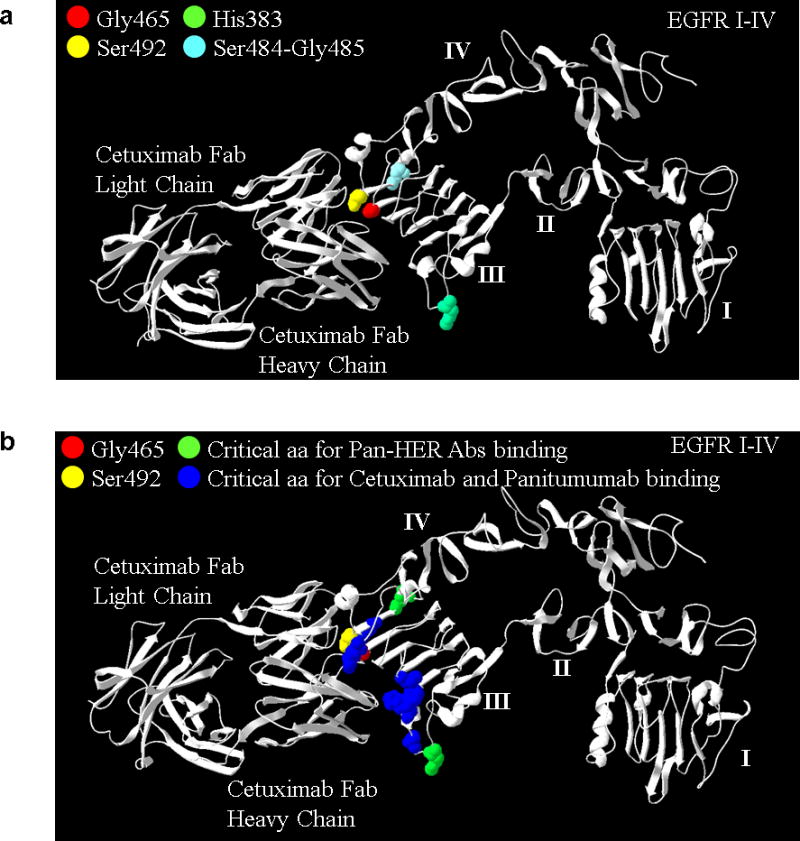
A) The H383 (green) residue and the S484/G485 residues (light blue) in EGFR domain III are critical for the binding of Pan-HER anti-EGFR antibodies 1277 and 1565, respectively27. Antibodies 1277 and 156527 bind to an epitope distinct from that of cetuximab, which may contribute to the superior tumor growth inhibition in the presence of mutations at residue 465. Mutations identified in this study affecting G465 (red) and the S492 amino acid (yellow) previously reported to confer cetuximab resistance11 are shown for reference. Similarly to mutations affecting S492, the alterations at 465 that we identified in this study (G465R and G465E) involve changes from a nonpolar uncharged side chain to large electrically charged arginine or glutamic acid residues, respectively, and predict resistance to cetuximab. B) Critical EGFR amino acids selectively recognized by both cetuximab and panitumumab as determined by phage screening are shown in blue and include P373, K467, P411, K489, D379, F37626. Residue G465 is in close proximity to K467 and other residues that have been shown to influence the binding of both cetuximab and panitumumab26.
Extended Data Figure 3. Expression of IRS2 according to response categories in tumorgraft models.
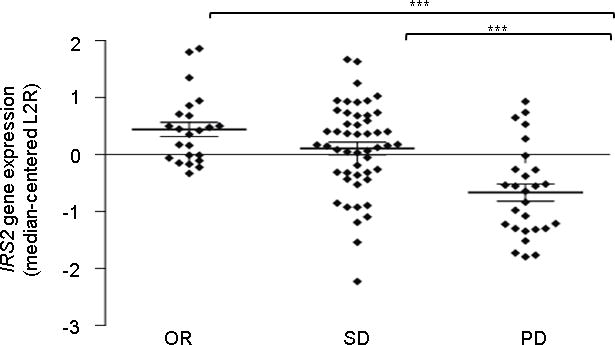
Results were obtained using Illumina-based oligonucleotide microarrays in 100 tumorgrafts that had no mutations in the KRAS, NRAS, BRAF or PIK3CA genes. Response categories are defined in the main text. OR, objective response; SD, stable disease; PD, progressive disease. P < 0.001 for OR compared to PD and SD compared to PD by one-way ANOVA and Bonferroni’s multiple comparison test. IRS2 expression values are shown in Supplementary Table 10.
Extended Data Figure 4. Functional studies of genetic alterations associated with cetuximab response.
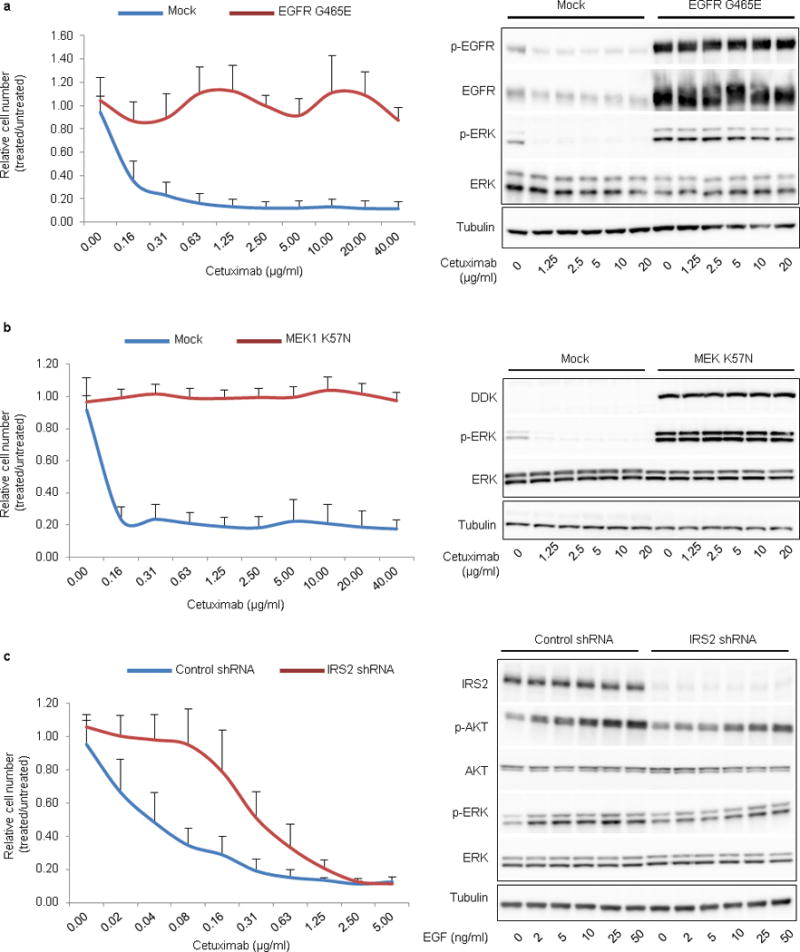
a, b, Ectopic expression of mutations that correlated with resistance to EGFR blockade prevented responsiveness to cetuximab. NCI-H508 cells expressing EGFR G465E (a, left panel) or DDK-tagged MAP2K1 K57N (b, left panel) were refractory to cetuximab in dose-dependent viability assays after 6 days of treatment. Results are the means ± SD of two independent experiments performed in biological triplicates (n = 6) for EGFR G465E and three independent experiments performed in biological triplicates (n = 9) for MAP2K1 K57N compared to mock vector controls. Biochemical responses of NCI-H508 EGFR G465E (a, right panel) and NCI-H508 MAP2K1 K57N (b, right panel) treated with cetuximab for 24h were documented by western blot analyses. c, Genetic silencing of IRS2 (IRS2 shRNA) in NCI-H508 cells reduced sensitivity to cetuximab in dose-dependent viability assays (left panel). Results are the means ± SD of two independent experiments performed in biological triplicates (n = 6). In biochemical studies using western blot analyses (right panel), IRS2 knockdown attenuated EGF-dependent activation of AKT (P-AKT) and ERK (P-ERK). Cells were treated for 10 min with the indicated concentrations of EGF. Tubulin was used as a loading control. Western blots for total EGFR, ERK and AKT proteins were run with the same lysates as those used for anti-phosphoprotein detection but on different gels.
Extended Data Figure 5. Signaling consequences of FGFR inhibition in FGFR1-amplified CRC477.
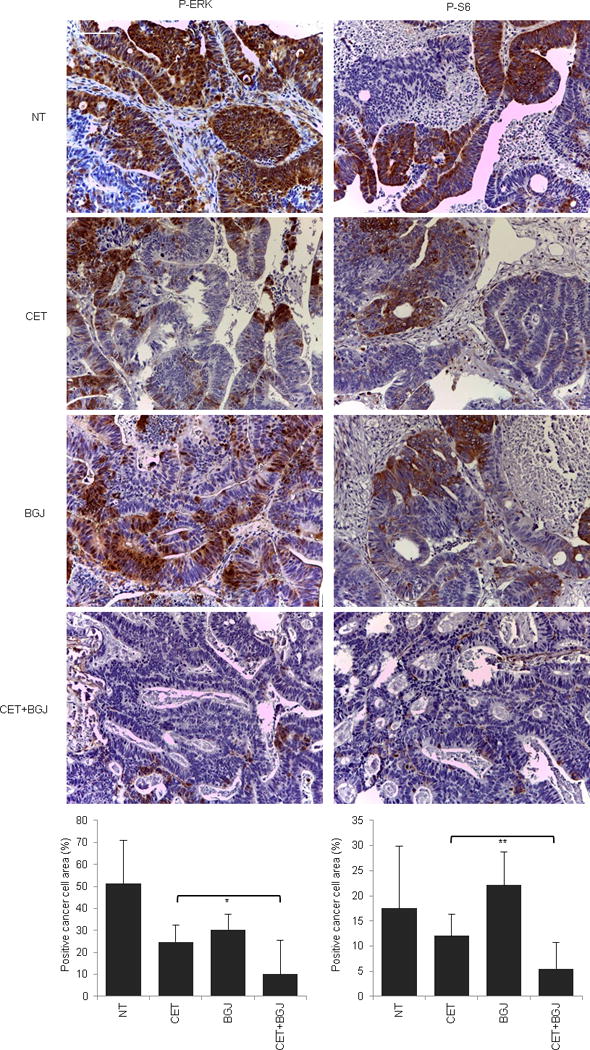
Immunohistochemistry with the indicated antibodies and morphometric quantitations of representative tumors at the end of treatment. Results are the means ± SD of 5 fields (40×) from two tumors for each experimental point (n = 10). Scale bar, 300 μm. P-ERK, phospho-ERK; P-S6, phospho-S6. NT, not treated (vehicle); CET, cetuximab; BGJ, BGJ398. * P < 0.05; ** P < 0.01 by two-tailed Student’s t-test.
Extended Data Figure 6. Signaling consequences of EGFR inhibition in EGFR mutant (V843I) CRC334.
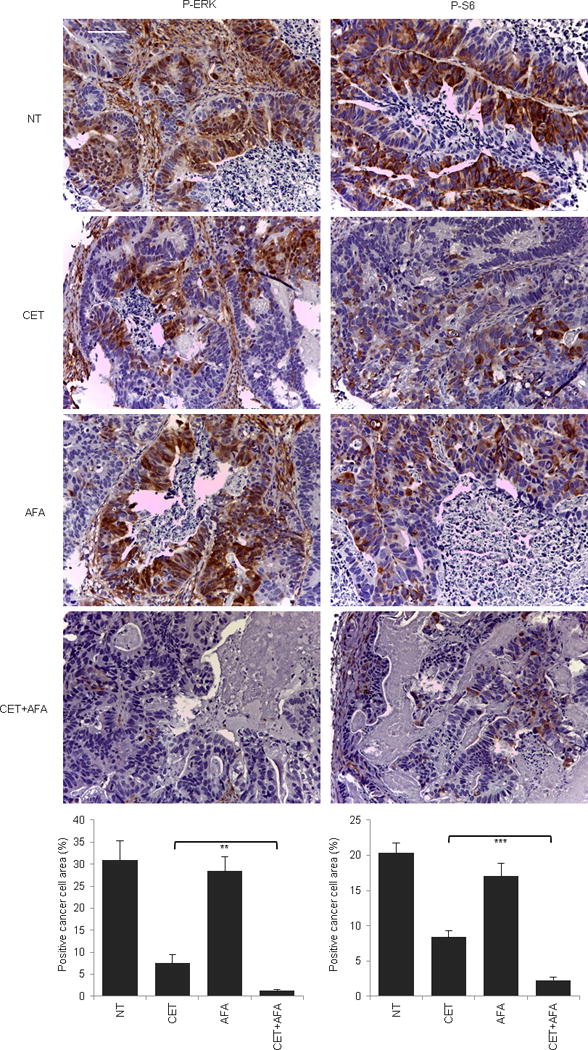
Immunohistochemistry with the indicated antibodies and morphometric quantitations of representative tumors at the end of treatment. Results are the means ± SD of 5 fields (40×) from two tumors for each experimental point (n = 10). Scale bar, 300 μm. P-ERK, phospho-ERK; P-S6, phospho-S6. NT, not treated (vehicle); CET, cetuximab; AFA, afatinib. ** P < 0.01; *** P < 0.001 by two-tailed Student’s t-test.
Extended Data Figure 7. Signaling consequences of PDGFR inhibition in PDGFRA mutant (R981H) CRC525.
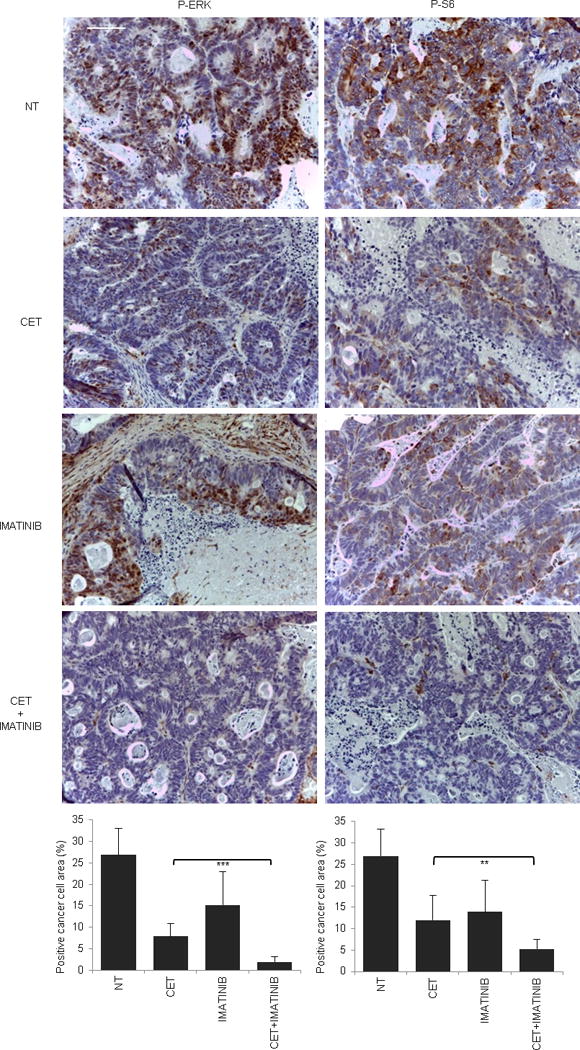
Immunohistochemistry with the indicated antibodies and morphometric quantitations of representative tumors after acute treatment (4 hours after imatinib and 24 hours after cetuximab administration). Results are the means ± SD of 5 fields (40×) from two tumors for each experimental point (n = 10). Scale bar, 300 μm. P-ERK, phospho-ERK; P-S6, phospho-S6. NT, not treated (vehicle); CET, cetuximab. ** P < 0.01 by two-tailed Student’s t-test.
Extended Data Figure 8. Signaling consequences of MEK1 inhibition in MAP2K1 mutant (K57KN) CRC343.
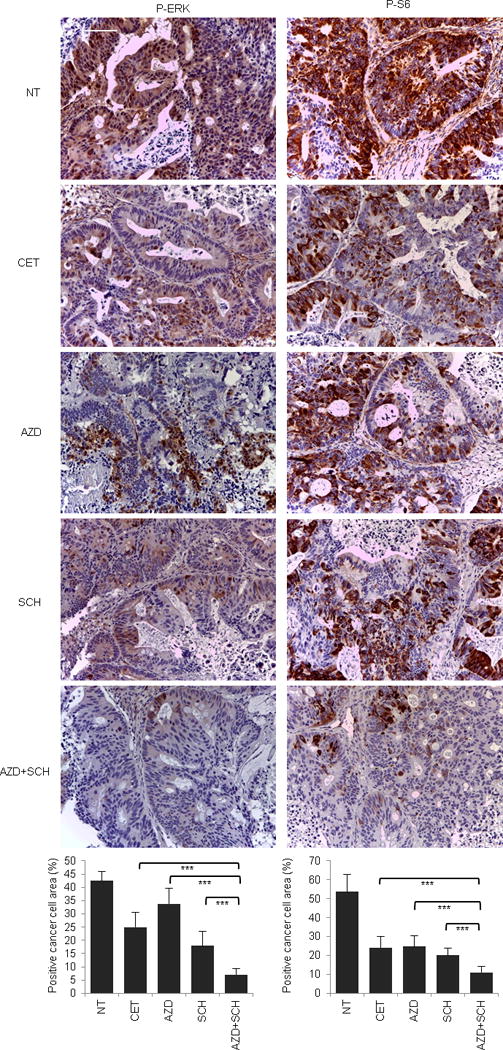
Immunohistochemistry with the indicated antibodies and morphometric quantitations of representative tumors at the end of treatment. Results are the means ± SD of 5 fields (40×) from two tumors for each experimental point (n = 10). Scale bar, 300 μm. P-ERK, phospho-ERK; P-S6, phospho-S6. NT, not treated (vehicle); CET, cetuximab; AZD, AZD6244; SCH, SCH772984. *** P < 0.001 by two-tailed Student’s t-test.
Extended Data Figure 9. Signaling consequences of EGFR inhibition in EGFR mutant (G465E) CRC104.
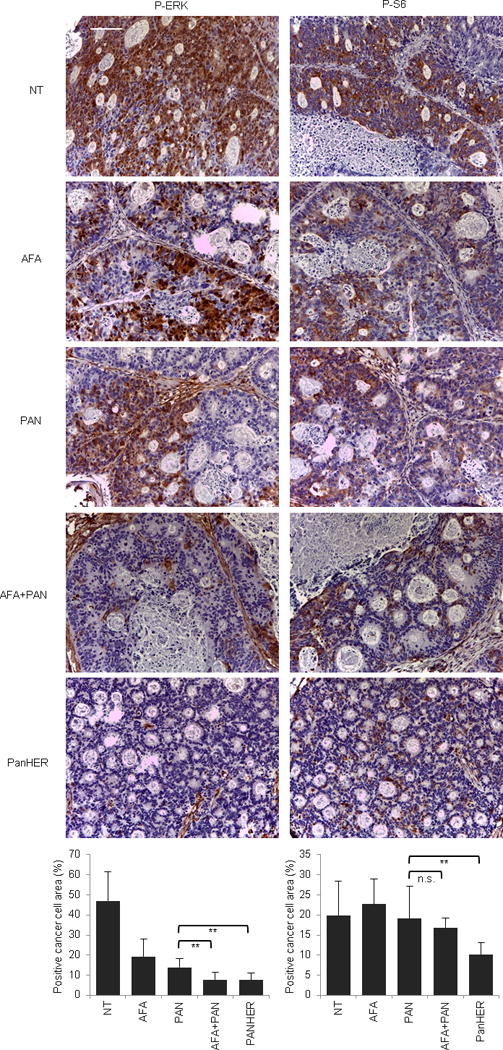
Immunohistochemistry with the indicated antibodies and morphometric quantitations of representative tumors at the end of treatment. Results are the means ± SD of 5 fields (40×) from two tumors for each experimental point (n = 10). Scale bar, 300 μm. P-ERK, phospho-ERK; P-S6, phospho-S6. NT, not treated (vehicle); CET, cetuximab; AFA, afatinib; PAN, panitumumab. n.s., not significant; ** P < 0.01 by two-tailed Student’s t-test.
Extended Data Figure 10. Signaling consequences of EGFR inhibition in EGFR mutant (G465R) CRC177.
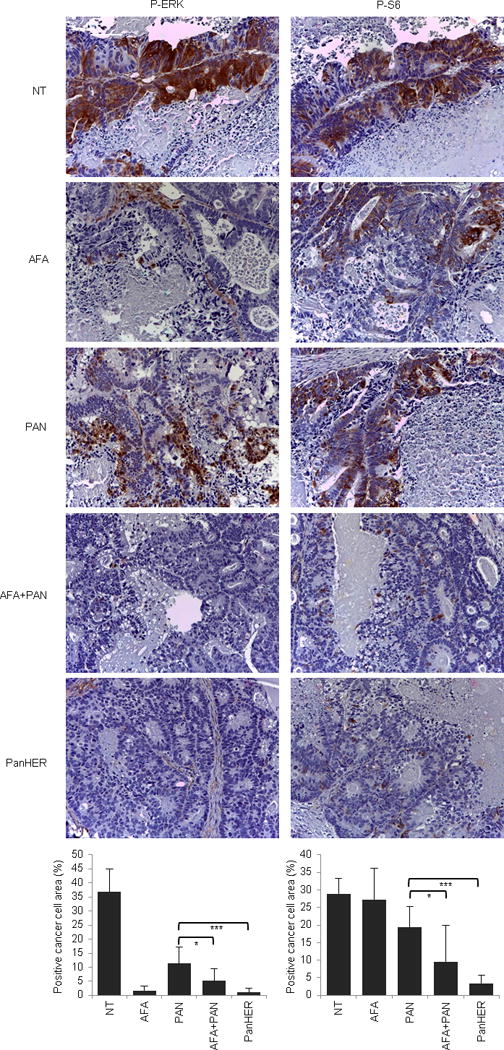
Immunohistochemistry with the indicated antibodies and morphometric quantitations of representative tumors at the end of treatment. Results are the means ± SD of 5 fields (40×) from two tumors for each experimental point (n = 10). Scale bar, 300 μm. P-ERK, phospho-ERK; P-S6, phospho-S6. NT, not treated (vehicle); CET, cetuximab; AFA, afatinib; PAN, panitumumab. * P < 0.05; *** P < 0.001 by two-tailed Student’s t-test.
Supplementary Material
Acknowledgments
The authors thank S. Angiuoli, D. Riley, L. Kann, M. Shukla, and C.L. McCord for their assistance with next-generation sequencing analyses; C. Hruban for assistance with tumor DNA purification and artwork; and Francesco Galimi and Simonetta M. Leto for their help with Sanger sequencing analyses and functional studies. This work was generously supported by the John G. Ballenger Trust, FasterCures Research Acceleration Award, the AIRC Italian Association for Cancer Research (Special Program Molecular Clinical Oncology 5×1000, project 9970, and Investigator Grants projects 14205 and 15571), American Association for Cancer Research (AACR) – Fight Colorectal Cancer Career Development Award, The European Community’s Seventh Framework Programme, the Commonwealth Foundation, Swim Across America, US National Institutes of Health (NIH) grant CA121113, Fondazione Piemontese per la Ricerca sul Cancro-ONLUS (5×1000 Italian Ministry of Health 2011), Oncologia Ca’ Granda ONLUS, and the SU2C-DCS International Translational Cancer Research Dream Team Grant (SU2C-AACR-DT1415). The authors would like to acknowledge Merck (Darmstadt, Germany) for a generous gift of cetuximab. Stand Up To Cancer is a program of the Entertainment Industry Foundation administered by the American Association for Cancer Research. A.B. and L.T. are members of the EurOPDX Consortium.
Sequence data have been deposited at the European Genome-phenomeArchive (EGA), which is hosted at the European Bioinformatics Institute (EBI), under study accession EGAS00001001305.
Footnotes
Author Contributions:
A.B. and E.P. conceived the project, designed and performed experiments, interpreted results and co-wrote the manuscript. S.J., V.A., V.A., B.L., M.S., J.P., M.N., K.L., F.S., F.C., G.M., E.R.Z., D.R., N.R., A.M., A.M., G.P., M.S., S.M., and A.C. performed experiments, analyzed data, prepared tables or participated in discussion of the results. M.K. and J.L. contributed reagents. Q.K.L. undertook all pathological evaluations. C.T., N.N., R.K. and R.S. performed statistical analyses. A.S.-B, S.S. and L.A.D. provided clinically annotated samples and supervised experimental designs. L.T. and V.E.V. conceived the project, supervised experimental designs, interpreted results, and co-wrote the manuscript.
Competing financial interests: L.A.D. and V.E.V. are co-founders of Personal Genome Diagnostics and are members of its Scientific Advisory Board and Board of Directors. V.E.V. and L.A.D. own Personal Genome Diagnostics stock, which is subject to certain restrictions under University policy. The authors are entitled to a share of the royalties received by the University on sales of products related to genes described in this manuscript. The terms of these arrangements are managed by the Johns Hopkins University in accordance with its conflict-of-interest policies.
References
- 1.Van Cutsem E, Cervantes A, Nordlinger B, Arnold D, on behalf of the, E. G. W. G Metastatic colorectal cancer: ESMO Clinical Practice Guidelines for diagnosis, treatment and follow-updagger. Annals of oncology: official journal of the European Society for Medical Oncology/ESMO. 2014 doi: 10.1093/annonc/mdu260. [DOI] [PubMed] [Google Scholar]
- 2.Diaz LA, Jr, et al. The molecular evolution of acquired resistance to targeted EGFR blockade in colorectal cancers. Nature. 2012;486:537–540. doi: 10.1038/nature11219. [DOI] [PMC free article] [PubMed] [Google Scholar]
- 3.Misale S, et al. Emergence of KRAS mutations and acquired resistance to anti-EGFR therapy in colorectal cancer. Nature. 2012;486:532–536. doi: 10.1038/nature11156. [DOI] [PMC free article] [PubMed] [Google Scholar]
- 4.Amado RG, et al. Wild-type KRAS is required for panitumumab efficacy in patients with metastatic colorectal cancer. J Clin Oncol. 2008;26:1626–1634. doi: 10.1200/JCO.2007.14.7116. [DOI] [PubMed] [Google Scholar]
- 5.De Roock W, et al. Effects of KRAS, BRAF, NRAS, and PIK3CA mutations on the efficacy of cetuximab plus chemotherapy in chemotherapy-refractory metastatic colorectal cancer: a retrospective consortium analysis. The lancet oncology. 2010;11(10):753–762. 70130–3. doi: 10.1016/S1470-2045. [DOI] [PubMed] [Google Scholar]
- 6.Tol J, et al. Markers for EGFR pathway activation as predictor of outcome in metastatic colorectal cancer patients treated with or without cetuximab. European journal of cancer. 2010;46:1997–2009. doi: 10.1016/j.ejca.2010.03.036. [DOI] [PubMed] [Google Scholar]
- 7.Sartore-Bianchi A, et al. PIK3CA mutations in colorectal cancer are associated with clinical resistance to EGFR-targeted monoclonal antibodies. Cancer research. 2009;69:1851–1857. doi: 10.1158/0008-5472.CAN-08-2466. [DOI] [PubMed] [Google Scholar]
- 8.Bardelli A, et al. Amplification of the MET receptor drives resistance to anti-EGFR therapies in colorectal cancer. Cancer discovery. 2013;3:658–673. doi: 10.1158/2159-8290.CD-12-0558. [DOI] [PMC free article] [PubMed] [Google Scholar]
- 9.Bertotti A, et al. A molecularly annotated platform of patient-derived xenografts (“xenopatients”) identifies HER2 as an effective therapeutic target in cetuximab-resistant colorectal cancer. Cancer discovery. 2011;1:508–523. doi: 10.1158/2159-8290.CD-11-0109. [DOI] [PubMed] [Google Scholar]
- 10.Yonesaka K, et al. Activation of ERBB2 signaling causes resistance to the EGFR-directed therapeutic antibody cetuximab. Science translational medicine. 2011;3:99ra86. doi: 10.1126/scitranslmed.3002442. [DOI] [PMC free article] [PubMed] [Google Scholar]
- 11.Montagut C, et al. Identification of a mutation in the extracellular domain of the Epidermal Growth Factor Receptor conferring cetuximab resistance in colorectal cancer. Nature medicine. 2012;18:221–223. doi: 10.1038/nm.2609. [DOI] [PubMed] [Google Scholar]
- 12.Bettegowda C, et al. Detection of circulating tumor DNA in early- and late-stage human malignancies. Science translational medicine. 2014;6:224ra224. doi: 10.1126/scitranslmed.3007094. [DOI] [PMC free article] [PubMed] [Google Scholar]
- 13.Diaz LA, Jr, Sausen M, Fisher GA, Velculescu VE. Insights into therapeutic resistance from whole-genome analyses of circulating tumor DNA. Oncotarget. 2013;4:1856–1857. doi: 10.18632/oncotarget.1486. [DOI] [PMC free article] [PubMed] [Google Scholar]
- 14.Leary RJ, et al. Integrated analysis of homozygous deletions, focal amplifications, and sequence alterations in breast and colorectal cancers. Proceedings of the National Academy of Sciences of the United States of America. 2008;105:16224–16229. doi: 10.1073/pnas.0808041105. [DOI] [PMC free article] [PubMed] [Google Scholar]
- 15.Barber TD, Vogelstein B, Kinzler KW, Velculescu VE. Somatic mutations of EGFR in colorectal cancers and glioblastomas. N Engl J Med. 2004;351:2883. doi: 10.1056/NEJM200412303512724. [DOI] [PubMed] [Google Scholar]
- 16.Moroni M, et al. Somatic mutation of EGFR catalytic domain and treatment with gefitinib in colorectal cancer. Annals of oncology: official journal of the European Society for Medical Oncology/ESMO. 2005;16:1848–1849. doi: 10.1093/annonc/mdi356. [DOI] [PubMed] [Google Scholar]
- 17.Wesche J, Haglund K, Haugsten EM. Fibroblast growth factors and their receptors in cancer. Biochem J. 2011;437:199–213. doi: 10.1042/BJ20101603. [DOI] [PubMed] [Google Scholar]
- 18.Heinrich MC, et al. PDGFRA activating mutations in gastrointestinal stromal tumors. Science. 2003;299:708–710. doi: 10.1126/science.1079666. [DOI] [PubMed] [Google Scholar]
- 19.Dibb NJ, Dilworth SM, Mol CD. Switching on kinases: oncogenic activation of BRAF and the PDGFR family. Nat Rev Cancer. 2004;4:718–727. doi: 10.1038/nrc1434. [DOI] [PubMed] [Google Scholar]
- 20.Marks JL, et al. Novel MEK1 mutation identified by mutational analysis of epidermal growth factor receptor signaling pathway genes in lung adenocarcinoma. Cancer Res. 2008;68:5524–5528. doi: 10.1158/0008-5472.CAN-08-0099. [DOI] [PMC free article] [PubMed] [Google Scholar]
- 21.Algars A, Lintunen M, Carpen O, Ristamaki R, Sundstrom J. EGFR gene copy number assessment from areas with highest EGFR expression predicts response to anti-EGFR therapy in colorectal cancer. British journal of cancer. 2011;105:255–262. doi: 10.1038/bjc.2011.223. [DOI] [PMC free article] [PubMed] [Google Scholar]
- 22.Moroni M, et al. Gene copy number for epidermal growth factor receptor (EGFR) and clinical response to antiEGFR treatment in colorectal cancer: a cohort study. The lancet oncology. 2005;6(05):279–286. 70102–9. doi: 10.1016/S1470-2045. [DOI] [PubMed] [Google Scholar]
- 23.Parsons DW, et al. Colorectal cancer: mutations in a signalling pathway. Nature. 2005;436:792. doi: 10.1038/436792a. [DOI] [PubMed] [Google Scholar]
- 24.Misale S, et al. Blockade of EGFR and MEK intercepts heterogeneous mechanisms of acquired resistance to anti-EGFR therapies in colorectal cancer. Science translational medicine. 2014;6:224ra226. doi: 10.1126/scitranslmed.3007947. [DOI] [PubMed] [Google Scholar]
- 25.Zanella ER, et al. IGF2 is an actionable target that identifies a distinct subpopulation of colorectal cancer patients with marginal response to anti-EGFR therapies. Science translational medicine. 2015;7:272ra212. doi: 10.1126/scitranslmed.3010445. [DOI] [PubMed] [Google Scholar]
- 26.Voigt M, et al. Functional dissection of the epidermal growth factor receptor epitopes targeted by panitumumab and cetuximab. Neoplasia. 2012;14:1023–1031. doi: 10.1593/neo.121242. [DOI] [PMC free article] [PubMed] [Google Scholar]
- 27.Koefoed K, et al. Rational identification of an optimal antibody mixture for targeting the epidermal growth factor receptor. mAbs. 2011;3:584–595. doi: 10.4161/mabs.3.6.17955. [DOI] [PMC free article] [PubMed] [Google Scholar]
- 28.Pavlicek A, et al. Molecular predictors of sensitivity to the insulin-like growth factor 1 receptor inhibitor Figitumumab (CP-751,871) Mol Cancer Ther. 2013;12:2929–2939. doi: 10.1158/1535-7163.MCT-13-0442-T. [DOI] [PubMed] [Google Scholar]
- 29.Jones S, et al. Comparative lesion sequencing provides insights into tumor evolution. Proc Natl Acad Sci U S A. 2008;105:4283–4288. doi: 10.1073/pnas.0712345105. [DOI] [PMC free article] [PubMed] [Google Scholar]
- 30.Siena S, et al. Phase II open-label study to assess efficacy and safety of lenalidomide in combination with cetuximab in KRAS-mutant metastatic colorectal cancer. PloS one. 2013;8:e62264. doi: 10.1371/journal.pone.0062264. [DOI] [PMC free article] [PubMed] [Google Scholar]
- 31.Galimi F, et al. Genetic and expression analysis of MET, MACC1, and HGF in metastatic colorectal cancer: response to met inhibition in patient xenografts and pathologic correlations. Clin Cancer Res. 2011;17:3146–3156. doi: 10.1158/1078-0432.CCR-10-3377. [DOI] [PubMed] [Google Scholar]
- 32.Baralis E, Bertotti A, Fiori A, Grand A. LAS: a software platform to support oncological data management. Journal of medical systems. 2012;36(Suppl 1):S81–90. doi: 10.1007/s10916-012-9891-6. [DOI] [PubMed] [Google Scholar]
- 33.Jones S, et al. Personalized genomic analyses for cancer mutation discovery and interpretation. Science translational medicine. 2015;7:283ra253. doi: 10.1126/scitranslmed.aaa7161. [DOI] [PMC free article] [PubMed] [Google Scholar]
- 34.Needleman SB, Wunsch CD. A general method applicable to the search for similarities in the amino acid sequence of two proteins. Journal of molecular biology. 1970;48:443–453. doi: 10.1016/0022-2836(70)90057-4. [DOI] [PubMed] [Google Scholar]
- 35.Leary RJ, Cummins J, Wang TL, Velculescu VE. Digital karyotyping. Nature protocols. 2007;2:1973–1986. doi: 10.1038/nprot.2007.276. [DOI] [PubMed] [Google Scholar]
- 36.Jiao Y, et al. Exome sequencing identifies frequent inactivating mutations in BAP1, ARID1A and PBRM1 in intrahepatic cholangiocarcinomas. Nat Genet. 2013;45:1470–1473. doi: 10.1038/ng.2813. [DOI] [PMC free article] [PubMed] [Google Scholar]
- 37.Sjoblom T, et al. The consensus coding sequences of human breast and colorectal cancers. Science. 2006;314:268–274. doi: 10.1126/science.1133427. [DOI] [PubMed] [Google Scholar]
- 38.Kan Z, et al. Diverse somatic mutation patterns and pathway alterations in human cancers. Nature. 2010;466:869–873. doi: 10.1038/nature09208. [DOI] [PubMed] [Google Scholar]
Associated Data
This section collects any data citations, data availability statements, or supplementary materials included in this article.