

Abstract
The ventriloquism effect is a critical phenomenon for understanding the underlying mechanisms of multisensory integration. Cross-modal spatial attention causes a distortion of sound localization, although the neural basis of the effect remains an unanswered question. We hypothesized that top-down and bottom-up visual-spatial attention causes the ventriloquism effect with different modulations of ongoing neural oscillation. To test this hypothesis, human scalp electroencephalography (EEG) was measured during a sound localization task. Top-down attention suppressed the EEG amplitude in the alpha frequency (10 Hz) over the contralateral temporal electrode sites to visual cue hemifields. Bottom-up attention shifted the EEG phase to the theta frequency (7 Hz), rather than suppressing the amplitude. Two different neural mechanisms of ongoing neural oscillation contributed toward the ventriloquism effect, with different spatial attention.
Keywords: amplitude modulation, exogenous/endogenous attention, multimodal integration, phase shifts, theta/alpha oscillation
Introduction
Multisensory integration is one of the important cognitive functions in daily life. However, this integration sometimes distorts sensory information. The ventriloquism effect is a case of this illusion, in which sound spatial localization is distorted by visual inputs 1. Spatial attention can modulate multisensory integration 2, whereas this illusion does not always occur. The variability could depend on the state of ongoing brain activity 3,4.
Ongoing neural oscillation is a possible candidate that could explain the variability of the illusion in multisensory integration 5. The neural oscillation in low frequency (e.g. alpha or theta) could reflect inhibitory neural processes of sensory inputs 6,7. Top-down spatial attention can suppress the alpha oscillation amplitude over the contralateral occipitoparietal area to the attended visual hemifield 8. Bottom-up attention can also modulate the state of ongoing low-frequency oscillation. The phase shifts of low-frequency oscillation are induced by high salient stimuli, indicating the contribution of bottom-up attention toward brain state modulation 9,10. The phase shifts produce an excitable state of neural activity, where external stimuli are more perceptible 11. The amplitude modulation and phase shifts also appear in the multisensory interaction 9,12.
Together with the previous studies, we hypothesized that different attention causes the ventriloquism effect with different neural mechanisms. Top-down attention would modulate the slow oscillation amplitude, whereas bottom-up attention would shift the slow oscillation phase, inducing the illusion of sound localization. To verify this hypothesis, a sound localization task was used during electroencephalography (EEG) recordings in which spatial attention is evoked by top-down or bottom-up visual cues. The top-down visual cue could suppress the slow oscillation amplitude and the bottom-up visual cue could shift the slow oscillation phase over the contralateral hemifield.
Materials and methods
Participants
Fourteen volunteers (10 men and four women) aged 22.1±1.30 years, who were right-handed (Edinburgh handedness test, mean±SEM=97.1±1.9) and had normal or corrected-to-normal vision and audition, participated in the EEG recordings after providing fully understood and written informed consent. All participants were unaware of the purpose of the experiment on the illusion of sound localization. The local ethical committee of Kyoto University, Japan, approved the experimental protocol (Protocol no. 26-P-34). Three participants were excluded from further analysis because they did not follow the experimental task or electrooculography (EOG) or other artifacts were too excessive to be removed.
Materials
A 21″ LCD screen (FG2421; EIZO, Kyoto, Japan), with a display resolution of 1920×1080 pixels and a refresh rate of 60 Hz, was used for the experiments. The display was set at a distance of 90 cm from the participants. All stimuli were generated and controlled by Matlab 2009b (MathWorks, Natick, Massachusetts, USA) using the Psychophysics Toolbox 13. The experiment was conducted in a dark, sound-proof room. Auditory stimuli were sinusoidal tones with a frequency of 2000 Hz (sampling rate: 44.1 kHz). The duration of each tone was 30 ms. The tone was presented with earphones (ATH-CKM300; Audio-Technica, Machida, Japan). To create the virtual azimuth, the parameter of the interaural time difference was adapted, in which each participant could detect it with 85% accuracy. Visual cues were white square boxes (0.86°×0.86°) and white arrows (vertical 4.3 cm×horizontal 7.6 cm). For the bottom-up task, white boxes were presented at 3.4° on either side from the center. White arrows were presented at the center in the top-down task.
Experimental paradigm
Participants performed the sound localization task in which they were asked to which side (left or right) the sound target occurred. It was hypothesized that top-down and bottom-up attention causes the ventriloquism effect with different mechanisms; thus, two attentional tasks were adapted (Fig. 1a–c). At the beginning of each trial, a fixation point appeared in the center of the monitor for 500 ms. In the top-down task, the left or the right arrow was then presented for 300 ms before presenting the sound target. In the bottom-up task, the visual cue was presented at one visual hemifield for 50 ms before the sound target was presented. The bottom-up visual stimuli take ∼50 ms to reach the primary visual cortex 14. In addition to top-down and bottom-up tasks, a visual spatial task was adapted to assure the direction of attention to visual cues, in which the participants were required to indicate the location of the visual target in the top-down and bottom-up tasks without sound stimuli. One block consisted of 200 trials (100 trials/two attentional types). The visual spatial task was 20% of all trials. Each participant took part in five blocks. All conditions were presented pseudorandomly to each participant in all blocks.
Fig. 1.
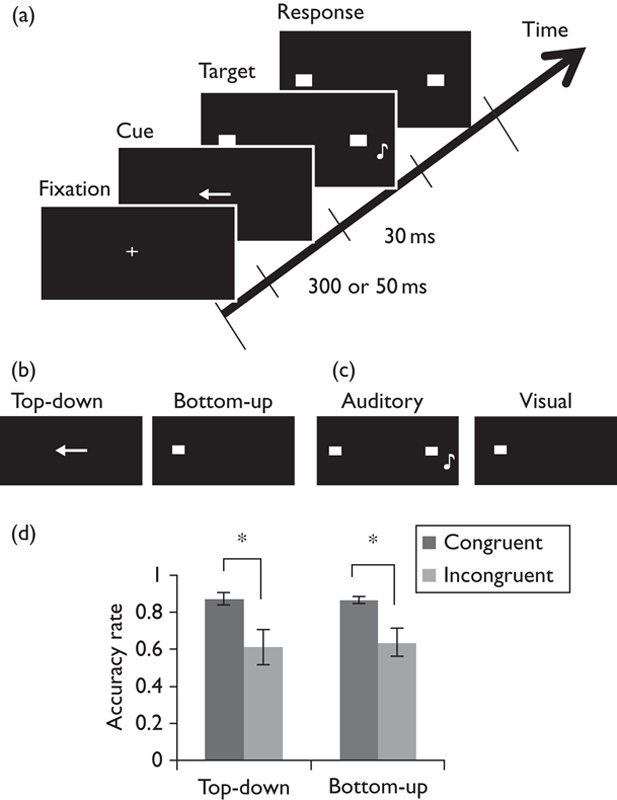
Experimental task and behavioral results. (a) An example of the task procedure. Top-down or bottom-up cue was presented before the target stimuli appeared. Participants were asked to localize the position (left or right) of target stimuli (auditory target in sound localization task; visual target in visual-spatial task). (b) The type of cue stimuli. The left and right panels, respectively, show the top-down and bottom-up cue stimuli. (c) The type of target stimuli. The sound localization task, which consisted of 80% of total trials, used sound stimuli (left panel), and the visual-spatial task, which consisted of 20% of trials, used visual stimuli (right panel). (d) Accuracy rate in the sound localization task (n=11). Black and gray bars indicate the mean accuracy rate among the participants. Error bars indicate SE of the mean. *P<0.01.
EEG analysis
EEG signals were recorded using a 32-channel EEG amplifier (Brain Products, Gilching, Germany) with sintered Ag/AgCl ring electrodes with an international 10% standard electrode cap (Easycap, Woerthsee, Germany) (sampling rate: 5k Hz, bandpass filter: 0.1–150 Hz with a 60 Hz notch filter, reference: linked earlobes, ground: inion). EOG was recorded from electrodes above and below the left eye by monitoring eye blinks or vertical eye movements and from electrodes placed beside the right and left eyes by monitoring horizontal eye movements. Ocular artifacts were removed from the EEG signals using the Brain Vision Analyzer (Brain Products) 15. The remaining artifacts were rejected by manual eye inspection (13.3±3.2% of all trials), and then the preprocessed EEGs were downsampled into 500 Hz. The reference was changed into an average of all electrodes, and proceeded to be analyzed by MATLAB (MathWorks). EEGs were segmented by attribute conditions into 1500 ms stimulus-locked epochs (from 500 ms before stimulus to 1000 ms after stimulus of the sound onset). To investigate the EEG phase and power, the trial-by-trial EEG data were decomposed into a time–frequency representation from 1 to 60 Hz in 1 Hz steps with a Morlet–Wavelet transform (f/σ=7) 16.
A phase locking factor (PLF) was adapted as an index of phase shifts 17. At each trial k, frequency f, and time t, PLF is an average of phase vectors P(t,f)k across the trials. The results of an average of n trials’ PLF represent PLF(t,f)=1/n ∑nk=1 P(t,f)k. PLF was estimated for each participant and a between-participant statistical analysis was carried out.
Statistical analysis
In the behavioral analysis, an attentional type (top-down or bottom-up attention)×target’s position (congruency factor; congruent or incongruent with cue’s position) design was applied. Two-way analysis of variance (ANOVA) of accuracy of the sound localization task and response time of the visual spatial task were estimated. In the EEG analysis, trials in the incongruent condition were classified into two types according to the participant’s response to investigate the ventriloquism effect. The types were the ‘no-illusion’ (i.e. hit trials) and ‘illusion’ (i.e. miss trials). To unify the position of the left cue and right target, each electrode was horizontally flipped into the right cue and left cue conditions. In the phase analysis, the t-test was used to compare the PLF between the ipsilateral and contralateral electrodes to the cue position. In the power analysis, effect size (Cohen’s d) between illusion and no-illusion trials within participants was estimated and the average of the effect-size among participants was estimated. The t-test was used to compare the effect size of EEG power between the ipsilateral and the contralateral electrodes. It is notable that two participants were excluded from the power analysis because they almost perfectly detected sound position, thereby interrupting computation of the effect size. Multiple comparisons in t-tests were corrected using the nonparametric clustering permutation test 18. This method is against the correlation caused by the inflation of time/frequency analytic window in the wavelet transformation. The correlation may generate a type I error in the statistical testing. The empirical distribution obtained by the permutation test was used to decide the statistical threshold with a single procedure taking into account electrodes, time, and frequency simultaneously, resulting in the correction for the multiple comparisons (for more details, see Maris and Oostenveld 18).
Results
Behavioral data
Two-way ANOVA showed significant main effects of the congruency factor on accuracy rate in the sound localization task [F(1, 10)=17.68, P<0.01; Fig. 1d]. The congruent condition was higher than that of the incongruent condition in both the top-down and the bottom-up conditions. In terms of the response time in the visual-spatial task, two-way ANOVA showed a significant interaction between the task factor and the congruency factor [F(1, 10)=8.24, P<0.05] and significant main effects of the congruency factor [F(1, 10)=6.18, P<0.05]. In the post-hoc analysis, the bottom-up attention task showed significant differences in congruent and incongruent conditions [F(1, 10)=55.1, P<0.001], whereas the top-down task did not show any differences [F(1, 10)=0.003, P=0.96].
EEG power modulation
To test whether the visual input suppressed the EEG amplitude at the temporal area, the EEG power was compared (period of sound onset±30 ms) between the ipsilateral and contralateral areas (i.e. laterality index) (Fig. 2). In the top-down attention task, alpha (9–11 Hz) power was suppressed over the contralateral temporal area (T8/T7, CP6/CP5, P8/P7) and enhanced over the frontal areas (F4/F3, F8/F7, FC6/FC5) (Fig. 2a). Other frequency bands and the bottom-up attention task showed no effect of laterality (Fig. 2a). The power of the contralateral temporal regions to the attentional cue was reduced more than the ipsilateral regions [T8/T7: effect-size (Cohen’s) d=−0.32, t(16)=−2.58, P=−0.02; Fig. 2b]. The power over the contralateral frontal area was increased relative to the ipsilateral regions [F4/F3: d=0.52, t(16)=4.14, P<0.001].
Fig. 2.
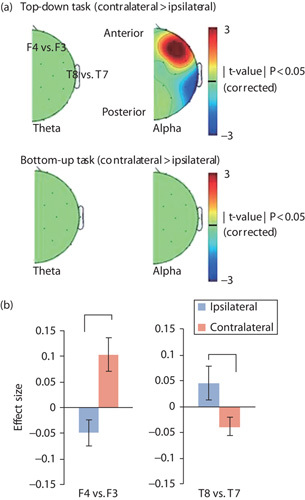
Laterality effect of power modulation during presentation of target stimuli (±30 ms), where the topographies show the contrast of ‘contralateral–ipsilateral’ to the hemifield of informative cue presentation (n=9). (a) Spatial distribution of the laterality effect in the top-down (upper panel) and bottom-up task (bottom panel). Each topography shows the comparison of theta (left panel) or alpha (right panel) EEG power modulation at contralateral and ipsilateral electrodes. The figures represent the corrected t-value masked by P<0.05. (b) The effect size of alpha EEG power over the frontal (F4 vs. F3; left panel) and temporal (T8 vs. T7; right panel) electrodes. Blue and orange bars indicate the mean of effect size among participants. Error bars indicate SE of the mean. *P<0.05. EEG, electroencephalography.
EEG phase shifts
To test whether EEG phase shifts appeared over the contralateral temporal areas in the bottom-up attention task, the laterality index of PLF was computed in the same manner as the EEG power analysis above. In the bottom-up attention task, theta (7 Hz) phase shifts were found over the contralateral temporal and occipital regions (O2/O1, P4/P3, P8/P7, CP6/CP5, T8/T7; Fig. 3a). No laterality effect was found in other frequency bands and the top-down attention task. The EEG electrodes at the occipital and temporal areas more likely showed the laterality effects in the illusion trials relative to those in the no-illusion trials [illusion: O2/O1: effect-size (Cohen’s) d=0.39, t(20)=3.49, P=0.002; P8/P7: d=0.36, t(20)=2.45, P=0.02; T8/T7: d=0.30, t(20)=2.32, P=0.03; no-illusion: O2/O1: d=0.14, t(20)=0.88, P=0.39; P8/P7: d=0.26, t(20)=1.86, P=0.08; T8/T7: d=0.23, t(20)=1.80, P=0.09; Fig. 3b].
Fig. 3.
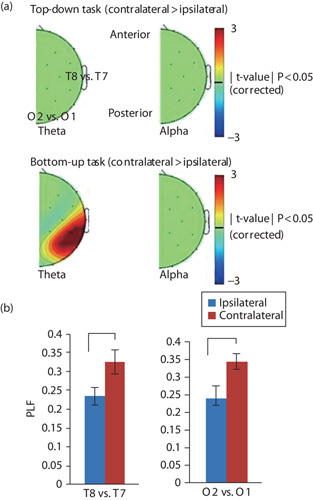
Laterality effect of phase modulation during the presentation of target stimuli (±30 ms), where the topographies show the contrast of ‘contralateral–ipsilateral’ to the hemifield of informative cue presentation (n=11). (a) Spatial distribution of laterality effect in the top-down (upper panel) and bottom-up task (bottom panel). Each topography shows a comparison of theta (left panel) or alpha (right panel) PLF at contralateral and ipsilateral electrodes. The figures represent the corrected t-value masked by P<0.05. (b) The PLF of theta EEG phase over the temporal (T8 vs. T7; left panel) and occipital (O2 vs. O1; right panel) electrodes. Blue and orange bars indicate the mean PLF among the participants. Error bars indicate SE of the mean. *P<0.05. EEG, electroencephalography; PLF, phase locking factor.
Discussion
Previous behavioral and EEG studies have reported the modulation of sound localization in terms of the lateral balance of overall brain activity between the left and right hemispheres 19,20. The lateral balance of slow EEG activity can be modulated by top-down spatial attention in the auditory cortex 20. In line with the previous study, slow EEG suppression was found in the top-down spatial attention (Fig. 2). The suppression of slow EEG activity might induce neural excitation 7, resulting in unbalanced neural activity between the left and right brain hemispheres. Neural excitation can also be modulated by EEG phase shifts 9. The bottom-up attention induced slow EEG phase shifts over the contralateral temporal regions to the visual input (Fig. 3). The lateral balance of slow EEG phase shifts might induce unbalancing of neural excitation in the ventriloquism effect. Two differential attentions caused the ventriloquism effect by different neural mechanisms.
The visual cue in the bottom-up attention task induced theta phase shifts over the temporal area along with the occipital area. Supporting our result, the salient stimuli induced the theta phase shifts beyond the sensory modalities 9. The phase shifts in the temporal area might be induced by visual inputs beyond the sensory modality. The phase shifts then resulted in the ventriloquism effect with bottom-up attention.
For the top-down attention, EEG amplitude suppression was found, rather than EEG phase shifts. The top-down cue was presented at the center so that no EEG phase shifts were found. The suppression of alpha EEG amplitude appeared over the contralateral temporal regions to the attentional field. Slow EEG suppression was also found in the cross-modal selective attention 19. The suppression might be associated with gain control to inputs in the early sensory cortex. The early cortical gain control would induce unbalancing of neural activities between the left and right brain hemispheres, resulting in the ventriloquism effect. In addition to the alpha EEG suppression over the temporal regions, EEG amplitude modulation over the frontal regions was observed (Fig. 2). The increase in alpha amplitude over the frontal site was involved in the function of sensory inhibition to the primary sensory cortex 21. The alpha activity appeared 300 ms after the spatial cue presentation. The temporal latency was well matched with the latency of the inhibition of return in attentional shifts in terms of the neural inhibition in the frontal eye fields 22. The stimulation in the frontal eye fields with the slow frequency disrupted the attentional shifts 23. Together, the frontal alpha activity might reflect the inhibition of the frontal eye fields, leading to the inhibition of return in attentional shifts, whereas the volume conduction in scalp EEG recording impedes the source localization. To examine the detailed function of the scalp EEG activities, the EEG recording should be combined with other functional imaging techniques with high spatial resolution 24. The source localization of the EEG activity inducing the ventriloquism effect should be analyzed with a simultaneous functional MRI/EEG for further understanding in future studies.
Conclusion
This study showed two spatial attentions that induced the ventriloquism effect with different neural mechanisms. Bottom-up attention shifted the phase of theta oscillations and top-down attention suppressed the amplitude of alpha oscillation in the contralateral temporal regions. The results implicate the contribution of different states of ongoing neural oscillation toward cross-modal spatial integrations.
Acknowledgements
This study was partially supported by the Japanese Ministry of Education, Science, Sports, and Culture, Grant-in-Aid for Scientific Research on Innovative Areas [No. 4502] (26119516, 2014–2015) and Basic Research (A) (25240019, 2013–2017).
Conflicts of interest
There are no conflicts of interest.
References
- 1.Jack CE, Thurlow WR. Effects of degree of visual association and angle of displacement on the ‘ventriloquism’ effect. Percept Mot Skills 1973; 37:967–979. [DOI] [PubMed] [Google Scholar]
- 2.Talsma D, Senkowski D, Soto-Faraco S, Woldorff MG. The multifaceted interplay between attention and multisensory integration. Trends Cogn Sci 2010; 14:400–410. [DOI] [PMC free article] [PubMed] [Google Scholar]
- 3.Bonath B, Noesselt T, Martinez A, Mishra J, Schwiecker K, Heinze HJ, et al. Neural basis of the ventriloquist illusion. Curr Biol 2007; 17:1697–1703. [DOI] [PubMed] [Google Scholar]
- 4.Callan A, Callan D, Ando H. An fMRI study of the ventriloquism effect. Cereb Cortex 2015; 25:4248–4258. [DOI] [PMC free article] [PubMed] [Google Scholar]
- 5.Mathewson KE, Gratton G, Fabiani M, Beck DM, Ro T. To see or not to see: prestimulus α phase predicts visual awareness. J Neurosci 2009; 29:2725–2732. [DOI] [PMC free article] [PubMed] [Google Scholar]
- 6.Klimesch W, Sauseng P, Hanslmayr S. EEG alpha oscillations: the inhibition-timing hypothesis. Brain Res Rev 2007; 53:63–88. [DOI] [PubMed] [Google Scholar]
- 7.Jensen O, Gips B, Bergmann TO, Bonnefond M. Temporal coding organized by coupled alpha and gamma oscillations prioritize visual processing. Trends Neurosci 2014; 37:357–369. [DOI] [PubMed] [Google Scholar]
- 8.terHuurne N, Onnink M, Kan C, Franke B, Buitelaar J, Jensen O. Behavioral consequences of aberrant alpha lateralization in attention-deficit/hyperactivity disorder. Biol Psychiatry 2013; 74:227–233. [DOI] [PubMed] [Google Scholar]
- 9.Lakatos P, O’Connell MN, Barczak A, Mills A, Javitt DC, Schroeder CE. The leading sense: supramodal control of neurophysiological context by attention. Neuron 2009; 64:419–430. [DOI] [PMC free article] [PubMed] [Google Scholar]
- 10.Landau AN, Fries P. Attention samples stimuli rhythmically. Curr Biol 2012; 22:1000–1004. [DOI] [PubMed] [Google Scholar]
- 11.Romei V, Gross J, Thut G. Sounds reset rhythms of visual cortex and corresponding human visual perception. Curr Biol 2012; 22:807–813. [DOI] [PMC free article] [PubMed] [Google Scholar]
- 12.Fu KMG, Foxe JJ, Murray MM, Higgins BA, Javitt DC, Schroeder CE. Attention-dependent suppression of distracter visual input can be cross-modally cued as indexed by anticipatory parieto-occipital alpha-band oscillations. Brain Res Cogn Brain Res 2001; 12:145–152. [DOI] [PubMed] [Google Scholar]
- 13.Brainard DH. The psychophysics toolbox. Spat Vis 1997; 10:433–436. [PubMed] [Google Scholar]
- 14.Foxe JJ, Simpson GV. Flow of activation from V1 to frontal cortex in humans. Exp Brain Res 2002; 142:139–150. [DOI] [PubMed] [Google Scholar]
- 15.Gratton G, Coles MG, Donchin E. A new method for off-line removal of ocular artifact. Electroencephalogr Clin Neurophysiol 1983; 55:468–484. [DOI] [PubMed] [Google Scholar]
- 16.Tallon-Baudry C, Bertrand O, Delpuech C, Pernier J. Oscillatory γ-band (30–70 Hz) activity induced by a visual search task in humans. J Neurosci 1997; 17:722–734. [DOI] [PMC free article] [PubMed] [Google Scholar]
- 17.Tallon-Baudry C, Bertrand O, Delpuech C, Pernier J. Stimulus specificity of phase-locked and non-phase-locked 40 Hz visual responses in humans. J Neurosci 1996; 16:4240–4249. [DOI] [PMC free article] [PubMed] [Google Scholar]
- 18.Maris E, Oostenveld R. Nonparametric statistical testing of EEG-and MEG-data. J Neurosci Methods 2007; 164:177–190. [DOI] [PubMed] [Google Scholar]
- 19.Kerlin JR, Shahin AJ, Miller LM. Attentional gain control of ongoing cortical speech representations in a ‘cocktail party’. J Neurosci 2010; 30:620–628. [DOI] [PMC free article] [PubMed] [Google Scholar]
- 20.Müller N, Weisz N. Lateralized auditory cortical alpha band activity and interregional connectivity pattern reflect anticipation of target sounds. Cereb Cortex 2012; 22:1604–1613. [DOI] [PubMed] [Google Scholar]
- 21.Rana KD, Vaina LM. Functional roles of 10 Hz alpha-band power modulating engagement and disengagement of cortical networks in a complex visual motion task. PLoS ONE 2014; 9:e107715. [DOI] [PMC free article] [PubMed] [Google Scholar]
- 22.Ro T, Farnè A, Chang E. Inhibition of return and the human frontal eye fields. Exp Brain Res 2003; 150:290–296. [DOI] [PubMed] [Google Scholar]
- 23.Marshall TR, O’Shea J, Jensen O, Bergmann TO. Frontal eye fields control attentional modulation of alpha and gamma oscillations in contralateral occipito-parietal cortex. J Neurosci 2015; 35:1638–1647. [DOI] [PMC free article] [PubMed] [Google Scholar]
- 24.Mizuhara H, Sato N, Yamaguchi Y. Cortical networks dynamically emerge with the interplay of slow and fast oscillations for memory of a natural scene. Neuroimage 2015; 111:76–84. [DOI] [PubMed] [Google Scholar]