

Abstract
Low trabecular (Tb) and cortical (Ct) volumetric BMD (vBMD) are related to increased fracture risk, but little is known about the patterns and correlates of Tb and Ct vBMD loss with aging. We examined the rates of change in total, Tb.vBMD and Ct.vBMD at the radius and tibia, and identified factors associated with vBMD loss among 1,569 men of African descent aged 40 years and older. Quantitative computed tomography was used to measure vBMD 6 years apart. The annualized rate of loss in Tb.vBMD was significant at the radius (−0.047%/yr, p=0.016) but not tibia. At the radius, a significant loss of Tb.vBMD was observed in men aged 40-49 that appeared to be attenuated and not statistically significant among older age men. In contrast, the decline in Ct.vBMD was similar at both skeletal sites (−0.254 to −0.264%/yr, p<0.0001) and was consistent across all age groups. Positive associations were found for vBMD changes with body weight (all but radius Ct.vBMD) and diabetes (Ct.vBMD only), while negative associations were found with hypertension (all but radius Tb.vBMD), smoking (Ct.vBMD only), and androgen deprivation therapy (cortical vBMD only). Trabecular and cortical vBMD loss appears to follow different patterns among middle- and older-aged men of African ancestry. Factors associated with the decline in vBMD also varied by compartment and anatomical site. Additional studies are needed to better understand the physiological mechanisms underlying early BMD loss among African ancestry men.
Introduction
Despite the lower prevalence of osteoporosis and osteoporotic fractures in men (1-4), the societal and individual burden of osteoporosis in men is expected to increase considerably during the next half century, especially in men of African descent (5). In contrast to our understanding of bone health and osteoporotic risk in women, information about skeletal health in men of African descent is very limited. Bone mineral density (BMD) measured by dual-energy x-ray absorptiometry (DXA) has been widely used to diagnose osteoporosis and predict fracture; however, this two-dimensional imaging technique is confounded by bone size which contributes to gender and racial differences in BMD(6). In contrast, quantitative computed tomography (QCT) provides a three-dimensional assessment of volumetric BMD (vBMD). Moreover, cortical and trabecular bone compartments differ in their properties and physiological functions, and merit a separate evaluation for their roles in overall skeletal health.
Declines in DXA measures of BMD are known to occur after menopause in women and later in life in men, and numerous risk factors for DXA measures of BMD loss have been identified (7-10). However, the patterns of and risk factors for trabecular and cortical BMD loss with aging remain poorly defined. Further, it is unclear if trabecular and cortical BMD loss share the same risk factors as DXA measures of BMD loss. Our previous cross-sectional analyses documented a surprising pattern of significantly lower trabecular vBMD among Afro-Caribbean men 45-49 years old compared to those aged between 40-45 years old, and a steady decline of cortical vBMD among older men (11). An early decline in trabecular vBMD was also documented in a longitudinal study among Caucasian men and women (12). Factors associated with cross-sectional QCT-measures of vBMD differed between the trabecular and cortical bone compartments in our study of Afro-Caribbean men (11) and another study of Caucasian men (13); however, no study, to our knowledge, has investigated the correlates of trabecular and cortical BMD loss among older men. In the present study, we examined the changes in total, trabecular and cortical vBMD with advancing age over an average of 6 years in a large cohort of Afro-Caribbean men to better understand potential risk factors for accelerated BMD loss.
Materials and Methods
Study population
Between 1997 and 2003, 3,170 men aged 40 and older were recruited for population-based prostate cancer screening for the first time on the island of Tobago, Trinidad & Tobago (14). To be eligible, men had to be ambulatory, non-institutionalized and not terminally ill. Recruitment for the initial screening was accomplished by flyers, public service announcements, posters, informing health care workers at local hospital and health centers, and word of mouth. Approximately 60% of all age-eligible men on the island participated and participation was representative of the island parishes. The recruited cohort was 97% African, 2% East Indian, <1% white, and <1% “other” as defined by participant-report of paternal and maternal grandparents’ ethnicity (15).
Between 2004 and 2007, men in the original cohort were invited to complete a peripheral QCT (pQCT) scan, and an additional 451 new participants were also recruited using similar methods and enrollment criteria as the initial screening study. A total of 2,152 men underwent pQCT scans of the radius and tibia at this exam (11). Between 2010 and 2013, we invited these men to return for repeat pQCT scans. Both the baseline and follow-up visits followed the same procedures for questionnaire interviews, biospecimen collection, pQCT and DXA scans (11). A total of 1,605 men have completed the follow-up pQCT exam (80% participation rate among survivors) at the time of this analysis. For the current analysis, we excluded men who were not of African ancestry yielding an analytical cohort of 1,569. The Institutional Review Boards of the University of Pittsburgh and the Tobago Ministry of Health and Social Services approved this study and all participants provided written informed consent before data collection.
Peripheral QCT
QCT scans were performed at the non-dominant forearm and left tibia using the Stratec XCT-2000 scanner (Stratec Medizintechnik, Pforzheim, Germany). Technicians followed a standardized protocol for patient positioning and scanning at both the baseline and follow-up visits. A scout view was initially obtained prior to the baseline pQCT scan to define an anatomic reference line for the relative location of the subsequent scans at the radius and tibia. Tibia length was measured from the medial malleolus to the medial condyle of the tibia, and forearm length was measured from the olecranon to the ulna styloid process. Scans were taken at 4% and 33% of the total length of forearm and tibia. Measurements at the 4% radius and tibia sites represent predominantly trabecular bone, whereas measurements at the 33% sites represent predominantly cortical bone. Total (integral) volumetric BMD was also available at the 4% and 33% sites of the radius and tibia. A single axial slice of 2.5mm thickness with a voxel size of 0.5 mm and a speed of 20 mm/s was taken at all locations. Image processing was performed by a single investigator using the Stratec software package (Version 5.5E). All ultradistal radius and tibia scans were analyzed using identical parameters for contour finding and separation of trabecular and cortical bone (contour mode 2, T=169 mg/cm3; peel mode 1, area=45%) to determine the vBMD of the trabecular (mg/cm3) rich bone compartment. All proximal radius and tibia scans were analyzed using identical parameters for contour finding and separation of total and cortical bone (contour mode 2, T=169 mg/cm3; cortmode 1, T=710 mg/cm3) to determine the vBMD of the cortical (mg/cm3) rich bone compartment. Coefficients of variation were determined for pQCT scans by replicating measurements on 15 subjects with CV ≤ 2.1% for all measures. Daily phantom scans were analyzed to ensure long-term scanner stability.
Anthropometric and body composition measurements
Body weight was measured in kilograms with participants wearing light clothing and without shoes using a calibrated balance beam scale. Height was measured in centimeters without participants wearing shoes using a wall-mounted height board. Two height measurements were made and the average used in analysis. Waist circumference was measured at the umbilicus with an inelastic tape measure. Overall percent changes in body weight and waist circumference from baseline to follow-up visits were also included as potential risk factors for vBMD loss. Body mass index (BMI) was calculated as weight in kilograms divided by height in meters squared. Handgrip strength was measured in kilograms for both the left and right hands as a surrogate for upper body and overall strength using a dynamometer (Preston Grip Dynamometer, JA Preston 136 Crop.). Average grip strength was based on two repeated measurements from left and right hands.
Other measurements
Trained interviewers and nurses administered questionnaires to participants. We focused on potential correlates of BMD based on the body of literature for men and women. We collected information pertaining to demographic characteristics, medical history, medication use, personal and family fracture history, physical activity, and lifestyle habits. Ethnicity was self-reported and participants provided detailed information on the ethnic origin of their parents and grandparents. Afro-Caribbean men who reported having less than 4 African grandparents were categorized as mixed African ethnicity.
Participants were asked whether they had been diagnosed by a health care provider with selected conditions including cardiovascular diseases, diabetes, respiratory diseases, hypertension, cancer and fracture. Information on family history of fracture, diabetes and hypertension were also obtained. Personal history of diabetes was defined as having a history of using diabetes medications or a fasting glucose level of 126mg/dL and above. Hypertensive men were defined as having a systolic blood pressure of 149 and above, diastolic blood pressure of 90 and above, or use of anti-hypertensive medication. Men were asked to report their history of selected medications as well as current medication use. We also documented if men underwent androgen deprivation treatment (ADT) by hormonal or surgical castration for prostate cancer. Participants also rated their overall health status compared to men their own age.
Smoking was defined as having smoked at least 100 cigarettes in their lifetime. Alcohol use was defined as having consumed 4 or more drinks per week in the past 12 months. Physical activity was assessed by whether or not participants walked for exercise, to work, the store or church in the past 7 days. We also used hours of television watching per week as a surrogate of physical inactivity. Dietary calcium intake was assessed by frequency of selected food items including fish, bone chewing, green leafy vegetables, beans, milk, cheese, and cheese dishes that contain high dietary calcium and are frequently consumed in the local diet.
Statistical Analysis
Changes in total, trabecular and cortical vBMD were calculated as a percentage change (%) in these measures from the baseline to the follow-up visits. The percentage change in these measures was further divided by follow-up time in years to yield annualized rates of change in vBMD (%/yr). Analysis of covariance (ANCOVA) was used to compare the rate of change in skeletal site-specific total, trabecular cortical vBMD across 5-year age groups with and without adjustment for the corresponding baseline vBMD measures. We evaluated linear associations of each predictor with total percentage change in total, cortical and trabecular vBMD at the radius and tibia separately using linear regression analysis with adjustment for age and follow-up duration in years. The relationships between potential correlates and bone measures were expressed as a one unit increase for categorical variables or approximately a one standard deviation (SD) increase for continuous variables, along with 95% confidence intervals, unless otherwise noted. In order to identify the independent correlates, separate multiple linear regression models were performed using a stepwise procedure for vBMD measure at the radius and tibia. Variables with less than 5 observations were not considered for multiple linear regression models. A P-value of 0.10 in the univariate model was required to allow a variable to enter the multiple regression model. A P-value <0.05 was required for a variable to remain in the multiple regression model. Age and follow-up duration were forced into the multiple regression models. To avoid unstable individual parameter estimations due to multicollinearity, we entered only one variable from the same domain (e.g., “weight”, “waist” and “BMI”) into the multiple linear regression model based on the overall strength of the associations with all the skeletal outcomes. Independent correlates identified through the stepwise procedures were evaluated further for potential multicollinearity using the variance inflation factor method. The same stepwise and multicollinearity methods were used for secondary analyses of specific subsets of study participants (e.g., we repeated analyses among men not on antihypertensive or diabetic medications). Based on the results from the multivariable models, we then evaluated annualized rate of change in vBMD across age groups adjusting for the independent covariates for each vBMD change variable. All statistical analyses were performed using the Statistical Analysis System (SAS, version 9.1; SAS Institute, Cary, NC).
Results
Rates of change in vBMD
The 1,569 men included in this analysis had a mean age of 56.8 ± 9.1 years (range: 41-88) at the baseline visit. Baseline characteristics of the study population at the initial pQCT exam are shown in Table 1. Men experienced a statistically significant loss in total, trabecular and cortical vBMD over the average of 6.2 ± 0.5 years follow-up (range: 4.9-8.7 years). At the radius, the annualized percentage change in trabecular and cortical vBMD were −0.047±0.767% (p=0.016) and −0.254±0.222% (p<0.0001), respectively. For total vBMD, the annualized percentage changes were −0.101±1.083% (p=0.002) at the 4% site and −0.416±0.459% (p<0.0001) at the 33% site of the radius. At the tibia, the percentage changes in trabecular and cortical vBMD were 0.006 ±0.707% (p=0.76) and −0.264±0.198% (p<0.0001). For total vBMD, the annualized percentage changes were −0.345±0.535% (p=<0.0001) at the 4% site and −0.483±0.337% (p<0.0001) at the 33% site of the tibia. Annualized rates of change in skeletal measures across 5-year age groups are shown in Figure 1 (trabecular and cortical vBMD) and Figure 2 (total vBMD). We observed no difference in models with and without adjustment for baseline vBMD measures; therefore all models presented in these two figures do not account for baseline vBMD measures. In the unadjusted model, there was a statistically significant decline in trabecular vBMD of −0.701%/yr (p=0.0066) among men aged 40-44 years old and −0.136%/yr (p=0.0031) among those 45-49 years old at the radius. At the tibia site, while there was no significant decrease in trabecular vBMD in any age group, a significant increase of 0.091%/yr (p=0.0182) and 0.109%/yr (p=0.0137) was observed among those 50-54 and 55-59 years old, respectively. There was no statistically significant trend in trabecular vBMD across age groups (p-value for trend: 0.3128 for radius and 0.1586 for tibia). For cortical vBMD, statistically significant declines were found among all age groups and at both skeletal sites. The rate of loss in cortical vBMD appeared to decelerate with increasing age at the radius only (p-value for trend: 0.0026 for radius and 0.3863 for tibia). For total vBMD changes at the 4% and 33% site of the radius and tibia, the declines across all age groups were statistically significant except for 4% radius site. At this site, the only significant decline was observed for age groups 60-64 (−0.148%/yr, p=0.047) and 70+ (−0.273%/yr, p=0.001), while a borderline significant decline was found for men aged 65-69 years old (−0.168%/yr, 0.053). The trend for total vBMD with increasing age was only significant at the 4% site of the radius (p=0.015) and tibia (p<0.0001), but not at the 33% sites.
Table 1.
Baseline characteristics
| Characteristic | Mean ± SD or frequency (%) |
|---|---|
| 56.8 ± 9.1 | |
| Mixed Afro-Caribbean descent | 131 (8.5%) |
| Anthropometric measures | |
| Body Weight (kg) | 85.0 ± 14.8 |
| Height (cm) | 175.5 ± 6.9 |
| Waist circumference (cm) | 93.2 ± 11.0 |
| BMI (kg/m2) | 27.6 ± 4.4 |
| Grip Strength (kg) | 44.4 ± 9.6 |
| Weight change (%) | 0.02 ± 6.9 |
| Waist circumference change (%) | 5.44 ± 6.4 |
| Systolic blood pressure (mmHg) | 137.3 ± 22.1 |
| Diastolic blood pressure (mmHg) | 81.0 ± 12.8 |
| Medical History | |
| Hyperthyroid | 12 (0.8%) |
| Stroke | 21 (1.4%) |
| Heart attack | 10 (0.6%) |
| Congestive heart failure | 18 (1.2%) |
| Cardiovascular diseases | 51 (3.3%) |
| Asthma | 42 (2.7%) |
| Lung diseases | 59 (3.8%) |
| Anemia | 14 (0.9%) |
| Hepatitis | 6 (0.4%) |
| Any cancer | 105 (6.7%) |
| Prostate cancer | 98 (6.3%) |
| Kidney stone | 29 (1.9%) |
| Arthritis (general) | 179 (11.5%) |
| Rheumatoid arthritis | 19 (1.2%) |
| Degenerative arthritis (osteoarthritis) | 35 (2.3%) |
| Any fracture | 326 (21.2%) |
| Hypertension1 | 766 (48.8%) |
| Maternal hypertension history | 523 (34.1%) |
| paternal hypertension history | 169 (11.0%) |
| Diabetes2 | 257 (16.9%) |
| Back pain | 670 (43.0%) |
| Number of chronic diseases (up to 16) | |
| 0 | 597 (38.3%) |
| 1 | 652 (41.8%) |
| 2 | 244 (15.6%) |
| 3 | 56 (3.6%) |
| 4 | 10 (0.6%) |
| 5 | 1 (0.1%) |
| 3 or more chronic diseases | 67 (4.3%) |
| Self-rated excellent/good health | 1463 (94.4%) |
| Behavior & lifestyle | |
| Walk in the past 7 days | 967 (62.1%) |
| Alcohol consumption (> 4 drinks/week) | 163 (10.5%) |
| Watching TV>=14 hrs/week | 597 (38.4%) |
| Smoking status | |
| Never | 1063 (68.1%) |
| Past | 332 (21.3%) |
| Current | 165 (10.6%) |
| Androgen deprivation therapy (ADT) | |
| Orchiectomy | 11 (0.7%) |
| Ever taken anti-androgen drugs | 43 (2.8%) |
| Currently taking anti-androgen drugs | 23 (1.5%) |
| Orchiectomy & currently taking anti-androgen drugs | 33 (2.1%) |
| Medication | |
| NSAID | 35 (2.2%) |
| Thiazide diuretics | 129 (8.2%) |
| Non-thiazide diuretics | 25 (1.6%) |
| Statins | 18 (1.2%) |
| Nitrates | 6 (0.4%) |
| Beta-blocker | 52 (3.3%) |
| Diabetes medication | 177 (11.6%) |
| Anti-hypertension medication | 379 (24.2%) |
| Calcium channel blockers | 87 (5.5%) |
| ACE inhibitors§ | 163 (10.4%) |
| Angiotensin II AT1 receptor blockers | 10 (0.6%) |
| Proton pump inhibitors | 10 (0.6%) |
| Oral anticoagulant (not including anti-platelet) | 5 (0.3%) |
| Oral anticoagulant (including anti-platelet) | 80 (5.1%) |
| Anti-thrombotic agents | 85 (5.4%) |
ACE: angiotensin converting enzyme
Figure 1.
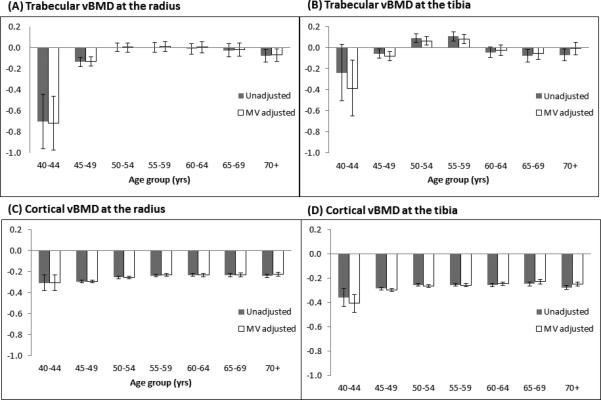
Annualized percentage rates of change (%/yr) in trabecular and cortical vBMD across different age groups: unadjusted and multivariable adjusted models.
Panel (A): Rate of trabecular vBMD change at the radius. A significant rate of decline was found for age groups 40-44 and 45-49 only; Panel (B): Rate of trabecular vBMD change at the tibia. A significant increase was found for age groups 50-54 and 55-59 only; Panel (C): Rate of cortical vBMD change at the radius. All rates of change were statistically significant; Panel (D): Rate of cortical vBMD change at the tibia. All rates of change were statistically significant.
Figure 2.

Annualized percentage rates of change (%/yr) in total vBMD across different age groups: unadjusted and multivariable adjusted models.
Panel (A): Rate of total vBMD change at the 4% radius. A significant rate of decline was found for age groups 60-64 and 70+; Panel (B): Rate of total vBMD change at the 4% tibia. All rates of decline were statistically significant; Panel (C): Rate of total vBMD change at the 33% radius. All rates of decline were statistically significant; Panel (D): Rate of total vBMD change at the 33%tibia. All rates of decline were statistically significant.
Baseline correlates of vBMD changes in univariate models
Table 2 and 3 summarizes the relationships of each baseline characteristic with the total percentage change in total, trabecular and cortical vBMD at the radius and tibia from the univariate models adjusted for age and follow-up time. Only results with p-values less than 0.10 are shown. Age was associated with an increase in cortical vBMD at the radius, but decrease in total vBMD at the 4% radius site and at the 4% and 33% tibia sites. Body weight, BMI and waist circumference at baseline were positively associated with rates of change in trabecular vBMD at the tibia and radius and cortical vBMD at the tibia. For cortical vBMD, an increase in body weight or waist circumference during follow-up was related to a decrease in cortical vBMD. Greater grip strength was associated with a loss in cortical vBMD at the tibia. History of congestive heart failure was related to total, trabecular and cortical vBMD loss at the 4% tibia site. Cardiovascular disease was only associated with a decline in total vBMD at the 33% radius site. Having a history of any cancer or prostate cancer was associated with a loss in all vBMD measures except cortical vBMD at the tibia. We also found negative associations between treatment with androgen deprivation for prostate cancer and bone loss, except trabecular vBMD at the tibia. Hypertension was associated with a significant loss of total and cortical vBMD at the 4% tibia site and the 33% site at the radius and tibia. Diabetes and the use of diabetes medications were related to increased vBMD except for tibial trabecular vBMD. Having 3 or more chronic diseases was only associated with a decline in total vBMD, but not with trabecular or cortical vBMD. Smoking was associated with cortical, but not trabecular vBMD loss. Use of thiazide diuretics was related to an increase in trabecular vBMD at the tibia and total vBMD at the 33% tibia. Calcium channel blocker use was associated with a decrease in total vBMD, but not with trabecular or cortical vBMD.
Table 2.
Percent change in trabecular and cortical vBMD at the radius and tibia per unit change in baseline correlates: univariate model (only correlates with significant associations (p-value <0.10) are shown).
| Baseline characteristics | Unit | Trabecular BMD | Cortical BMD | ||
|---|---|---|---|---|---|
| Radius | Tibia | Radius | Tibia | ||
| Age, unadjusted (yr) | 10 | 0.121* | |||
| Anthropometric measures | |||||
| Body Weight (kg) | 14.8 | 0.227 | 0.241 | 0.081* | |
| Waist circumference(cm) | 11.0 | 0.413* | 0.293* | 0.083* | |
| BMI (kg/m2) | 4.4 | 0.284* | 0.266* | 0.077* | |
| Weight change (%) | 6.9 | 0.301* | −0.100* | −0.073* | |
| Waist circumference change (%) | 6.4 | −0.090* | −0.096* | ||
| Grip Strength (kg) | 9.6 | 0.094* | |||
| Medical History | |||||
| Stroke | Yes | −2.170* | |||
| Heart attack | Yes | −0.849 | |||
| Congestive heart failure | Yes | −1.935 | −0.822* | −0.581 | |
| Cardiovascular diseases | Yes | −1.182 | |||
| Lung diseases | Yes | 1.158 | |||
| Anemia | Yes | −2.330 | |||
| Cirrhosis | Yes | 2.593 | |||
| Any cancer | Yes | −0.889 | −1.235* | −0.248 | |
| Prostate cancer | Yes | −0.872 | −0.323* | ||
| Kidney stone | Yes | 0.546* | 0.450 | ||
| Osteoporosis | Yes | −1.394 | −0.420 | ||
| Osteoarthritis | Yes | 0.504* | |||
| Hypertension1 | Yes | −0.172* | |||
| Diabetes2 | Yes | 0.687* | 0.334* | 0.265* | |
| Self-rated excellent/good health | Yes | −0.291* | |||
| Behavior & lifestyle | |||||
| Walk in the past 7 days | Yes | −0.626* | 0.119 | ||
| Ever smoked | Yes | −0.165* | |||
| Currently smoke | Yes | −0.191 | |||
| Medication | |||||
| Active ADT treatment | Yes | −1.983* | −0.987* | −0.781* | |
| Thiazide diuretics | Yes | 1.104* | |||
| Non-thiazide diuretics | Yes | 1.845 | |||
| Statins | Yes | 2.041 | |||
| Nitrates | Yes | −3.722* | |||
| Diabetes medication | Yes | 0.691 | 0.352* | 0.283* | |
| Calcium channel blockers | Yes | 0.872 | −0.285 | ||
| Proton pump inhibitors | Yes | −2.688 | |||
Indicates p-value <0.05
Table 3.
Percent change in total vBMD at the radius and tibia per unit change in baseline correlates: univariate model (Only correlates with significant associations (p-value <0.10) are shown).
| Baseline characteristics | Unit | Total vBMD | Total vBMD | ||
|---|---|---|---|---|---|
| Radius 4% site | Tibia 4% site | Radius 33% site | Tibia 33% site | ||
| Age, unadjusted (yr) | 10 | −0.521* | −0.452* | −0.120* | |
| Anthropometric measures | |||||
| Body Weight (kg) | 14.8 | 0.141 | 0.102 | ||
| Height(cm) | 6.9 | −0.176* | 0.153 | ||
| Weight change (%) | 6.9 | −0.226* | |||
| Waist circumference change (%) | 6.4 | −0.191* | −0.194* | ||
| Grip Strength (kg) | 9.6 | 0.325* | 0.112 | ||
| Medical History | |||||
| Congestive heart failure | Yes | −2.673* | |||
| Cardiovascular diseases | Yes | −1.079 | −0.824* | ||
| Cirrhosis | Yes | −6.424 | |||
| Any cancer | Yes | −1.529* | −1.257* | −0.707* | −0.615* |
| Prostate cancer | Yes | −1.312 | −1.271* | −0.794* | −0.641* |
| Kidney stone | Yes | 0.722 | |||
| Hypertension1 | Yes | −0.612* | −0.416* | −0.262* | |
| Diabetes2 | Yes | 0.726* | |||
| Self-rated excellent/good health | Yes | −0.464 | |||
| 3 or more chronic diseases | Yes | −1.220* | −0.794* | −0.518* | |
| Behavior & lifestyle | |||||
| Watching TV>=14 hrs/week | Yes | −0.638 | |||
| Ever smoked | Yes | −0.301 | |||
| Medication | |||||
| NSAID | Yes | −0.977 | |||
| Active ADT treatment | Yes | −5.373* | −2.435* | −3.524* | −1.524* |
| Thiazide diuretics | Yes | 0.400* | |||
| Hypertension treatment | Yes | −0.489 | −0.217 | ||
| Diabetes medication | Yes | 0.739* | |||
| Calcium channel blockers | Yes | −1.956* | −1.387* | −0.626* | |
| ACE inhibitors§ | Yes | −0.756* | |||
| Warfarin | Yes | −1.736* | |||
Indicates p-value <0.05
ACE: angiotensin converting enzyme
Independent baseline correlates
Results from the multivariable model are shown in Table 4 and 5. Greater body weight at baseline was associated with increase in trabecular vBMD at both skeletal sites. Weight loss during follow-up was associated with decreased trabecular vBMD at the tibia but not radius. Thiazide diuretic use was associated with increase in trabecular bone. Additional independent correlates associated with trabecular bone loss at the radius included walking in the past 7 days and use of proton-pump inhibitors, as well as hypertension and prostate cancer at the tibia site. Cortical bone loss at the radius and tibia shared several independent correlates including diabetes, hypertension, active use of ADT, and having ever smoked. Weight gain was related to cortical bone loss at the radius. At the tibia, mixed race, greater body weight and greater grip strength were associated with an increase in cortical bone. Congestive heart failure was independently associated with cortical bone loss.
Table 4.
Percent change in vBMD at the radius and tibia per unit change in baseline correlates: multivariable model.
| Correlates | Unit | Trabecular BMD | Cortical BMD | ||
|---|---|---|---|---|---|
| Radius | Tibia | Radius | Tibia | ||
| Age (yr)* | 10 | 0.44 (0.06, 0.36) | 0.07 (−0.22, 0.37) | 0.17 (0.08, 0.25) | 0.16 (0.08, 0.25) |
| Follow-up time* | 1 | 0.12 (−0.36, 0.61) | −0.78 (−1.23, −0.32) | −0.27 (−0.41, −0.14) | −0.30 (−0.43, −0.17) |
| Mixed race | Yes | 0.30 (0.05, 0.55) | |||
| Weight | 14.8 | 0.32 (0.06, 0.57) | 0.41 (0.15, 0.68) | 0.09 (0.02, 0.16) | |
| Weight change | 6.8 | 0.39 (0.15, 0.64) | −0.10 (−0.17, −0.02) | ||
| Grip Strength | 9.5 | 0.10 (0.02, 0.18) | |||
| Congestive heart failure | Yes | −0.83 (−1.50, −0.16) | |||
| Diabetes | Yes | 0.32 (0.12, 0.52) | 0.24 (0.05, 0.42) | ||
| Hypertension | Yes | −0.54 (−1.08, −0.01) | −0.17 (−0.32, −0.02) | −0.14(−0.29, −0.03) | |
| Prostate cancer | Yes | −1.39 (−2.40, −0.37) | |||
| Active ADT | Yes | −0.79 (−1.32, −0.26) | −0.81 (−1.29, −0.33) | ||
| Ever smoked | Yes | −0.19 (−0.35, −0.04) | −0.15(−0.29, −0.005) | ||
| Walk in the past 7 days | Yes | −0.73 (−1.25, −0.20) | |||
| Thiazide diuretics | Yes | 1.43 (0.51, 2.35) | |||
| Proton-pump inhibitors | Yes | −3.10 (−5.94, −0.08) | |||
| R2 | 0.015 | 0.031 | 0.048 | 0.052 | |
Age and follow-up time were forced into the model
Table 5.
Percent change in total vBMD at the radius and tibia per unit change in baseline correlates: multivariable model.
| Correlates | Unit | Total vBMD | Total vBMD | ||
|---|---|---|---|---|---|
| 4% radius site | 4% tibia site | 33% radius site | 33% tibia site | ||
| Age (yr)* | 10 | −0.596 (−0.996, −0.195) | −0.215 (−0.422, −0.009) | 0.177 (−0.019, 0.373) | −0.030 (−0.164, 0.103) |
| Follow-up time* | 1 | −0.084 (−0.753, 0.584) | −0.657 (−0.991, −0.322) | −0.154 (−0.433, 0.126) | −0.401 (−0.615, −0.186) |
| Weight change | 6.8 | −0.205 (−0.318, −0.092) | |||
| Height | 6.9 | 0.173 (0.058, 0.288) | |||
| Grip Strength | 9.5 | 0.349 (0.179, 0.519) | |||
| Self-rated excellent/good health | Yes | −0.536 (−1.033, −0.040) | |||
| Congestive heart failure | Yes | −2.260 (−4.051, −0.469) | |||
| Anemia | Yes | −2.176 (−4.100, −0.252) | |||
| Diabetes | Yes | 0.912 (0.512, 1.312) | |||
| Hypertension | Yes | −0.612 (−0.993, −0.231) | −0.552 (−0.857, −0.246) | −0.358 (−0.599, −0.118) | |
| Prostate cancer | Yes | −0.860 (−1.671, −0.049) | |||
| Active ADT | Yes | −4.319 (−6.860, −1.779) | −2.368(−3.736, −0.999) | −0.400 (−4.463, −2.336) | −1.785 (−2.587, −0.984) |
| Ever smoked | Yes | −0.330 (−0.644, −0.017) | |||
| Statins | Yes | 1.840 (0.172, 3.508) | |||
| Thiazide diuretics | Yes | 1.780 (0.441, 3.119) | −0.953 (0.263, 1.643) | 0.609 (0.175, 1.044) | |
| Calcium-channel blocker | Yes | −2.743 (−4.370, −1.116) | −1.692 (−2.523, −0.860) | ||
| Anti-thrombotic agents | Yes | 1.815 (0.184, 3.446) | |||
| R2 | 0.028 | 0.075 | 0.063 | 0.050 | |
Age and follow-up time were forced into the model
For total vBMD, independent correlates that were associated with more than two skeletal sites were hypertension and use of ADT, thiazide diuretics and calcium channel blockers. Congestive heart failure and prostate cancer were related to total vBMD loss at the 4% tibia site, while diabetes was related to an increase in total vBMD at the 33% radius site. Weight change, baseline height and self-rated excellent/good health were only associated with total vBMD at the 33% tibia site. Anti-thrombotic agents were associated with total vBMD loss at the 4% radius site and use of statins were associated with total vBMD loss at the 4% tibia site.
We re-evaluated the annualized rate of change in vBMD by 5-year age groups with adjustment for corresponding independent correlates for each vBMD measurement (Figure 1 and 2). The unadjusted and adjusted loss for each vBMD measure was similar in magnitude except for trabecular vBMD at the radius where the adjusted model showed greater loss for age group 40-44 than unadjusted model.
Blood pressure, insulin and glucose as independent correlates
Because hypertension was a consistent independent correlate with vBMD loss, we further examined the association of baseline systolic and diastolic blood pressure among men who were not on anti-hypertensive treatment (n=1,166). Higher systolic blood pressure was associated with loss of cortical vBMD at both the radius and tibia among untreated men, while diastolic blood pressure showed similar associations at the radius. For total vBMD, higher systolic blood pressure was an independent and positive correlate at the 33% tibia site only, while no association was found with diastolic blood pressure (data not shown).
Likewise, because diabetes was consistently correlated with bone loss we also examined the association of baseline insulin and glucose with bone loss in a subset of men who were not on anti-diabetic treatment (n=1,389). We found no association between fasting glucose and longitudinal changes in trabecular and cortical bone. However, fasting insulin was significantly associated with increased trabecular vBMD and total vBMD at the 4% site of the tibia. (data not shown).
Discussion
Our study described the patterns and potential correlates of pQCT-measured total, trabecular and cortical bone loss at the radius and tibia among men of African descent. To our knowledge, this is the largest population-based study describing longitudinal changes in pQCT parameters, and is also the first to characterize trabecular and cortical vBMD loss among men of African descent. Over 6 years of follow-up, we observed a steady loss of cortical vBMD across all age groups. In contrast, we only observed a significant loss of trabecular vBMD at the radius among men age 40-49 years old. Total vBMD at the predominantly cortical rich radius and tibia sites (33%) followed similar patterns as cortical vBMD but with a slightly greater magnitude of loss. Although an early loss of total and trabecular vBMD was observed at the 4% radius site among age group 40-44 followed by no loss until ages 60 years old for total vBMD and 70 years old for trabecular vBMD, the early loss of total vBMD was not statistically significant. At the 4% tibia site, the pattern for total and trabecular loss was vastly different. While no significant loss in trabecular vBMD was observed at the tibia, all age groups experienced a significant loss of total vBMD. Adjustments for covariates had little impact on age related patterns in vBMD loss.
Our finding of an early trabecular and cortical vBMD loss among young adult men of African descent has not been described previously. We previously reported in a cross-sectional analysis of this cohort that younger-aged men had a significantly lower trabecular vBMD than older-aged men (11). An early loss of trabecular bone has also been observed among Caucasian men in two longitudinal studies (12, 16). In a sample of 540 men from the InChianti study, a steeper loss in trabecular vBMD over 6 years was observed in men aged 60 and younger (16). Riggs et al. found a significant loss in trabecular vBMD at the radius and tibia over 3 years starting as early as aged 40 years among 325 men aged 20-97 (12). Although androgen deprivation therapy had a detrimental effect on DXA measures of areal hip BMD loss in our previous analyses of this cohort (17), it did not explain the early trabecular bone loss in the current analysis. Moreover, an evaluation of the relationship between endogenous sex steroid hormone concentrations with trabecular vBMD changes failed to explain the early bone loss among young adult men (12). Our attempt to identify risk factors associated with early trabecular vBMD loss was hindered by the relatively small number of men aged 40-49 in our cohort. Additional research is clearly needed to better understand the biological and clinical factors associated with early trabecular and cortical bone loss in men. Moreover, larger studies with longer follow-up will be needed to better document the potential clinical significance of early trabecular and cortical vBMD loss in men.
Our study also observed significant cortical vBMD loss in all age groups. Compared to men aged 50 and above, the rate of decline was slightly greater for men between 40-49 years old and remained steady after aged 50 years old at both the radius and tibia. There was no progressive acceleration for cortical vBMD loss in our cohort. Riggs et al. also observed a statistically significant decline in cortical vBMD in young men. The rate of decline in cortical vBMD remained steady until age 75, after which the rate of loss in cortical bone accelerated (12). Power in the current study among men age 75 and older was limited as there were only 17 men in this age group. The decline in vBMD with advancing age in men has been attributed to changes in endogenous sex steroid hormones, especially bioavailable estradiol (18, 19), although these studies have primarily relied on DXA measures of areal BMD. Less is known about the relationship of sex steroid hormone levels and changes in cortical and trabecular vBMD in young adult men. We did not have bioavailable sex steroid hormone levels available on sufficient numbers of men to examine this relationship but current use of androgen deprivation therapy was an independent correlate of changes in cortical vBMD in our cohort.
To our knowledge, no studies have extensively evaluated factors potentially associated with changes in QCT measures of vBMD with advancing age. In the present study, higher baseline body weight was associated with less loss of trabecular vBMD at both the radius and tibia and less loss of cortical vBMD at the tibia. A positive association between body weight and trabecular vBMD is not surprising given the known protective effect of body weight and BMI on osteoporotic risk (8, 20, 21) and the known detrimental effect of weight loss on DXA measures of BMD (9, 22-26). In addition, weight loss with increasing age has also been documented as a consistent predictor of DXA measures of BMD loss in studies of Caucasian men (9, 22-25) as well as in African ancestry men (7). However, in the current analysis we found that weight gain during follow-up was associated with a greater loss of cortical vBMD at the radius and total vBMD at the 33% tibia site. It is thought that greater mechanical loading resulting from greater body weight increases bone strength by promoting structural adaptations (27), and greater adipose tissue accompanied by greater body weight increases hormone levels associated with increased bone formation (28). However, we (11) and others (13) have found an opposite association between body weight and cortical BMD in men. It is possible that increased mechanical loading can also lead to micro-damage of bone (29) and increased adipocytes in the bone marrow compartment can suppress the differentiation of mesenchymal stem cells into osteoblasts (30). Bone may adapt weight gain by increasing periosteal bone diameters, and consequently results in decrease in cortical vBMD. Additionally, weight gain can also reflect poor health and physical inactivity. Additional research is needed to better understand the influence of body weight on cortical bone changes at different anatomical sites with age.
Factors associated with changes in skeletal measures were complex and varied by bone compartment (trabecular vs. cortical) and anatomical site (radius vs. tibia). Among the baseline medical history variables examined, diabetes, hypertension and cancer (especially prostate cancer and its treatment) showed consistent relationships with the pQCT bone loss measures in multivariable models. The association of diabetes differed by bone compartment. Diabetes was associated with greater trabecular and cortical vBMD in our previous cross-sectional analysis of these men (11), and with greater trabecular vBMD at the spine in black women and white men in another study (31). However, some studies found no association with either trabecular (32) or cortical vBMD (33). In our longitudinal analysis, diabetes was related to an increase in cortical vBMD and total vBMD at 33% radius site, but was not associated with trabecular vBMD. Although diabetes may be associated with higher BMD or slower bone loss these skeletal changes do not appear to translate into lower fracture risk (34). Indeed, diabetes has been associated with increased fracture risk in older men and women (34). Diabetes-related alterations in mechanical loading, adipose-derived hormones, pharmaceutical treatment, hyperglycemia, hyperinsulinemia, and medical complications are among the proposed mechanisms for the skeletal changes and increased fracture risk (35, 36).
In our analysis, hypertension was related to vBMD loss except for trabecular and total vBMD at the 4% radius. Hypertension has been inversely correlated with DXA measures of BMD and with increased fracture risk (37, 38). Calcium loss associated with high blood pressure has been considered a possible mechanism (38). However, some studies observed no or a positive association between hypertension and DXA measures of BMD or QCT measures of vBMD (13, 39, 40). The inconsistent findings might be due to the potential confounding effects of hypertension and anti-hypertensive medication use. For example, antihypertensive medications such as thiazide diuretics are known to have a positive association with DXA BMD and QCT vBMD (41, 42). We found a decrease in cortical vBMD with increasing systolic blood pressure. This finding reflected the association of higher blood pressure with vBMD and was not due to potential confounding by antihypertensive drugs. Alternatively, the negative impact of hypertension on vBMD loss might also be due to residual confounding from overall poorer health, more co-morbidities and reduced physical activity among hypertensive individuals. However, our multivariable analysis showed that hypertension remained a significant risk factor for vBMD loss after controlling for other anthropometric measurements, medical conditions, and lifestyle factors including physical activity. The association between hypertension and vBMD loss requires further research and may have important public health implications due to the high prevalence of hypertension in blacks and the high proportion of untreated hypertensive blacks (43).
Although prostate cancer itself was not a consistent independent correlate in our final models, its treatment with androgen deprivation was. Prostate cancer disproportionately affects more men of African ancestry world-wide than other ethnic and racial groups (14, 44) Androgen deprivation therapy, achieved surgically through orchiectomy or through gonadotropin-releasing hormone agonists, is a first-line treatment for metastatic prostate cancer (45). Similar to our previous cross-sectional assessment of vBMD and longitudinal assessment of DXA-measured BMD loss (7, 11), the detrimental effect of androgen deprivation therapy on cortical bone loss in the present study was evident even though only a relatively small proportion of men had a past history (2.8%) or were undergoing active (2.1%) androgen deprivation. These men had significantly greater loss of cortical vBMD independent of other variables. Our findings support studies in Caucasian men where a rapid loss of DXA-measured BMD (46-48) and higher risk of fracture (45, 49, 50) have been associated with androgen deprivation therapy.
Nicotine may directly affect bone metabolism by inhibiting the proliferation of osteoprogenitor cells in a concentration-dependent manner (51, 52). As such, numerous studies have found detrimental effects of cigarette smoking on cross-sectional (21, 53) and longitudinal measures of BMD (9, 23, 25). Its relationship vBMD have been less consistent. Negative associations have been found with trabecular vBMD (11, 40, 53) whereas no (11, 53) or positive (40) associations have been reported for cortical vBMD. However, in the present study, smoking was related to greater cortical bone loss.
Potential limitations of the current analysis include the potential for recall bias from questionnaire assessments as well as selection bias from the inclusion of voluntary participants who may possess different characteristics than the larger population from which they were recruited. Our focus on an Afro-Caribbean population group that is less-admixed than African Americans (15) minimized potential effects caused by genetic heterogeneity; however, it may also limit the generalizability of our study results. Our assessment of historical physical activity was limited to questionnaires and physical activity might be an important contributor to the early vBMD loss that we have observed. The magnitude of vBMD loss is relatively low compared to that for DXA measures of BMD loss; thus, further research is needed to determine the clinical significance of vBMD loss in this population. Nonetheless, our study is the first large cohort study to evaluate pQCT measures of BMD loss and the potential risk factors for these changes in men of African descent. The wealth of variables assessed and relatively large sample size also provided an opportunity to gain insight into potential protective and risk factors for trabecular and cortical bone loss. The availability of pQCT-derived trabecular and cortical bone measurements enabled us to look beyond conventional DXA-based integral BMD measures to better understand potential bone compartment specific associations. Besides volumetric bone density, bone geometry is another important determinant of bone strength and fracture risk. While BMD decreases with advancing age, impairments in bone geometry also occur and consequently lead to weak bone strength and increased fracture risk. For example, cortical bone area and width tend to increase with aging due to periosteal apposition, whereas endocortical diameters increase with aging as the result of endocortical resorption. When periosteal apposition fails to keep up with endosteal resorption, thinning and weakening of the cortical bone occur (54). Indeed, lower cortical thickness has been found in men with hip fracture than those without (55, 56). To better understand factors associated with longitudinal changes in bone strength and clinical significance of changes in bone strength/quality, bone geometry merit further investigation.
In conclusion, the loss of total, trabecular and cortical vBMD with advancing age follows different patterns across the lifespan in our cohort of African ancestry men. Trabecular vBMD loss appears to occur early in life and slows throughout middle-age, whereas total and cortical vBMD loss appears to be slightly greater early in life, and continues through the 7th decade of life. Moreover, the correlates of vBMD loss may differ depending on the skeletal site (radius vs. tibia) and bone compartment (trabecular vs. cortical) examined. Finally, some of the factors identified for accelerated vBMD loss in our cohort, such as hypertension and treatment of prostate cancer with androgen deprivation, may ultimately help to identify black men at increased risk for developing osteoporosis.
Acknowledgements
This research was supported, in part, by funding or in-kind services from the Division of Health and Social Services and Tobago House of Assembly, by grants R01-AR049747 from the National Institute of Arthritis and Musculoskeletal and Skin Diseases, and by R01-CA84950 from the National Cancer Institute. The authors would like to thank all supporting staff from the Tobago Health Study Office.
Authors’ roles
Study design: JMZ, CHB, ALP, VWW. Study conduct: JMZ, CHB, ALP, VWW. Data collection and management: RKC and PJ. Data analysis: YS, RKC and PJ. QCT scan analysis and quality control: CLG. Data interpretation: YS and JMZ. Drafting manuscript: YS and JMZ. Revising manuscript content: YS and JMZ. Approving final version of manuscript: all authors. YS takes responsibility for the integrity of the data analysis.
Footnotes
Disclosure: All authors state that they have no conflicts of interest.
References
- 1.Looker AC, Orwoll ES, Johnston CC, Jr., Lindsay RL, Wahner HW, Dunn WL, et al. Prevalence of low femoral bone density in older U.S. adults from NHANES III. J Bone Miner Res. 1997;12(11):1761–8. doi: 10.1359/jbmr.1997.12.11.1761. [DOI] [PubMed] [Google Scholar]
- 2.Baron JA, Barrett J, Malenka D, Fisher E, Kniffin W, Bubolz T, et al. Racial differences in fracture risk. Epidemiology. 1994;5(1):42–7. doi: 10.1097/00001648-199401000-00008. [DOI] [PubMed] [Google Scholar]
- 3.Jacobsen SJ, Goldberg J, Miles TP, Brody JA, Stiers W, Rimm AA. Hip fracture incidence among the old and very old: a population-based study of 745,435 cases. Am J Public Health. 1990;80(7):871–3. doi: 10.2105/ajph.80.7.871. [DOI] [PMC free article] [PubMed] [Google Scholar]
- 4.Griffin MR, Ray WA, Fought RL, Melton LJ., 3rd Black-white differences in fracture rates. American journal of epidemiology. 1992;136(11):1378–85. doi: 10.1093/oxfordjournals.aje.a116450. [DOI] [PubMed] [Google Scholar]
- 5.Cooper C, Campion G, Melton LJ., 3rd Hip fractures in the elderly: a world-wide projection. Osteoporos Int. 1992;2(6):285–9. doi: 10.1007/BF01623184. [DOI] [PubMed] [Google Scholar]
- 6.Seeman E. Growth in bone mass and size--are racial and gender differences in bone mineral density more apparent than real? The Journal of clinical endocrinology and metabolism. 1998;83(5):1414–9. doi: 10.1210/jcem.83.5.4844. [DOI] [PubMed] [Google Scholar]
- 7.Sheu Y, Cauley JA, Wheeler VW, Patrick AL, Bunker CH, Kammerer CM, et al. Natural history and correlates of hip BMD loss with aging in men of African ancestry: the Tobago Bone Health Study. J Bone Miner Res. 2009;24(7):1290–8. doi: 10.1359/JBMR.090221. [DOI] [PMC free article] [PubMed] [Google Scholar]
- 8.Glynn NW, Meilahn EN, Charron M, Anderson SJ, Kuller LH, Cauley JA. Determinants of bone mineral density in older men. J Bone Miner Res. 1995;10(11):1769–77. doi: 10.1002/jbmr.5650101121. [DOI] [PubMed] [Google Scholar]
- 9.Bakhireva LN, Barrett-Connor E, Kritz-Silverstein D, Morton DJ. Modifiable predictors of bone loss in older men: a prospective study. Am J Prev Med. 2004;26(5):436–42. doi: 10.1016/j.amepre.2004.02.013. [DOI] [PubMed] [Google Scholar]
- 10.Cauley JA, Lui LY, Stone KL, Hillier TA, Zmuda JM, Hochberg M, et al. Longitudinal study of changes in hip bone mineral density in Caucasian and African-American women. Journal of the American Geriatrics Society. 2005;53(2):183–9. doi: 10.1111/j.1532-5415.2005.53101.x. [DOI] [PubMed] [Google Scholar]
- 11.Sheu Y, Cauley JA, Bunker CH, Wheeler VW, Patrick AL, Gordon CL, et al. Correlates of trabecular and cortical volumetric BMD in men of African ancestry. J Bone Miner Res. 2009;24(12):1960–8. doi: 10.1359/JBMR.090522. PMCID: 2791513. [DOI] [PMC free article] [PubMed] [Google Scholar]
- 12.Riggs BL, Melton LJ, Robb RA, Camp JJ, Atkinson EJ, McDaniel L, et al. A population-based assessment of rates of bone loss at multiple skeletal sites: evidence for substantial trabecular bone loss in young adult women and men. J Bone Miner Res. 2008;23(2):205–14. doi: 10.1359/JBMR.071020. [DOI] [PMC free article] [PubMed] [Google Scholar]
- 13.Barbour KE, Zmuda JM, Strotmeyer ES, Horwitz MJ, Boudreau R, Evans RW, et al. Correlates of trabecular and cortical volumetric bone mineral density of the radius and tibia in older men: the Osteoporotic Fractures in Men Study. J Bone Miner Res. 2010;25(5):1017–28. doi: 10.1002/jbmr.6. PMCID: 3153367. [DOI] [PMC free article] [PubMed] [Google Scholar]
- 14.Bunker CH, Patrick AL, Konety BR, Dhir R, Brufsky AM, Vivas CA, et al. High prevalence of screening-detected prostate cancer among Afro-Caribbeans: the Tobago Prostate Cancer Survey. Cancer Epidemiol Biomarkers Prev. 2002;11(8):726–9. [PubMed] [Google Scholar]
- 15.Miljkovic-Gacic I, Ferrell RE, Patrick AL, Kammerer CM, Bunker CH. Estimates of African, European and Native American ancestry in Afro-Caribbean men on the island of Tobago. Hum Hered. 2005;60(3):129–33. doi: 10.1159/000089553. [DOI] [PubMed] [Google Scholar]
- 16.Lauretani F, Bandinelli S, Griswold ME, Maggio M, Semba R, Guralnik JM, et al. Longitudinal changes in BMD and bone geometry in a population-based study. J Bone Miner Res. 2008;23(3):400–8. doi: 10.1359/JBMR.071103. PMCID: 2645701. [DOI] [PMC free article] [PubMed] [Google Scholar]
- 17.Sheu Y, Cauley JA, Wheeler VW, Patrick AL, Bunker CH, Ensrud KE, et al. Age-related decline in bone density among ethnically diverse older men. Osteoporos Int. 2011 doi: 10.1007/s00198-010-1330-2. [DOI] [PMC free article] [PubMed] [Google Scholar]
- 18.Khosla S, Melton LJ, 3rd, Robb RA, Camp JJ, Atkinson EJ, Oberg AL, et al. Relationship of volumetric BMD and structural parameters at different skeletal sites to sex steroid levels in men. J Bone Miner Res. 2005;20(5):730–40. doi: 10.1359/JBMR.041228. [DOI] [PubMed] [Google Scholar]
- 19.Khosla S, Melton LJ, 3rd, Atkinson EJ, O'Fallon WM. Relationship of serum sex steroid levels to longitudinal changes in bone density in young versus elderly men. The Journal of clinical endocrinology and metabolism. 2001;86(8):3555–61. doi: 10.1210/jcem.86.8.7736. [DOI] [PubMed] [Google Scholar]
- 20.George A, Tracy JK, Meyer WA, Flores RH, Wilson PD, Hochberg MC. Racial differences in bone mineral density in older men. J Bone Miner Res. 2003;18(12):2238–44. doi: 10.1359/jbmr.2003.18.12.2238. [DOI] [PubMed] [Google Scholar]
- 21.Bendavid EJ, Shan J, Barrett-Connor E. Factors associated with bone mineral density in middle-aged men. J Bone Miner Res. 1996;11(8):1185–90. doi: 10.1002/jbmr.5650110818. [DOI] [PubMed] [Google Scholar]
- 22.Ensrud KE, Fullman RL, Barrett-Connor E, Cauley JA, Stefanick ML, Fink HA, et al. Voluntary weight reduction in older men increases hip bone loss: the osteoporotic fractures in men study. The Journal of clinical endocrinology and metabolism. 2005;90(4):1998–2004. doi: 10.1210/jc.2004-1805. [DOI] [PubMed] [Google Scholar]
- 23.Hannan MT, Felson DT, Dawson-Hughes B, Tucker KL, Cupples LA, Wilson PW, et al. Risk factors for longitudinal bone loss in elderly men and women: the Framingham Osteoporosis Study. J Bone Miner Res. 2000;15(4):710–20. doi: 10.1359/jbmr.2000.15.4.710. [DOI] [PubMed] [Google Scholar]
- 24.Kaptoge S, Welch A, McTaggart A, Mulligan A, Dalzell N, Day NE, et al. Effects of dietary nutrients and food groups on bone loss from the proximal femur in men and women in the 7th and 8th decades of age. Osteoporos Int. 2003;14(5):418–28. doi: 10.1007/s00198-003-1391-6. [DOI] [PubMed] [Google Scholar]
- 25.Knoke JD, Barrett-Connor E. Weight loss: a determinant of hip bone loss in older men and women. The Rancho Bernardo Study. American journal of epidemiology. 2003;158(12):1132–8. doi: 10.1093/aje/kwg265. [DOI] [PubMed] [Google Scholar]
- 26.Sheu Y, Zmuda JM, Cauley JA, Bunker CH, Patrick AL, Wheeler VW, et al. American Society of Bone Mineral Research. Philadelphia: Sep 15-19, 2006. Greater decline in hip bone mineral density with aging among Afro-Caribbean than Caucasian men. p. PA2006. [Google Scholar]
- 27.Rodan GA. Mechanical loading, estrogen deficiency, and the coupling of bone formation to bone resorption. J Bone Miner Res. 1991;6(6):527–30. doi: 10.1002/jbmr.5650060602. [DOI] [PubMed] [Google Scholar]
- 28.Cornish J, Callon KE, Bava U, Lin C, Naot D, Hill BL, et al. Leptin directly regulates bone cell function in vitro and reduces bone fragility in vivo. J Endocrinol. 2002;175(2):405–15. doi: 10.1677/joe.0.1750405. [DOI] [PubMed] [Google Scholar]
- 29.Burr DB. Remodeling and the repair of fatigue damage. Calcified tissue international. 1993;53(Suppl 1):S75–80. doi: 10.1007/BF01673407. discussion S-1. [DOI] [PubMed] [Google Scholar]
- 30.Duque G. Bone and fat connection in aging bone. Curr Opin Rheumatol. 2008;20(4):429–34. doi: 10.1097/BOR.0b013e3283025e9c. [DOI] [PubMed] [Google Scholar]
- 31.Strotmeyer ES, Cauley JA, Schwartz AV, Nevitt MC, Resnick HE, Zmuda JM, et al. Diabetes is associated independently of body composition with BMD and bone volume in older white and black men and women: The Health, Aging, and Body Composition Study. J Bone Miner Res. 2004;19(7):1084–91. doi: 10.1359/JBMR.040311. [DOI] [PubMed] [Google Scholar]
- 32.Register TC, Lenchik L, Hsu FC, Lohman KK, Freedman BI, Bowden DW, et al. Type 2 diabetes is not independently associated with spinal trabecular volumetric bone mineral density measured by QCT in the Diabetes Heart Study. Bone. 2006;39(3):628–33. doi: 10.1016/j.bone.2006.03.003. [DOI] [PubMed] [Google Scholar]
- 33.Petit MA, Paudel ML, Taylor BC, Hughes JM, Strotmeyer ES, Schwartz AV, et al. Bone Mass and Strength in Older Men with Type 2 Diabetes: The Osteoporotic Fractures in Men Study. J Bone Miner Res. 2009;25(2):285–91. doi: 10.1359/jbmr.090725. [DOI] [PMC free article] [PubMed] [Google Scholar]
- 34.Strotmeyer ES, Cauley JA. Diabetes mellitus, bone mineral density, and fracture risk. Current opinion in endocrinology, diabetes, and obesity. 2007;14(6):429–35. doi: 10.1097/MED.0b013e3282f1cba3. [DOI] [PubMed] [Google Scholar]
- 35.Stolk RP, Van Daele PL, Pols HA, Burger H, Hofman A, Birkenhager JC, et al. Hyperinsulinemia and bone mineral density in an elderly population: The Rotterdam Study. Bone. 1996;18(6):545–9. doi: 10.1016/8756-3282(96)00079-8. [DOI] [PubMed] [Google Scholar]
- 36.Barrett-Connor E, Kritz-Silverstein D. Does hyperinsulinemia preserve bone? Diabetes care. 1996;19(12):1388–92. doi: 10.2337/diacare.19.12.1388. [DOI] [PubMed] [Google Scholar]
- 37.Vestergaard P, Rejnmark L, Mosekilde L. Hypertension is a risk factor for fractures. Calcified tissue international. 2009;84(2):103–11. doi: 10.1007/s00223-008-9198-2. [DOI] [PubMed] [Google Scholar]
- 38.Cappuccio FP, Meilahn E, Zmuda JM, Cauley JA. High blood pressure and bone-mineral loss in elderly white women: a prospective study. Study of Osteoporotic Fractures Research Group. Lancet. 1999;354(9183):971–5. doi: 10.1016/s0140-6736(99)01437-3. [DOI] [PubMed] [Google Scholar]
- 39.Javed F, Khan SA, Ayers EW, Aziz EF, Akram MS, Nadkarni GN, et al. Association of hypertension and bone mineral density in an elderly African American female population. J Natl Med Assoc. 2012;104(3-4):172–8. doi: 10.1016/s0027-9684(15)30140-1. [DOI] [PubMed] [Google Scholar]
- 40.Cauley JA, Blackwell T, Zmuda JM, Fullman RL, Ensrud KE, Stone KL, et al. Correlates of trabecular and cortical volumetric bone mineral density at the femoral neck and lumbar spine: the osteoporotic fractures in men study (MrOS). J Bone Miner Res. 2010;25(9):1958–71. doi: 10.1002/jbmr.86. PMCID: 3727421. [DOI] [PMC free article] [PubMed] [Google Scholar]
- 41.Ott SM, LaCroix AZ, Scholes D, Ichikawa LE, Wu K. Effects of three years of low-dose thiazides on mineral metabolism in healthy elderly persons. Osteoporos Int. 2008;19(9):1315–22. doi: 10.1007/s00198-008-0612-4. [DOI] [PubMed] [Google Scholar]
- 42.Bolland MJ, Ames RW, Horne AM, Orr-Walker BJ, Gamble GD, Reid IR. The effect of treatment with a thiazide diuretic for 4 years on bone density in normal postmenopausal women. Osteoporos Int. 2007;18(4):479–86. doi: 10.1007/s00198-006-0259-y. [DOI] [PubMed] [Google Scholar]
- 43.Giles T, Aranda JM, Jr., Suh DC, Choi IS, Preblick R, Rocha R, et al. Ethnic/racial variations in blood pressure awareness, treatment, and control. J Clin Hypertens (Greenwich) 2007;9(5):345–54. doi: 10.1111/j.1524-6175.2007.06432.x. [DOI] [PMC free article] [PubMed] [Google Scholar]
- 44.Reddy S, Shapiro M, Morton R, Jr., Brawley OW. Prostate cancer in black and white Americans. Cancer Metastasis Rev. 2003;22(1):83–6. doi: 10.1023/a:1022216119066. [DOI] [PubMed] [Google Scholar]
- 45.Higano CS. Androgen-deprivation-therapy-induced fractures in men with nonmetastatic prostate cancer: what do we really know? Nat Clin Pract Urol. 2008;5(1):24–34. doi: 10.1038/ncpuro0995. [DOI] [PubMed] [Google Scholar]
- 46.Kiratli BJ, Srinivas S, Perkash I, Terris MK. Progressive decrease in bone density over 10 years of androgen deprivation therapy in patients with prostate cancer. Urology. 2001;57(1):127–32. doi: 10.1016/s0090-4295(00)00895-5. [DOI] [PubMed] [Google Scholar]
- 47.Preston DM, Torrens JI, Harding P, Howard RS, Duncan WE, McLeod DG. Androgen deprivation in men with prostate cancer is associated with an increased rate of bone loss. Prostate Cancer Prostatic Dis. 2002;5(4):304–10. doi: 10.1038/sj.pcan.4500599. [DOI] [PubMed] [Google Scholar]
- 48.Greenspan SL, Coates P, Sereika SM, Nelson JB, Trump DL, Resnick NM. Bone loss after initiation of androgen deprivation therapy in patients with prostate cancer. The Journal of clinical endocrinology and metabolism. 2005;90(12):6410–7. doi: 10.1210/jc.2005-0183. [DOI] [PubMed] [Google Scholar]
- 49.Shahinian VB, Kuo YF, Freeman JL, Goodwin JS. Risk of fracture after androgen deprivation for prostate cancer. N Engl J Med. 2005;352(2):154–64. doi: 10.1056/NEJMoa041943. [DOI] [PubMed] [Google Scholar]
- 50.Smith MR, Lee WC, Brandman J, Wang Q, Botteman M, Pashos CL. Gonadotropin-releasing hormone agonists and fracture risk: a claims-based cohort study of men with nonmetastatic prostate cancer. J Clin Oncol. 2005;23(31):7897–903. doi: 10.1200/JCO.2004.00.6908. [DOI] [PubMed] [Google Scholar]
- 51.Kamer AR, El-Ghorab N, Marzec N, Margarone JE, 3rd, Dziak R. Nicotine induced proliferation and cytokine release in osteoblastic cells. Int J Mol Med. 2006;17(1):121–7. [PubMed] [Google Scholar]
- 52.Liu XD, Zhu YK, Umino T, Spurzem JR, Romberger DJ, Wang H, et al. Cigarette smoke inhibits osteogenic differentiation and proliferation of human osteoprogenitor cells in monolayer and three-dimensional collagen gel culture. J Lab Clin Med. 2001;137(3):208–19. doi: 10.1067/mlc.2001.113066. [DOI] [PubMed] [Google Scholar]
- 53.Lorentzon M, Mellstrom D, Haug E, Ohlsson C. Smoking in young men is associated with lower bone mineral density and reduced cortical thickness. The Journal of clinical endocrinology and metabolism. 2006 doi: 10.1210/jc.2006-1294. [DOI] [PubMed] [Google Scholar]
- 54.Beck TJ, Looker AC, Ruff CB, Sievanen H, Wahner HW. Structural trends in the aging femoral neck and proximal shaft: analysis of the third national health and nutrition examination survey dual-energy x-ray absorptiometry data. J Bone Miner Res. 2000;15(12):2297–304. doi: 10.1359/jbmr.2000.15.12.2297. PMCID:11127194. [DOI] [PubMed] [Google Scholar]
- 55.Yang L, Burton AC, Bradburn M, Nielson CM, Orwoll ES, Eastell R. Distribution of bone density in the proximal femur and its association with hip fracture risk in older men: the osteoporotic fractures in men (MrOS) study. J Bone Miner Res. 2012;27(11):2314–24. doi: 10.1002/jbmr.1693. PMCID: 3474863. [DOI] [PMC free article] [PubMed] [Google Scholar]
- 56.Orwoll ES, Marshall LM, Nielson CM, Cummings SR, Lapidus J, Cauley JA, et al. Finite element analysis of the proximal femur and hip fracture risk in older men. J Bone Miner Res. 2009;24(3):475–83. doi: 10.1359/JBMR.081201. PMCID: 2659519. [DOI] [PMC free article] [PubMed] [Google Scholar]