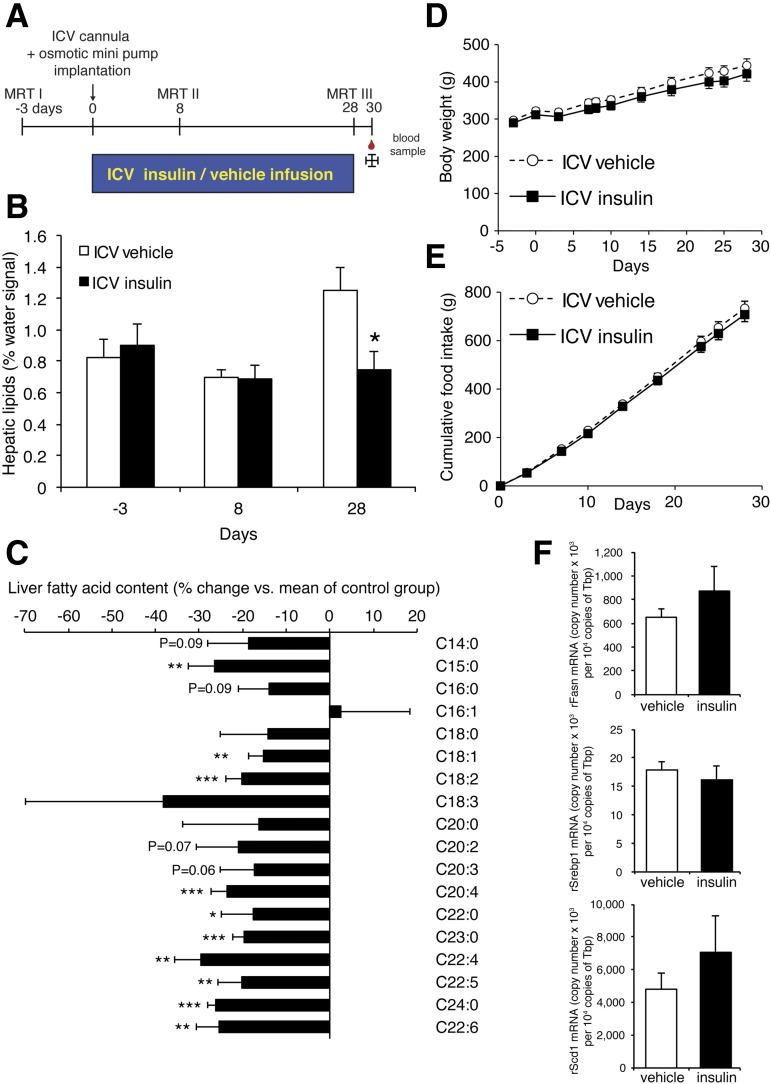
Figure 4.
Chronic brain insulin infusion reduces liver TG content independent of changes in body weight and food intake. A: Study protocol. MRT I–III indicate the time points where 1H-MRS measurements were performed. B: Liver fat content measured using 1H-MRS in anesthetized rats on days −3, 8, and 28. C: FA profiles from liver tissue harvested on day 30. Data are depicted as % change vs. vehicle-infused animals. D: Body weight. E: Food intake. F: Comparison of mRNA copy numbers of DNL genes in liver tissue samples from intracerebroventricular (ICV) insulin– or vehicle–treated rats. All error bars are SEM. *P < 0.05, **P < 0.01, ***P < 0.001 vs. respective control group. n = 8/group.

