

Abstract
Clovis, with its distinctive biface, blade and osseous technologies, is the oldest widespread archaeological complex defined in North America, dating from 11,100 to 10,700 14C years BP (13,000 to 12,600 calendar years BP)1,2. Nearly fifty years of archaeological research point to the Clovis complex as having developed south of the North American ice sheets from an ancestral technology3. However, both the origins and genetic legacy of the people who manufactured Clovis tools remain debated. It is argued that these people ultimately derived from Asia and were directly related to contemporary Native Americans2. An alternative, Solutrean, hypothesis posits that the Clovis predecessors immigrated from Southwestern Europe during the Last Glacial Maximum (LGM)4. Here, we report the genome sequence of a male infant (Anzick-1) recovered from the Anzick burial site in western Montana. The human bones date to 10,705±35 14C years BP (CAMS-80538; c. 12,707–12,556 calendar years BP) and were directly associated with Clovis tools. We sequenced the genome to an average depth of 14.4× and show that the gene flow from the Siberian Upper Palaeolithic Mal′ta individual5 into Native American ancestors is also shared by the Anzick-1 individual and thus happened prior to 12,600 years BP. We also show that the Anzick-1 individual is more closely related to all indigenous American populations than to any other group. Our data are compatible with the hypothesis that Anzick-1 belonged to a population directly ancestral to many contemporary Native Americans. Finally, we find evidence of a deep divergence in Native American populations that pre-dates the Anzick-1 individual.
The only known Clovis burial and associated mortuary assemblage was found in the Americas at the Anzick site, Montana, in 19686–8 (Figure 1a,b). Here, c. 100 stone tools and 15 osseous tool fragments (Figure 1d,e) (at least one made of elk; SI3.4) that are technologically consistent with artefacts of the Clovis complex9,10 were found in direct association with the partial fragmentary remains of an infant child (Anzick-1). The human remains were found directly below the Clovis artefacts and were covered with red ochre. Bone from the skeleton was directly dated using XAD-collagen to 10,705±35 14C years BP (CAMS-80538) or 12,707−12,556 calendar years BP, close to the end of the Clovis time period1,7 (Figure 1c).
Figure 1.
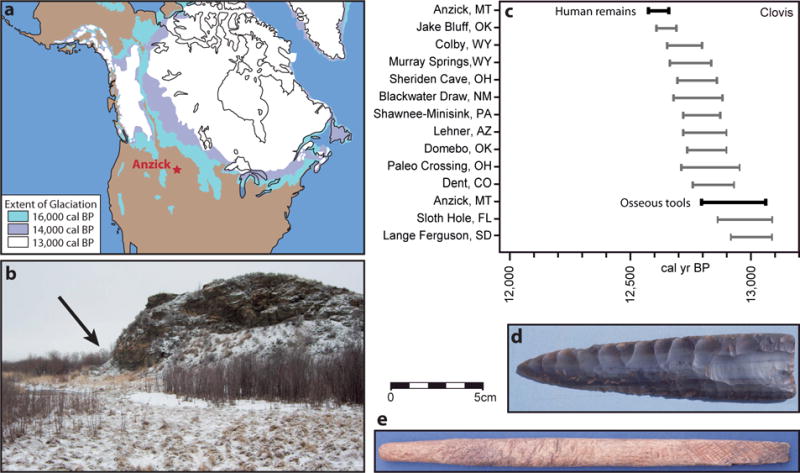
Geographic and C14 dating overview, and examples of artefacts from the site. a, Location of the Anzick site relative to continental glacial positions from 16,000 to 13,000 calendar years before present. b, Photograph of the Anzick site. Site is located at the base of the slope at the far left. c, Age of the human remains and osseous tools relative to other Clovis sites. d, Clovis fluted projectile point from the site. e, Clovis osseous rod from the site.
Initial genetic screening of the Anzick-1 skeletal remains using PCR coupled with cloning and Sanger sequencing yielded a mtDNA haplogroup assignment of D4h3a (SI3). The D4h3a haplogroup was verified and further characterized in the subsequent shotgun sequencing of Anzick-1 (SI12, Extended Data Figure 2). D4h3a is one of the rare mtDNA lineages specific to Native Americans, it is distributed along the Pacific coast in North and South America among contemporary populations11 and is also present in ancient specimens12. Its current distribution has been interpreted as evidence for an early coastal migration route11. Our findings of this mtDNA haplogroup inland in the oldest skeleton from the Americas mtDNA typed to date question such interpretation and underscores that current distributions of genetic markers are not necessarily indicative of the movement or distribution of peoples in the past3. The Anzick-1 D4h3a does not carry any of the polymorphisms that define the several sub-groups of the haplogroup13 and is thus placed at the root of D4h3a. Our finding implies that the origin of the D4h3a branch is likely to be at the upper bound of the previously obtained estimate of 13,000±2600 calendar years BP14, or possibly even older.
Shotgun sequencing of the Anzick-1 DNA revealed a highly variable endogenous human DNA content across different extracts, even those recovered from the same bone fragment (0.5%–28.2%, SI4, Extended Data Table 3). This suggests significant influence of microenvironments in long-term DNA preservation across the Anzick-1 bone fragments15. We obtained an average sequencing depth of 14.4× coverage. Based on the observed DNA fragment length distribution, we computed molecular half-life estimates16 for a 100-bp fragment to be 4,852 and 5,137 years for nuDNA and mtDNA, respectively. These are consistent with predictions based on estimated burial temperature and geographical location (SI7). Nucleotide misincorporation patterns were consistent with increased post-mortem cytosine deamination at DNA fragment termini17 (SI8). The mtDNA data provided a contamination estimate with a 95% credibility interval of 0.15%–0.38%18 (SI9). As the Anzick-1 individual was found to be male, we were also able to quantify contamination levels based on the heterozygosity levels seen on the X chromosome19, which resulted in similarly low contamination estimates (<1.2%, SI11). Characterisation of the error rate yielded an overall estimate of 0.84% (SI10). Per-library error rates as well as nucleotide type-specific error rates are shown in Extended Data Figure 1c; as expected, the error estimates are driven by deamination related DNA-damage errors.
We determined the Y-chromosome haplogroup to be Q-L54*(xM3) and, along with 15 previously analysed Y-chromosome sequences20, we constructed a tree to illustrate the phylogenetic context within haplogroup Q (SI13, Extended Data Figure 2). Confining our analyses to transversion SNPs, we leveraged the date of Anzick-1 to estimate a divergence time between haplogroups Q-L54*(xM3) and Q-M3, two of the major founding Y-chromosome lineages of the Americas, of c. 16,900 years ago (95%: 13,000−19,700, SI13).
We assessed the genome-wide genetic affinity of the Anzick-1 individual to 143 contemporary non-African human populations by computing outgroup f3–statistics21, which are informative on the amount of shared genetic drift between an individual and other populations. The data set included 52 Native American populations, for which genomic segments derived from recent European and African admixture have been excluded22. We found that the Anzick-1 individual showed a significantly closer affinity to all 52 Native American groups than to any extant Eurasian population (Figure 2). The same conclusion was reached from admixture clustering analyses (SI14, Extended Data Figures 3), and when using D-statistics based on genomic sequence data (SI16).
Figure 2.
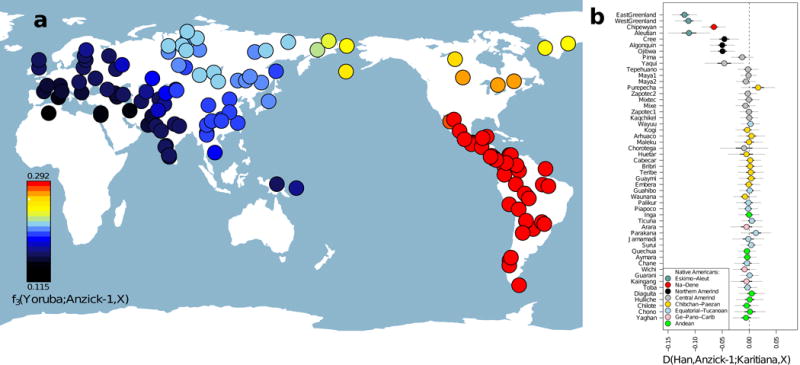
Genetic affinity of Anzick-1. a, Anzick-1 is most closely related to Native Americans. Heat map representing estimated outgroup f3-statistics for shared genetic history between the Anzick-1 individual and each of 143 contemporary human populations outside sub-Saharan Africa. b, Anzick-1 is less closely related to Northern Native American populations and a Yaqui individual than to Central and South Native Americans such as the Brazilian Karitiana. We computed a D-test of the form D(Han, Anzick-1; Karitiana, X) to test the hypothesis that a second Native American population X is as closely related to Anzick-1 as the South American Karitiana is. Thick and thin whiskers represent 1 and 3 SEs, respectively.
Interestingly, the Anzick-1 individual showed less shared genetic history with seven Northern Native Americans from Canada and the Artic, including three Northern Amerind-speaking groups (“NA” group), and the Central American Yaqui (SI15, Figure 2), than with 44 Native populations from Central and South America (“SA” group) (Figure 2). This finding was further supported by allele frequency based D-statistics, which strongly rejects the hypothesis of a population tree with topology [Anzick-1, [NA, SA]]. However, a tree assuming a branching pattern of [NA, [Anzick-1, SA]] could not be rejected (SI15, Figure 3).
Figure 3.

Simplified schematic of genetic models. Alternative models of the population history behind the closer shared ancestry of the Anzick-1 individual to Central and Southern American (SA) populations than Northern American (NA) populations, see main text for further definition of populations. We find that the data is consistent with a simple tree-like model where NA populations are historically basal to Anzick-1 and SA. We base this conclusion on two D-tests conducted on the Anzick-1 individual, NA and SA. We used Han Chinese as outgroup. We first tested the hypothesis that Anzick-1 is basal to both NA and SA populations using D(Han, Anzick-1; SA, NA). a, As in the results for each pairwise comparison between SA and NA populations (Extended Data Figure 4), this hypothesis is rejected. b, Next, we tested D(Han, NA; Anzick-1, SA), if NA populations where a mixture of post-Anzick-1 and pre-Anzick-1 ancestry, we would expected to reject this topology. c, We found that a topology with NA populations are basal to Anzick-1 and SA populations is consistent with the data. d, However, another alternative is that the Anzick-1 individual is from the time of the last common ancestral population of the Northern and Southern lineage, after which the Northern lineage received gene flow from a more basal lineage.
We investigated two possible scenarios that could explain this pattern: (i) a basal diversification of the NA and SA lineages that pre-dates the Clovis period, with the Anzick-1 individual belonging to the SA lineage (Figure 3c). (ii) the Anzick-1 individual is basal to both lineages, but the lineages diverged at a time close to c. 12,600 years ago, and the NA group received subsequent gene-flow from other, perhaps Siberian, populations (Figure 3b). This latter hypothesis of additional pulses of gene flow has been suggested for the four Na-Dene and Eskimo-Aleut-speaking groups by a previous study, whereas the three Northern Amerind groups and Yaqui have been found to carry exclusively ‘First American’ ancestry22.
We analysed 19 different published Siberian populations and found that allele frequency based D-statistics in all cases, with the exclusion of Naukan, were compatible with a diversification pattern of [Siberian, [NA, SA]], with no evidence for gene-flow into the NA group (SI15), a pattern that agrees with previously published results22. This suggests that model (i) is more likely, and that the structure between Native American lineages pre-dates the Anzick-1 individual and thus appears to go back to pre-Clovis times.
We used outgroup f3-statistics to evaluate the shared genetic history between all Native American populations and the Anzick-1 genome, the 24,000-year-old human from Mal’ta, Siberia5 and the 4,000-year-old Saqqaq Palaeo-Eskimo from Greenland19. We again found a closer relationship between Anzick-1 and all Native Americans (SI15, Extended Data Figure 5). Together with the fact that Anzick-1 shows the same relative affinity to Western- and Eastern Eurasians, this suggests that the gene-flow from the Mal’ta lineage into Native Americans happened before the NA and SA groups diverged.
Next, we addressed the relationship of the Anzick-1 genome to whole-genome sequences from contemporary humans, including two novel genomes from Karitiana and Mayan individuals, and from the ancient Saqqaq sample19. To explore the question of direct ancestry, we developed a novel method to assess the amount of genetic drift experienced by each of a pair of populations after their divergence, without making any assumptions about demography (SI17). If the Anzick-1 individual belonged to a population directly ancestral to a sampled contemporary population, the amount of genetic drift on the Anzick-1 branch should be zero, as it would have experienced no genetic drift since the “divergence” with the sampled population. We find that the data are compatible with the Anzick-1 individual belonging to a population that is directly ancestral to the two South American Karitiana samples, as is the case for the Mayan, after masking the latter for recent European admixture (Figure 4a,b). In contrast, there is a positive amount of drift on both lineages when comparing Anzick-1 to Saqqaq, Europeans, Asians and Pacific Islanders. This shows that the Anzick-1 sample has diverged from populations from outside the Americas. Furthermore, in agreement with the SNP analyses, TreeMix23 (Figures 4c and S18) and outgroup f3-analyses5,21 (Extended Data Figure 5 and 6), the Anzick-1 sample is genetically more closely related to Central and South Americans than to any other populations, including the Saqqaq individual from Greenland. After masking the Mayan genome for recent European admixture, TreeMix places the Anzick-1 individual in a position in the tree compatible with the hypothesis that it is ancestral to both Mayan and Karitiana, with Anzick-1 exhibiting virtually no drift on its branch since its divergence from other populations (Figure 4c).
Figure 4.
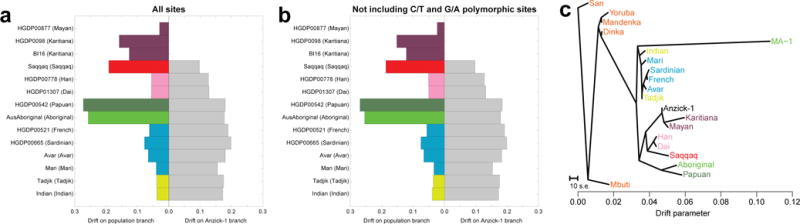
Estimated drift and maximum likelihood tree. Site patterns and drift estimates for non-African populations vs. the Anzick-1 sample. a, Data based on conditioning on African polymorphism, non-African populations in colour on the left, Anzick-1 in grey on the right. b, Data based on conditioning on African polymorphism and removing sites where a C and T or G and A were observed. c, Maximum likelihood tree generated by TreeMix using the whole genome sequencing data with the Mayan genome masked for European ancestry.
We conclude that the male infant, buried c.12,600 years ago with ochre-covered Clovis artefacts at the Anzick site, belonged to a meta-population from which many contemporary Native Americans are descended and is closely related to all indigenous American populations. As such, contemporary Native Americans are effectively direct descendants of the people who made and used Clovis tools and buried this child. In agreement with previous archaeological and genetic studies24,25, our genome analysis refutes the possibility that Clovis originated via a European (Solutrean) migration to the Americas4. Furthermore, the Anzick-1 findings do not support the hypothesis, based on cranial data, that American populations around the time of Clovis were subsequently assimilated by more recent migrants who were the ancestors of contemporary Native Americans26,27. The Anzick-1 data thus serves to unify the genetic and archaeological records of early North America, it is consistent with a human occupation of the Americas a few thousand years before Clovis,2,3,28 and demonstrates that contemporary Native Americans are descendants of the first people to successfully settle the Americas. Our results are also consistent with previous models derived from mtDNA, which imply that Native American populations primarily derive from a single source population, but that there was a secondary movement into northern North America29. However, several different scenarios are compatible with an early divergence of the NA and SA groups and analyses of more ancient human remains are needed to further test the findings and interpretations from this single individual and to elucidate the complex colonization history of the Arctic and North American populations.
Methods Summary
We samples bone fragments from Anzick-1 skeleton, from the Anzick site in Montana, for ancient DNA and 14C dating analyses (SI1-2). From DNA extracts we generated Illumina sequencing libraries, which were sequenced on the Illumina HiSeq platform (SI3-4). We verified the authenticity of the ancient DNA through damage patterns and decay rates (SI7-8), and monitored contamination using analyses of both mtDNA and nuclear DNA (SI9-10). To investigate the affinity of the Anzick-1 individual to worldwide modern-day populations we computed outgroup f3-statistics5,21 using a genome-wide SNP data set of 143 groups collected from multiple studies (SI15). To test historical models relating the Anzick individual to modern-day Native Americans from Northern group (Cree, Ojibwa, and Algonquin) and a Southern group (44 Central- and South American groups) we compute D-statistics21 using the full allele frequency information (SI15). To test if the Anzick-1 individual could have belonged to a population ancestral to some of the modern populations, we developed a new Maximum Likelihood (ML) method for estimating the length of the branches of a drift tree with two populations (leaves in the tree) represented by two genomes. The method fits a model with the following parameters: the probability of pairwise coalescence within population 1 (c1), the probability of pairwise coalescence within population 2 (c2), and the probabilities of genotype patterns in the ancestral population, to the observed counts of joint genotype patterns of the two genomes. These parameters are uniquely determined by the observed genotype configurations. Letting the Anzick-1 individual be represented by population 1, the null hypothesis that it belongs to an ancestral population of a specific modern population (population 2) then formally corresponds to a test of the hypothesis c1 = 0 (SI17).
Extended Data
Extended Data Figure 1.

DNA fragmentation, damage and type specific error. a, Left, fragment length distribution of the Anzick-1 DNA sequences mapping to a human reference genome. The maximum read length with the applied chemistry on the HiSeq Illumina platform is 94 bp (100 - 6 bp index read), hence the large peak at this length simply represent the entire tail of the distribution. Right, the declining part of the distribution for the nuclear DNA, and the fit to an exponential model. The decay constant (λ) is estimated to 0.018. b, Damage patterns for the Anzick-1 individual in a random 0.5% subset of all mapped reads. Mismatch frequency relative to the reference as function of read position, C to T in red and G to A in blue. c) Type specific error rates for the Anzick-1 sample and the individual libraries. Estimates of overall error rates are given in the right-hand side.
Extended Data Figure 2.
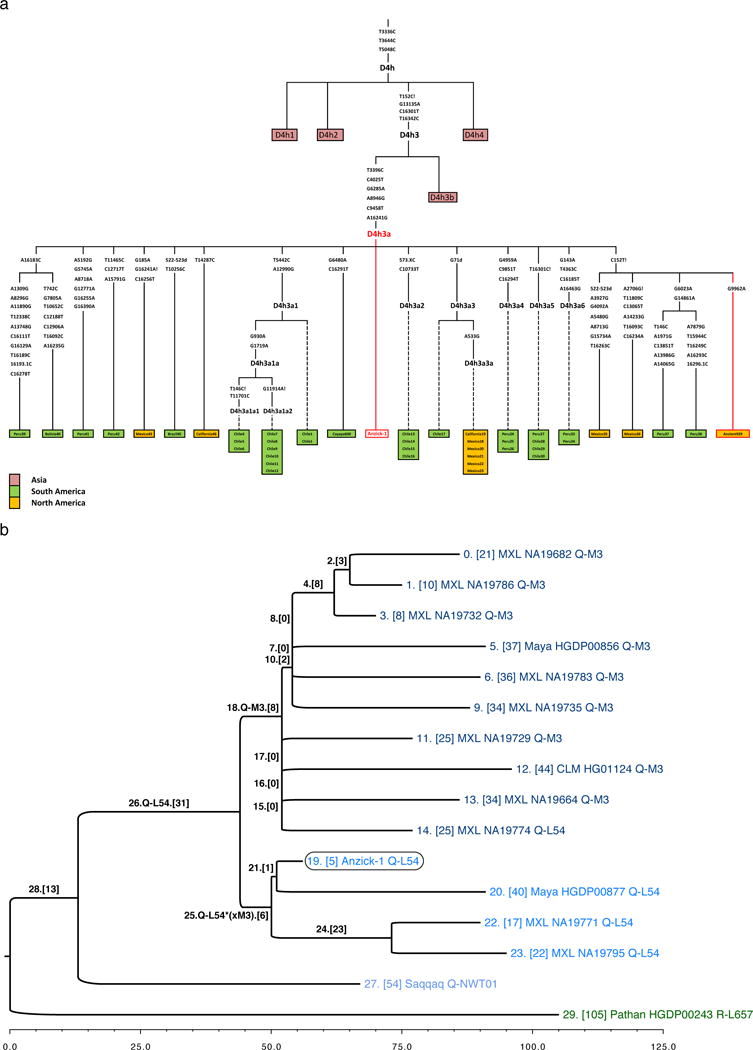
mtDNA and Y-chromosome subtrees. a, Schematic phylogenetic tree of mtDNA haplogroup D4h3 and its sub-branch D4h3a. Mutations from the root of haplogroup D4h are specified only for haplogroup D4h3a lineage, in case of broken lines only the mutations defining an existing sub-branch has been shown. The haplotypes of Anzick-1, identical with the root haplotype of D4h3a, and ancient full sequence from North-western coast of North America (Ancient939) is indicated in red. Insertions are indicated with “.” followed by a number of inserted nucleotides (X if not specified), deletions are indicated with „d“ and back mutations to ancestral state with „!“. The geographical spread of sub-branches of hg D4h is shown with different colours specified in figure legend. b, Placement of Anzick-1 within the Y-chromosome phylogeny. Anzick-1 (circled) represents Y-chromosome haplogroup Q-L54*(xM3) (blue), which is offset by haplogroup Q-M3 (dark blue). The lineage carried by the ancient Saqqaq Palaeo-Eskimo (light blue) constitutes an outgroup to Q-L54. Each branch is labelled by an index and the number of transversion SNPs assigned to the branch (in brackets). Terminal taxa (individuals) are also labelled by population, ID, and haplogroup. Branches 21 and 25 represent the most recent shared ancestry between Anzick-1 and other members of the sample. Branch 19 is significantly shorter than neighbouring branches, which have had an additional ~12,600 years to accumulate mutations.
Extended Data Figure 3.
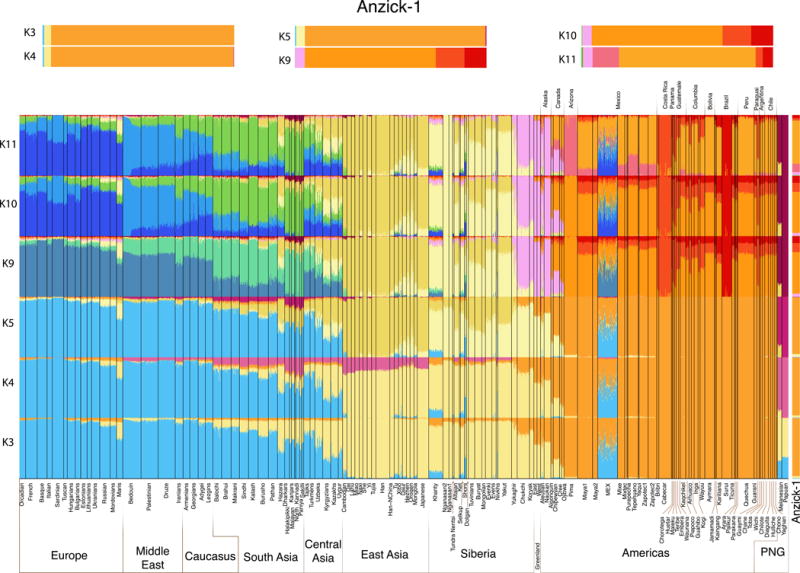
Ancestry proportions of Anzick-1 as determined by ADMIXTURE assuming 3 to 5 and 9 to 11 hypothetical “ancestral” populations or genetic components for a set of 135 extant Eurasian, Oceanian and New World populations. Shown are results from one of the converged runs at each K. We note that the model at K=11 was found to have the best predictive accuracy as determined by the lowest cross validation index values (see SI text). At each K each sample is represented by a stacked vertical bar whereas these of the Anzick-1 are magnified and presented horizontally at the top. Note that irrespective of the number of genetic components assumed the Anzick-1 sample shares all the components present in different contemporary Native American populations.
Extended Data Figure 4.
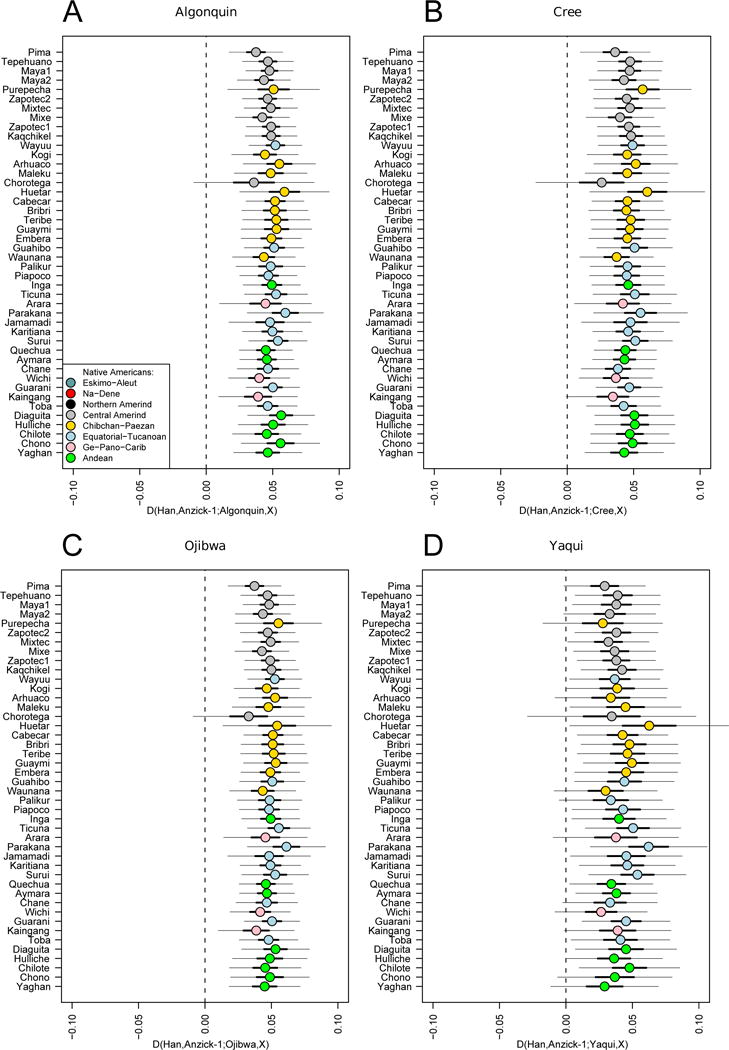
The closer relationship between Anzick-1 and Southern Native Americans compared to Algonquin, Cree, Ojibwa and a Yaqui individual (a–d) is consistent for different 44 Southern and Central Native American populations to Anzick-1. We used the test D(Han, Anzick-1; Algonquin/Cree/Ojibwa/Yaqui, Central/Southern Native Americans). Thick and thin whiskers represent 1 and 3 SEs, respectively.
Extended Data Figure 5.
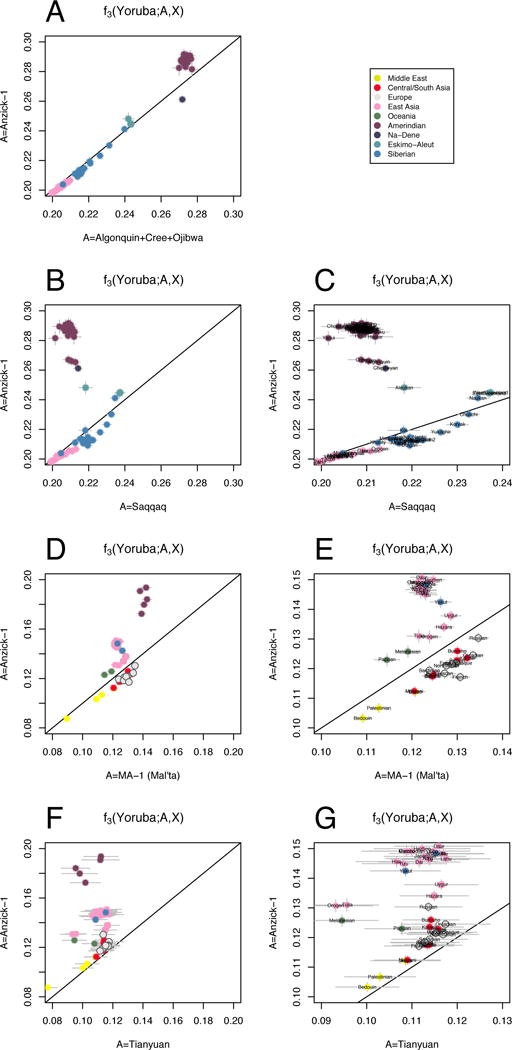
Outgroup f3-statistics contrasted for different combinations of populations. (A) Shared genetic history with Anzick-1 compared to shared genetic history with the three Northern Amerind-speaking populations. (B and C) shared genetic history with the Anzick-1 individual compared to the ~4,000-year-old Saqqaq from Greenland. (D and E) Anzick-1 compared to shared genetic history with the 24,000-year-old MA-1 individual from Central Siberia. (F and G) shared genetic history with Anzick-1 compared to shared genetic history with the 40,000 year old Tianyuan individual from China.
Extended Data Figure 6.
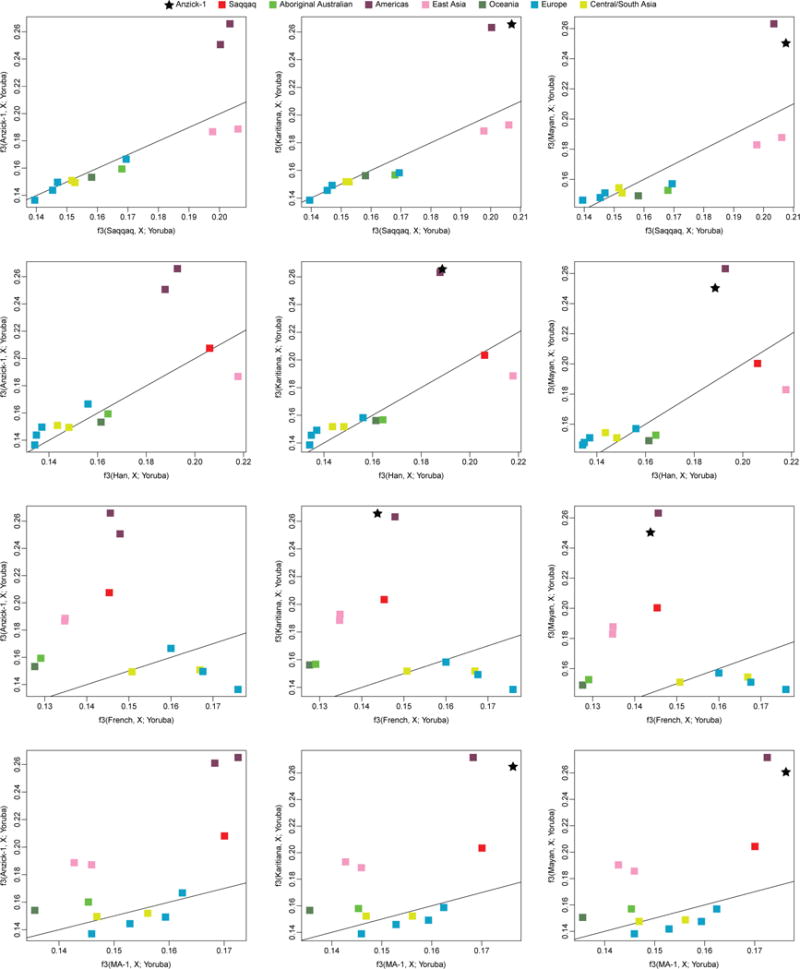
Pairwise outgroup f3 statistics computed using Saqqaq, Han, French or ancient MA-1 (Mal’ta) on the x-axis and Anzick-1, Karitiana, or Mayan on the y-axis. The black line indicates the y=x line.
Extended Data – Table 1.
AMS 14C and stable isotope analyses of human bone and antler artefacts from the Anzick site, Montana. The previously published 14C measurements are provided for reference. Some of the analyses were carried out to collect stable isotope and geochemistry data, and thus show no age information. Calibrated Ages using IntCal 09 are given only for 14C dates completed since 2006 and for chemical fractions considered the highest purity and having the greatest accuracy; calibration of chemically impure chemical fractions is not warranted. CAMS, Center for Accelerator Mass Spectrometry, Lawrence Livermore National Laboratories, Livermore, California. AA, NSF-Arizona Accelerator Mass Spectrometry Facility, Tucson. SR, Stafford Research, Boulder, Colorado. Beta, Beta Analytic, Florida. – not tested.
| AMS LAB NO. | Chemical Fraction Dated | 14C Age, RC yr.± SD | 14C Date, CAL BP (95.4% C.I.) | δ15N ‰ (AIR) | δ13C‰ (VPDB) | Collagen Yield (wt%) | %N | %C | C/N (atomic ratio) | Year Measured | Ref | |
|---|---|---|---|---|---|---|---|---|---|---|---|---|
|
| ||||||||||||
| Red, Hematite-Stained Petrous Bone (ANZICK-1) | ||||||||||||
| AA-313A | Decalcified Collagen | 8690±310 | 1984 | Stafford, 1987 | ||||||||
| AA-313B | Untreated Gelatin | 10,500±400 | 1984 | Stafford, 1987 | ||||||||
| AA-2978 | Aspartic acid | 10,240±120 | 1990 | Stafford, 1991 | ||||||||
| AA-2982 | Alanine | 10,370±130 | 1990 | Stafford, 1991 | ||||||||
| AA-2980 | Hydroxyproline | 10,710±100 | 1990 | Stafford, 1991 | ||||||||
| AA-2979 | Glutamic acid | 10,820±100 | 1990 | Stafford, 1991 | ||||||||
| AA-2981 | Glycine | 10,940±90 | 1990 | Stafford, 1991 | ||||||||
| CAMS-80535 | Decalcified Collagen | 10,580±35 | +9.1 | −17.6 | – | – | – | – | 2001 | This study | ||
| CAMS-80536 | KOH-Collagen | 10,525±35 | +8.6 | −18.1 | – | – | – | – | 2001 | This study | ||
| CAMS-80537 | Gelatin | 10,610±30 | +10.1 | −18.0 | – | – | – | – | 2001 | This study | ||
| CAMS-80538 | XAD-Gelatin | 10,705±35 | 12,722−12,590 | – | – | – | – | – | – | 2001 | This study | |
| Beta-163833 | Alkali Collagen | 10,780±40 | 12,746−12,660 | – | −21.2 | – | – | – | – | 2006 | Morrow & Gnecco, 2006 | |
| SR-8149 | KOH-Collagen | – | +10.5 | −18.0 | 22.7 | 15.7% | 43.9% | 3.26 | 2013 | This study | ||
| SR-8149 | Gelatin | – | +11.1 | −17.9 | 22.7 | 14.4% | 40.0% | 3.24 | 2013 | This study | ||
| SR-8151 | KOH-Collagen | – | +11.0 | −17.9 | 18.7 | 14.9% | 41.9% | 3.29 | 2013 | This study | ||
| SR-8151 | Gelatin | – | +11.6 | −17.8 | 18.7 | 14.7% | 41.2% | 3.26 | 2013 | This study | ||
|
| ||||||||||||
| Antler Rods | ||||||||||||
|
| ||||||||||||
| Specimen #118/119 | ||||||||||||
| UCIAMS-61661 | XAD-Collagen | 11,025±30 | 13,010−12,777 | – | – | – | – | – | – | 2006 | This study | |
| Beta-163832 | Alkali Collagen | 11,040±60 | 13,053−12,753 | – | −22.5 | – | – | – | – | 2006 | Morrow & Gnecco, 2006 | |
| Specimen #122 | ||||||||||||
| Beta-168967 | Alkali Collagen | 11,040±40 | 13,040−12,780 | – | −18.2 | – | – | – | – | 2006 | Morrow & Gnecco, 2006 | |
|
| ||||||||||||
| Average, 3-rods | 11,035±45 | 13,039−12,763 | ||||||||||
Extended data – Table 2.
Statistics of the genome sequence data used in the study and high confidence genotype calls. AvgDepth: average depth. Cov >1: fraction of the genome covered with at least 1 read. HomRef: Homozygote reference call, Het: Heterozygote call, HomAlt: Homozygote alternative call.
| Sample | Region | Population | Reference | Gender | Avg. Depth | Cov >1X | HomRef | Het | HomAlt | Accessible |
|---|---|---|---|---|---|---|---|---|---|---|
| DNK02 | Africa | Dinka | Meyer et al, 2012 | Male | 24.3 | 0.90 | 1,356,439,142 | 1,194,183 | 653,791 | 1,358,287,116 |
| HGDP00456 | Africa | Mbuti | Meyer et al, 2012 | Male | 20.3 | 0.90 | 1,333,191,748 | 1,198,421 | 741,996 | 1,335,132,165 |
| HGDP00521 | Europe | French | Meyer et al, 2012 | Male | 22.6 | 0.90 | 1,352,074,026 | 928,373 | 611,106 | 1,353,613,505 |
| HGDP00542 | SE Asia | Papuan | Meyer et al, 2012 | Male | 21.6 | 0.90 | 1,343,127,185 | 745,786 | 753,954 | 1,344,626,925 |
| HGDP00665 | Europe | Sardinian | Meyer et al, 2012 | Male | 19.9 | 0.90 | 1,334,884,400 | 908,557 | 606,234 | 1,336,399,191 |
| HGDP00778 | Han | Han | Meyer et al, 2012 | Male | 22.3 | 0.90 | 1,349,104,846 | 879,299 | 668,621 | 1,350,652,766 |
| HGDP00927 | Africa | Yoruba | Meyer et al, 2012 | Male | 26.7 | 0.90 | 1,361,142,931 | 1,221,258 | 664,333 | 1,363,028,522 |
| HGDP00998 | S. America | Karitiana | Meyer et al, 2012 | Male | 21.3 | 0.90 | 1,343,817,819 | 667,456 | 753,001 | 1,345,238,276 |
| HGDP01029 | Africa | San | Meyer et al, 2012 | Male | 26.9 | 0.90 | 1,362,464,890 | 1,273,369 | 774,869 | 1,364,513,128 |
| HGDP01284 | Africa | Mandenka | Meyer et al, 2012 | Male | 20.6 | 0.90 | 1,338,712,364 | 1,210,852 | 646,656 | 1,340,569,872 |
| HGDP01307 | SE Asia | Dai | Meyer et al, 2012 | Male | 23.8 | 0.90 | 1,350,414,031 | 879,716 | 660,662 | 1,351,954,409 |
| HGDP00877 | S. America | Mayan | This study | Male | 13.2 | 0.90 | 1,130,447,805 | 673,358 | 547,730 | 1,131,668,893 |
| BI16 | S. America | Karitiana | This study | Female | 23.4 | 0.89 | 1,278,750,988 | 664,223 | 684,479 | 1,280,099,690 |
| Avar | SC Asia | Avar | Raghavan et al, 2013 | Male | 12.8 | 0.83 | 622,360,039 | 468,944 | 299,356 | 623,128,339 |
| Indian | SC Asia | Indian | Raghavan et al, 2013 | Female | 15.9 | 0.89 | 861,422,992 | 643,238 | 389,937 | 862,456,167 |
| Mari | SC Asia | Mari | Raghavan et al, 2013 | Male | 12.0 | 0.87 | 235,202,480 | 199,301 | 120,287 | 235,522,068 |
| Tadjik | SC Asia | Tajik | Raghavan et al, 2013 | Male | 16.4 | 0.88 | 939,846,482 | 687,749 | 431,934 | 940,966,165 |
| AusAboriginal | SE Asia | Australian Aboriginal | Rasmussen et al, 2011 | Male | 6.3 | 0.50 | 356,126,648 | 240,732 | 220,901 | 356,588,281 |
| Saqqaq | Greenlander | Saqqaq | Rasmussen et al, 2010 | Male | 12.8 | 0.79 | 515,972,797 | 307,585 | 306,065 | 516,586,447 |
| Anzick-1 | N. America | Clovis | This study | Male | 14.4 | 0.87 | 780,953,901 | 864,870 | 409,731 | 782,228,502 |
Extended Data – Table 3.
Sequencing and mapping statistics for the Anzick-1 libraries.
| Library | Raw Reads | Per cent human reads | Mapped human reads ≥Q30 | Final BAM | Per cent clonality |
|---|---|---|---|---|---|
| C10 | 55,495,972 | 0.5% | 289,526 | 96,136 | 67% |
| C121121_36 | 2,000,862,136 | 24.6% | 491,779,235 | 116,018,652 | 76% |
| C121121_37 | 1,938,412,150 | 24.8% | 481,682,594 | 100,596,004 | 79% |
| C28 | 412,441,694 | 27.8% | 114,736,785 | 89,356,892 | 22% |
| C30_8 | 943,369,850 | 22.7% | 214,367,643 | 21,016,810 | 90% |
| C30_8_26 | 1,234,827,852 | 23.5% | 289,965,256 | 18,404,080 | 94% |
| C30_8_48 | 1,116,970,391 | 23.4% | 261,200,675 | 15,489,743 | 94% |
| C7 | 531,754,382 | 12.0% | 63,602,547 | 8,025,652 | 87% |
| C8 | 298,045,766 | 10.5% | 31,415,268 | 7,273,279 | 77% |
| C9 | 247,005,820 | 0.9% | 2,234,390 | 171,718 | 92% |
| CL16 | 614,007,221 | 22.1% | 135,844,895 | 28,405,912 | 79% |
| CL18 | 803,188,531 | 21.6% | 173,273,845 | 35,132,866 | 80% |
| CL20 | 695,954,288 | 21.7% | 150,806,716 | 29,319,798 | 81% |
| CL32 | 477,347,711 | 28.2% | 134,386,357 | 108,903,306 | 19% |
| CL33 | 791,303,957 | 21.4% | 169,518,285 | 25,024,524 | 85% |
| Cpro_42 | 201,998,907 | 8.3% | 16,846,370 | 3,381,783 | 80% |
| Cpro_43 | 305,882,477 | 8.3% | 25,418,416 | 2,896,283 | 89% |
| Crib_34 | 323,616,468 | 0.9% | 2,983,594 | 594,741 | 80% |
| Crib_39 | 281,843,911 | 0.9% | 2,447,883 | 302,525 | 88% |
|
| |||||
| Total | 13,274,329,484 | 20.8% | 2,762,800,280 | 610,410,704 | 78% |
Extended Data – Table 4.
Site patterns and drift estimates for non-African populations vs. the Anzick-1 sample. Top, data based on conditioning on African polymorphism. Bottom, data based on conditioning on African polymorphism and removing sites where a C and T or G and A were observed.
| Including all sites | |||||||||
|---|---|---|---|---|---|---|---|---|---|
| ID | Population | n(AAAa) | n(AaAA) | n(AAaa) | n(AaAa) | n(AAAA) | Drift in population | Drift in Anzick-1 | |
| HGDP00877 (masked) | Mayan | 123095 | 112507 | 38900 | 76913 | 1064893 | 0.0294 | 0.0000 | |
| HGDP00998 | Karitiana | 222029 | 162274 | 77002 | 111472 | 1791319 | 0.1581 | 0.0000 | |
| BI16 | Karitiana | 196546 | 150372 | 66032 | 105219 | 1630510 | 0.1258 | 0.0000 | |
| Saqqaq | Saqqaq | 152815 | 129619 | 71706 | 71545 | 1179386 | 0.1911 | 0.0979 | |
| HGDP00778 | Han | 210095 | 237386 | 97103 | 124521 | 1703214 | 0.0553 | 0.1266 | |
| HGDP01307 | Dai | 211459 | 239636 | 98327 | 125610 | 1713361 | 0.0554 | 0.1283 | |
| HGDP00542 | Papuan | 237801 | 200257 | 140039 | 95850 | 1688750 | 0.2725 | 0.1802 | |
| Aboriginal | Aboriginal | 116797 | 100838 | 67763 | 48350 | 847186 | 0.2569 | 0.1774 | |
| HGDP00521 | French | 212922 | 265527 | 112889 | 122188 | 1661041 | 0.0617 | 0.1890 | |
| HGDP00665 | Sardinian | 211703 | 261689 | 116240 | 118827 | 1633910 | 0.0772 | 0.1984 | |
| Avar | Avar | 161692 | 197302 | 84076 | 92078 | 1262525 | 0.0653 | 0.1804 | |
| Mari | Mari | 67063 | 81810 | 32757 | 40631 | 547086 | 0.0397 | 0.1554 | |
| Tadjik | Tadjik | 195832 | 247682 | 99654 | 118142 | 1567438 | 0.0385 | 0.1748 | |
| Indian | Indian | 170384 | 214686 | 86426 | 103309 | 1371359 | 0.0382 | 0.1722 | |
| Excluding sites where a C and T or G and A were observed | |||||||||
|---|---|---|---|---|---|---|---|---|---|
| ID | Population | n(AAAa) | n(AaAA) | n(AAaa) | n(AaAa) | n(AAAA) | Drift in population | Drift in Anzick-1 | |
| HGDP00877 (masked) | Mayan | 38605 | 35517 | 12138 | 24518 | 334804 | 0.0232 | 0.0000 | |
| HGDP00998 | Karitiana | 68442 | 51065 | 24000 | 34758 | 554162 | 0.1519 | 0.0000 | |
| BI16 | Karitiana | 60878 | 47002 | 20607 | 33087 | 509629 | 0.1216 | 0.0000 | |
| Saqqaq | Saqqaq | 46180 | 39448 | 21528 | 21683 | 358284 | 0.1869 | 0.0974 | |
| HGDP00778 | Han | 64920 | 74011 | 29884 | 38635 | 527612 | 0.0507 | 0.1273 | |
| HGDP01307 | Dai | 65190 | 74986 | 30472 | 39117 | 530308 | 0.0501 | 0.1316 | |
| HGDP00542 | Papuan | 73369 | 62598 | 43620 | 29859 | 522442 | 0.2693 | 0.1842 | |
| Aboriginal | Aboriginal | 34529 | 30008 | 20184 | 14512 | 250288 | 0.2544 | 0.1787 | |
| HGDP00521 | French | 65748 | 83094 | 34912 | 38023 | 514107 | 0.0563 | 0.1915 | |
| HGDP00665 | Sardinian | 65549 | 81338 | 35819 | 36721 | 506155 | 0.0749 | 0.1987 | |
| Avar | Avar | 49028 | 60027 | 25643 | 27920 | 384344 | 0.0657 | 0.1825 | |
| Mari | Mari | 19666 | 24153 | 9541 | 12091 | 160779 | 0.0334 | 0.1531 | |
| Tadjik | Tadjik | 60041 | 76457 | 30652 | 36532 | 483570 | 0.0357 | 0.1758 | |
| Indian | Indian | 52265 | 65827 | 26564 | 31632 | 420851 | 0.0391 | 0.1728 | |
Supplementary Material
Acknowledgments
We thank the Danish National High-throughput DNA Sequencing Centre for help with sequencing, Dr. Brenna Henn and Dr. Jeff Kidd for assistance with HGDP data, Joshua Keene for help with illustrations, Dr. Mingkun Li, Dr. Philip L F Johnson and Dr. Mark Stoneking for their help with the mtDNA analysis, Dr. Larry A. Lahren for crucial input to the site description and for establishing contact to the Native American groups, Dr. Julie E. Morrow, Dr. Stuart Fiedel and Dr. Eline Lorenzen for helpful comments to the manuscript. GeoGenetics were supported by the Lundbeck Foundation and the Danish National Research Foundation (DNRF94). MD was supported by the U.S. National Science Foundation (grant DBI-1103639). ASM was supported by the Swiss National Science foundation. GDP was supported by NSF graduate research fellowship DGE-1147470. MaM, MK, KT, and LS, were supported by European Regional Development Fund through the Centre of Excellence in Genomics to Estonian Biocentre and University of Tartu, Estonian Basic Research (grant SF0270177As08) and Estonian Science Foundation (grant nr 8973). Computations in Uppsala were performed on resources provided by SNIC-UPPMAX (project b2012063) and in Tartu using the HPC centre of the University of Tartu. We thank the North Star Archaeological Research Program, Center for the Study of the First Americans, Texas A&M University, Mr. Earl Hill, and Stafford Research, Inc. for some project funding.
Footnotes
Supplementary Information is linked to the online version of the paper at www.nature.com/nature.
Author statement
Acknowledging the complex ethical and legal issues surrounding the research of Native American human remains in the United States, we have striven not only to comply with federal and state law but also to proactively consult with Native American tribes. The Anzick burial site was discovered on private land and the remains recovered have not been in control of a federally funded museum or federal agency, and thus the Native American Graves Protection and Repatriation Act (NAGPRA) does not apply. Under Montana state law, unmarked human burials are not considered abandoned. Advice provided to the project by members of the Montana State Burial Board, however, confirmed that since no claimant has made a request for the remains, the human remains from the Anzick burial site remain under the control of the landowners, the Anzick family. However, to ensure that Native American concerns were addressed, we have informed nine Native American groups with reservations in the surrounding area of the Anzick site about our work. EW and SD visited in person the cultural representatives of the Northern Cheyenne, Crow, Black Feet and Salish and Kootenai tribes. SD was in direct contact with the Lakota, Rocky Boys, Assiniboine, Gros Ventre and Chippewa cultural representatives. We received no objections to our research from these groups; however, many of the tribal representatives requested reburial of the remains. The Anzick family is working with Crow member, SD, towards an intertribal reburial ceremony, with the Crow acting as the lead tribe in these efforts.
Author contributions
EW, SLA, MW and TWS conceived the project. EW headed the project. EW and MR designed the research project setup. RN supervised the bioinformatical and population genetic analyses. SMD helped with ethics and contact to local communities. SLA and MW provided access to the Anzick-1 sample and the archaeologic context, with input from SSW and DM. TWS performed AMS 14C dating, stable isotope analyses and provided geochemical and geoarchaeological assessments. SLA and JS performed initial mtDNA screening experiments. Elk extracts were processed by PDH and IB. Ancient DNA extractions and library constructs for shotgun sequencing, preparation for sequencing was done by MR. OEC prepared the two modern genomes. MR and SR did initial bioinformatics and mapping of the ancient sample. Mapping of modern samples, and genotype calls was done by SR, with input from TSK. SR, TSP and SB provided super computing resources. OEC and SR did phasing and ancestry painting. MA and MC did half-life estimates, with input on geology from TWS. DNA damage patterns were done by MR and LO. mtDNA consensus and damage estimate was done by ASM. IM and AA performed the X chromosome contamination estimates, error rate estimates and ABBA-BABA analyses. GDP did chrY analysis. MaM did ADMIXTURE analysis. KT, MK and MaM did mtDNA characterization. PS did f3-statistics on SNP array data and tested Native American population models using D-statistics. MD performed TreeMix analysis, and genome-wide f3-statistics. RN and MD developed and implemented the ancestry test. MR, SLA, MW, PS, MD, RN and EW wrote the majority of the manuscript with critical input from TWS, MA, ASM, SR, IM, AA, GDP, KT, MaM, RG, VG, RY, PDH, OEC, MC, FB, AM and the remaining authors.
Author Information
Sequence data (fastq files) for Anzick-1 is available for download through NCBI SRA accession number SRX381032. Additionally, alignments and genotype calls are available for download, http://www.cbs.dtu.dk/suppl/clovis/. Raw reads (fastq files) and alignments (BAM files) for the two modern genomes sequenced in this study are available for demographic research under data access agreement with E.W. (ewillerslev@snm.ku.dk). The Cervus elaphus sequences are available under GenBank accession KF906070, KF906071 and KF906072.
The authors declare no competing financial interests.
References
- 1.Waters MR, Stafford TW. Redefining the age of Clovis: implications for the peopling of the Americas. Science. 2007;315:1122–1126. doi: 10.1126/science.1137166. [DOI] [PubMed] [Google Scholar]
- 2.Goebel T, Waters MR, O’Rourke DH. The late Pleistocene dispersal of modern humans in the Americas. Science. 2008;319:1497–1502. doi: 10.1126/science.1153569. [DOI] [PubMed] [Google Scholar]
- 3.Meltzer DJ. First Peoples in a New World. Univ of California Press; 2009. [Google Scholar]
- 4.Stanford DJ, Bradley BA. Across Atlantic Ice: The Origin of America’s Clovis Culture. University of California Press; 2012. [Google Scholar]
- 5.Raghavan M, et al. Upper Palaeolithic Siberian genome reveals dual ancestry of Native Americans. Nature. 2013 doi: 10.1038/nature12736. [DOI] [PMC free article] [PubMed] [Google Scholar]
- 6.Lahren L, Bonnichsen R. Bone Foreshafts from a Clovis Burial in Southwestern Montana. Science. 1974;186:147–150. doi: 10.1126/science.186.4159.147. [DOI] [PubMed] [Google Scholar]
- 7.Owsley DW, Hunt D. Clovis and early Archaic crania from the Anzick site (24PA506), Park County, Montana. Plains Anthropologist. 2001;46:115–124. [Google Scholar]
- 8.Lahren LA. Homeland. Cayuse Press; 2006. [Google Scholar]
- 9.Bradley BA, Collins MB, Hemmings A. Clovis Technology. 2010. (Archaeological Series 17). [Google Scholar]
- 10.Morrow JE, Fiedel SJ. Paleoindian Archaeology: A Hemispheric Perspective. University Press of Florida; 2006. pp. 123–138. (Morrow, J. E. & Fiedel, S. J.) [Google Scholar]
- 11.Perego UA, et al. Distinctive Paleo-Indian migration routes from Beringia marked by two rare mtDNA haplogroups. Curr Biol. 2009;19:1–8. doi: 10.1016/j.cub.2008.11.058. [DOI] [PubMed] [Google Scholar]
- 12.Kemp BM, et al. Genetic analysis of early holocene skeletal remains from Alaska and its implications for the settlement of the Americas. Am J Phys Anthropol. 2007;132:605–621. doi: 10.1002/ajpa.20543. [DOI] [PubMed] [Google Scholar]
- 13.van Oven M, Kayser M. Updated comprehensive phylogenetic tree of global human mitochondrial DNA variation. Hum Mutat. 2009;30:E386–94. doi: 10.1002/humu.20921. [DOI] [PubMed] [Google Scholar]
- 14.Behar DM, et al. A ‘Copernican’ reassessment of the human mitochondrial DNA tree from its root. Am J Hum Genet. 2012;90:675–684. doi: 10.1016/j.ajhg.2012.03.002. [DOI] [PMC free article] [PubMed] [Google Scholar]
- 15.Pruvost M, et al. Freshly excavated fossil bones are best for amplification of ancient DNA. Proc Natl Acad Sci USA. 2007;104:739–744. doi: 10.1073/pnas.0610257104. [DOI] [PMC free article] [PubMed] [Google Scholar]
- 16.Allentoft ME, et al. The half-life of DNA in bone: measuring decay kinetics in 158 dated fossils. Proc R Soc B. 2012;279:4724–4733. doi: 10.1098/rspb.2012.1745. [DOI] [PMC free article] [PubMed] [Google Scholar]
- 17.Briggs AW, et al. Patterns of damage in genomic DNA sequences from a Neandertal. Proc Natl Acad Sci USA. 2007;104:14616–14621. doi: 10.1073/pnas.0704665104. [DOI] [PMC free article] [PubMed] [Google Scholar]
- 18.Fu Q, et al. A revised timescale for human evolution based on ancient mitochondrial genomes. Curr Biol. 2013;23:553–559. doi: 10.1016/j.cub.2013.02.044. [DOI] [PMC free article] [PubMed] [Google Scholar]
- 19.Rasmussen M, et al. Ancient human genome sequence of an extinct Palaeo-Eskimo. Nature. 2010;463:757–762. doi: 10.1038/nature08835. [DOI] [PMC free article] [PubMed] [Google Scholar]
- 20.Poznik GD, et al. Sequencing Y chromosomes resolves discrepancy in time to common ancestor of males versus females. Science. 2013;341:562–565. doi: 10.1126/science.1237619. [DOI] [PMC free article] [PubMed] [Google Scholar]
- 21.Patterson N, et al. Ancient admixture in human history. Genetics. 2012;192:1065–1093. doi: 10.1534/genetics.112.145037. [DOI] [PMC free article] [PubMed] [Google Scholar]
- 22.Reich D, et al. Reconstructing Native American population history. Nature. 2012;488:370–374. doi: 10.1038/nature11258. [DOI] [PMC free article] [PubMed] [Google Scholar]
- 23.Pickrell JK, Pritchard JK. Inference of population splits and mixtures from genome-wide allele frequency data. PLoS Genet. 2012;8:e1002967. doi: 10.1371/journal.pgen.1002967. [DOI] [PMC free article] [PubMed] [Google Scholar]
- 24.Straus LG, Meltzer DJ, Goebel T. Ice Age Atlantis? Exploring the Solutrean-Clovis ‘connection’. World Archaeology. 2005;37:507–532. [Google Scholar]
- 25.Fagundes NJR, et al. Mitochondrial population genomics supports a single pre-Clovis origin with a coastal route for the peopling of the Americas. Am J Hum Genet. 2008;82:583–592. doi: 10.1016/j.ajhg.2007.11.013. [DOI] [PMC free article] [PubMed] [Google Scholar]
- 26.Jantz RL, Owsley DW. Variation among early North American crania. Am J Phys Anthropol. 2001;114:146–155. doi: 10.1002/1096-8644(200102)114:2<146::AID-AJPA1014>3.0.CO;2-E. [DOI] [PubMed] [Google Scholar]
- 27.Steele DG, Powell JF. Who Were the First Americans: Proceedings of the 58th Annual Biology Colloquium. Center for the Study of the First Americans, Oregon State University; 1999. pp. 97–126. [Google Scholar]
- 28.Dillehay TD, et al. Monte Verde: seaweed, food, medicine, and the peopling of South America. Science. 2008;320:784–786. doi: 10.1126/science.1156533. [DOI] [PubMed] [Google Scholar]
- 29.Kemp BM, Schurr TG. In: Human Variation in the Americas. Auerbach BM, editor. Southern Illinois University; 2010. pp. 12–50. [Google Scholar]
Associated Data
This section collects any data citations, data availability statements, or supplementary materials included in this article.