Significance
We demonstrate the role of free energy in determining the direction of motion in a biological process. A thermodynamics-motivated approach is used to show that free-energy changes in cell–cell signaling determine the force gradient for directed cell motion. Using isolated cell pairs and assays of secreted protein levels, we compute the free energy of the cell–cell signaling network as a function of cell–cell separation. The changes in free energy as a function of separation correspond to a potential-energy gradient that can influence cell–cell motion. Recordings of cell motion trajectories were compared with the direction of the gradient. Neutralizing the secreted proteins most involved in establishing the free-energy gradient cancels the directed motion.
Keywords: cell–cell force, cell motility, surprisal analysis, Langevin equation, Brownian dynamics
Abstract
Controlling cell migration is important in tissue engineering and medicine. Cell motility depends on factors such as nutrient concentration gradients and soluble factor signaling. In particular, cell–cell signaling can depend on cell–cell separation distance and can influence cellular arrangements in bulk cultures. Here, we seek a physical-based approach, which identifies a potential governed by cell–cell signaling that induces a directed cell–cell motion. A single-cell barcode chip (SCBC) was used to experimentally interrogate secreted proteins in hundreds of isolated glioblastoma brain cancer cell pairs and to monitor their relative motions over time. We used these trajectories to identify a range of cell–cell separation distances where the signaling was most stable. We then used a thermodynamics-motivated analysis of secreted protein levels to characterize free-energy changes for different cell–cell distances. We show that glioblastoma cell–cell movement can be described as Brownian motion biased by cell–cell potential. To demonstrate that the free-energy potential as determined by the signaling is the driver of motion, we inhibited two proteins most involved in maintaining the free-energy gradient. Following inhibition, cell pairs showed an essentially random Brownian motion, similar to the case for untreated, isolated single cells.
Changes in free energy define the direction for spontaneous changes in chemistry and physics. As examples, chemical gradients and electrical potential changes across membranes (1) may be viewed as chemical potentials that define a direction (2, 3). Other examples include chemotaxis (2–4) and active transport (1), both of which show that overcoming a concentration gradient requires work in the sense of expenditure of free energy. In this study, we aim to show that the thermodynamic analog of the free energy of an intercellular signaling system, mediated by secreted proteins, acts to determine the direction of change in cell–cell movement. Secreted proteins are a vehicle for cell–cell communication and signaling (5) and, once received by a cell, can initiate intracellular signaling cascades, resulting in changes in gene transcription, protein expression, and the activation of cellular functions. Such functions might include cell division, the secretion of a new group of proteins, or, as investigated here, cell motility (1).
Our experiment is a system of two interacting but otherwise isolated cells for which we measure both cell motion trajectories over a period of several hours and, at the terminal time point, the expression levels of a panel of secreted proteins. The experimental platform is the single-cell barcode chip (SCBC), which permits measurements of statistically significant numbers of cells (6–9).
Our information-theoretic analysis (10) of the experimental data regards the signaling proteins as species mediating the exchange of information between cells. This analysis is used to determine the changes with distance of the free energy of the cell–cell signaling and to show that the cell–cell relative motion can be described as a constrained Brownian motion. We show that the direction of change in cell movement is toward a more stable cellular arrangement where cell–cell signaling is balanced. Inhibiting that signaling results in a loss of the directed movement; the cells move in a purely Brownian-type random walk, similar to the case of single isolated cells. In other words, we determine a cell–cell potential that characterizes the cell–cell motion in a way that is similar to other two-body interacting systems in physics and chemistry. We show that this potential is established through the exchange of secreted protein. By identifying those key signaling proteins, we can experimentally control the cell–cell motion.
Results
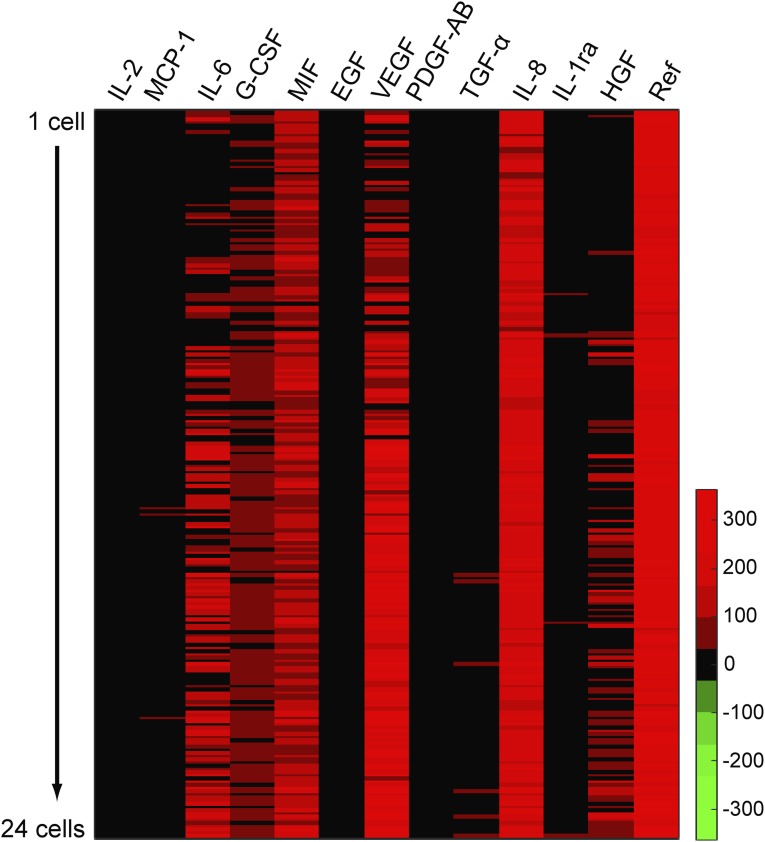
Our experimental design is guided by previous observations (10) that a pair of glioblastoma (GBM) cancer cells will exhibit a stable steady state that is characterized by a narrow range of intercellular separation distances. A hypothesis tested in this work is that one or more secreted proteins mediates that stable separation and directs cell migration toward that stable state. Thus, we sought to capture both relative motion trajectories for pairs of cells, as well as the levels of secreted proteins that might influence those trajectories. To determine an optimal panel of secreted proteins for monitoring single cells and cell pairs, we initially assayed for 12 secreted cytokines and growth factors from single and small populations of U87EGFR cells (Fig. S1). U87EGFR cells are model GBM cancer cells characterized by overexpression of the epidermal growth factor receptor (EGFR) (11). One protein served as a negative control, whereas the others were known to participate in cell–cell signaling [see summary in Medical Subject Headings database, MeSh (12)]. We chose five proteins that showed high signal-to-noise and good dynamic range: interleukin-6 (IL-6), IL-8, vascular endothelial growth factor (VEGF), hepatocyte growth factor (HGF), and macrophage migration inhibitory factor (MIF) (Fig. S1).
Fig. S1.
Heatmap of 12 secreted proteins from U87EGFR cells measured with SCBC. Rows represent data from each chamber and columns represent proteins measured. It shows protein secretion profile from single cells to 24 cells in a chamber. Based on these data, five proteins were selected for this study.
Experimental Measurements.
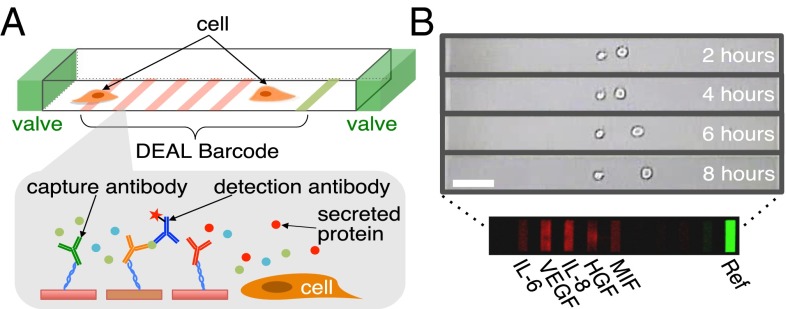
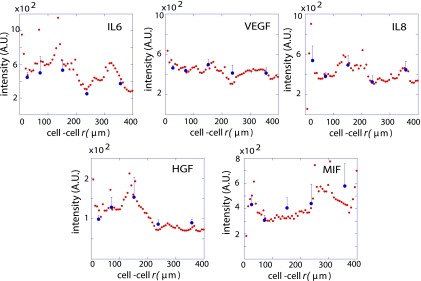
U87EGFR cells were randomly loaded into the microchambers of an SCBC (6–9) (Fig. 1). The SCBC design had 2,640 microchambers, and loading conditions were such that 200 microchambers contained cell pairs with initial cell–cell separations that ranged from a few to a few hundred micrometers. The same microchip also contained statistically significant numbers of chambers with single cells and zero cells. Following loading, the experimental protocol was as follows. First, the cells were allowed a 2-h acclimation period during which they adhered to the microchamber surface. Over the next 6 h, cell movements within the individual microchambers were tracked using microscopy imaging through the transparent microchip (Fig. 1B). During this period, specific secreted proteins (see below) are captured on designated elements of miniaturized antibody arrays that are patterned within each microchamber. Eight hours after the cells were loaded, the experiment is stopped, the chip is disassembled, and the antibody arrays are developed with fluorophore-labeled detection antibodies (Fig. 1B). The surface assays are digitized with a Genepix 4400A scanner (Molecular Devices), and the results for each microchamber are associated with the cellular motion measurements from that chamber. The zero-cell microchamber protein assays are used for background subtraction of the proteomic data, whereas cell tracking and proteomic data from one-cell and two-cell data are used for the analyses. For the two-cell microchambers, the measured secretion levels of the five proteins showed a clear dependence upon cell–cell separation (Fig. S2). We now turn toward understanding this cell separation dependence for five distance ranges.
Fig. 1.
Schematics of the experimental details. (A) Drawing of a single SCBC microchamber with valves and DEAL barcodes (Top) and the fluorescent sandwich immunoassay protein detection scheme (Bottom). (B) A representative time-lapse image of a two-cell chamber over 8 h. A typical fluorescence image of a barcode for the five assayed proteins is shown. (Scale bar: 100 μm.)
Fig. S2.
Functional protein expression levels as a function of distance in U87EGFR cells. Data representing functional protein expression levels 8 h after the start as a function of cell–cell separation distance from 200 cell pairs of U87EGFR cells (smooth red curve). The smooth red dataset has been generated in KaleidaGraph software by applying a Stineman function to the SCBC data. To ensure a statistically adequate number of cell pairs at every range, we broke the observed span of the cell–cell separations into five bins, r = 1, 2,..., 5 (blue dots). Blue dots represent mean values of protein copy numbers at every distance range. Values are mean ± SEM. The binned data of the protein expression levels were used further in surprisal analysis.
Quantification of the Stable State and the Constraints.
Cell–cell signaling and cell movement are associated processes (5, 13). Our hypothesis is that the cells will move in time toward the thermodynamically most stable state, which is a steady, balanced state (14). To identify the distance range that characterizes the most stable state, we use surprisal analysis (15–17). (For more details, see Supporting Information.) Surprisal analysis also provides characterizations of those intercellular separations that are less stable, by computing the extents of deviations of the protein concentrations from those at the steady state (18, 19). These deviations represent constraints, which are any processes that are influenced by specified groups of signaling proteins, and which constrain the cell pair from reaching the stable separation. The principle equation is as follows:
| [1] |
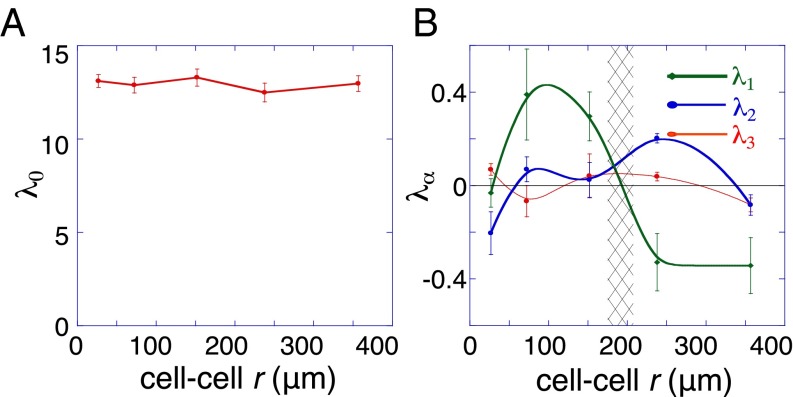
Here, is the observed mean intensity of protein i at an intercellular distance range, r. The intensity at the (stable) state of minimal free energy is . The weights describe the extent to which a given protein i participates in a constraint α. is the amplitude of the constraint α at a distance range r. The distance range with the most stable cell–cell signaling is where the sum of the constraints is a minimum so that . We write to define as the amplitude of the stable state. Note that Eq. 1 resolves the contributions of the steady state at each cell separation r, and it is expected (and found) to remain relatively constant (Fig. 2A).
Fig. 2.
Quantification of the variation with cell–cell distance of the stable state and the constraints. (A) The analysis shows that the amplitude of the steady-state term does not vary with the cell–cell distance r. (B) The amplitudes of the two constraints and , represented by and reflect the extent of the deviation of the measured secreted network from the steady state as a function of cell separation r. The error bars represent SDs of the mean protein levels as a function of distance. Note that, near r = 200 μm, the amplitude of the constraints is near zero, implying that this represents a steady-state separation distance. There is also a region at short separations where the steady-state contribution is dominant.
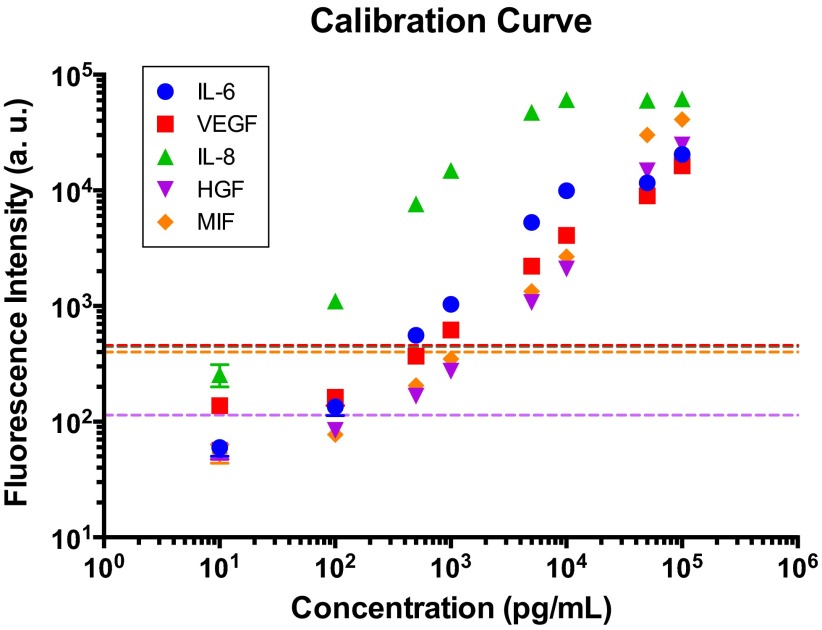
Experimental measures of protein levels are converted from fluorescence intensities into copy numbers using calibration curves (Fig. S3). The natural log of those values, , is input into Eq. 1 in a matrix form where all entries at a given distance bin r are a column and a given protein is along a row. Eq. 1 was fitted to the experimental data using a numerical procedure for diagonalizing the nonsquare data matrix. When the number of constraints in Eq. 1 is less than the number of distance bins, we ensure that the fit requires fewer parameters than we have data points. (This procedure is discussed in Supporting Information and in detail in refs. 10, 18, and 19.) The fitted amplitudes of the steady state and the main unbalanced processes as a function of r are plotted in Fig. 2 A and B. The steady-state term has a large and unchanging amplitude over the full distance range and is the most significant contributor to the cell–cell signaling.
Fig. S3.
Quantitation of fluorescence intensity vs. concentration for all five proteins. Mixtures of standard proteins with eight predefined concentrations were introduced to eight microchannels of the SCBC device, respectively. The averaged levels of fluorescence intensity for two-cell chambers are indicated as dotted lines. Different line colors represent specific proteins according to the colors in the legend. Fluorescence signal levels from two cells lie on the linear region of the calibration curve. Error bars indicate SD.
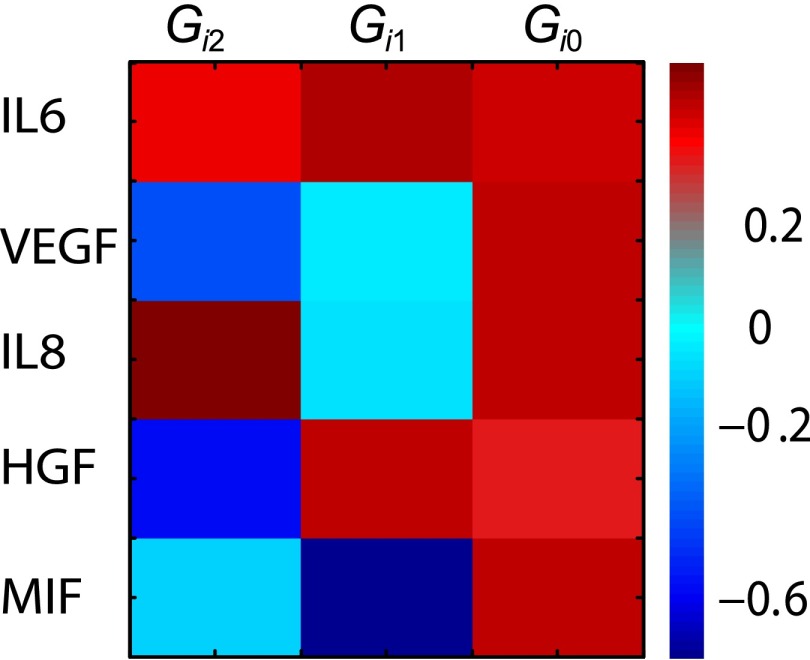
We resolved two distance-dependent constraints, , operating in the two-cell system (Fig. 2B). The secreted proteins whose levels are most influenced by those constraints are presented in the Fig. S4. The amplitudes of the constraints are at a minimum at a distance range of ∼200 μm, implying that this is the range with the most stable cell–cell signaling, and thus the most probable cell separation.
Fig. S4.
Extent of participation of the proteins in the unbalanced processes and at the steady state. Surprisal analysis yields the extent of participation of each assayed protein in the biological unbalanced processes described by the constraints and at the steady state . The secreted proteins contribute similarly to the steady state because values are very similar. IL-6 and HGF deviate in the same direction from the steady state, because their values possess the same sign, and their expression is anticorrelated to the MIF protein in the first unbalanced process, . IL-6 and HGF are expressed above the steady-state level at the shorter cell–cell distances and below at the longer (Fig. 2B). IL-6 and IL-8 contribute significantly and in the same manner to the according to the amplitude (Fig. 2B).
The Stable State of the Signaling Defines the Stable Point of the Motion.
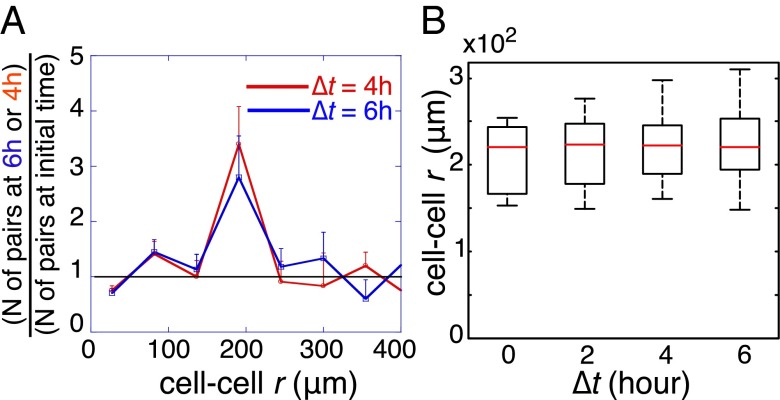
An analysis of cell trajectories indicated that more cell pairs reached a separation distance of about 200 μm after 8 h of incubation relative to the initial time point of 2 h of incubation (Fig. 3A). Moreover, cells that had an initial cell–cell distance of ∼200 μm did not change their cell–cell distance over time (Fig. 3B). This result confirms the steady-state prediction and shows that cells separated initially by the steady-state distance have the lowest cell–cell interaction potential. Furthermore, cells initially located at shorter or longer cell–cell distances move over time toward the stable separation.
Fig. 3.
The stable state of the signaling defines the stable point of the cell–cell motion. (A) Cell–cell separation distances, for 200 pairs of U87EGFR cells, after the initial acclimation (Δt = 0 h) and after delays of Δt = 4 and 6 h, were binned to form histograms that give the probability for finding a pair of the cells at a given distance range. The probability determined for delays of 4 and 6 h was divided by the probability following acclimation, Δt = 0, showing that cells from distances below or above the 200-μm range move in time toward the midpoint. (B) Cell–cell separation distances for U87EGFR cell pairs after delays of Δt = 2, 4, and 6 h, for the 20 cells pairs that were initially (Δt = 0 h) observed at the steady-state separation distance (∼200 μm). As shown, this special subset of cells that are initially at about the most stable distance do not move over the following 6-h interval. Contrast with the other subsets of cells (A).
The Influence of the Cell–Cell Interaction Potential on Cell Migration.
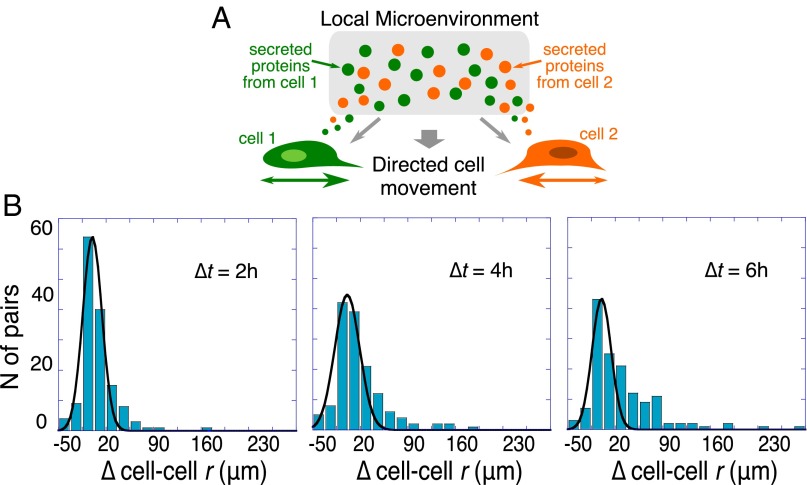
We proceed to verify our hypothesis that cell–cell signaling determines the cell–cell interaction potential and thus directs cell motion toward the stable separation distance. To do so, we observe the changes in cell–cell separations in different time intervals. In Fig. 4, we plot histograms of these changes in cell–cell separation (∆cell–cell r) for cell pairs initially separated by distances smaller than 200 μm over different 2-h intervals. For an isolated particle in a liquid medium, the relative motion would behave as random diffusion (Brownian motion). Therefore, we can expect that, in the absence of cell–cell interactions, the relative cell displacement will be Gaussian distributed. Deviations from such a bell-shaped symmetric curve provide a signature of cell–cell forces, which we anticipate will preferentially move cells toward the stable midpoint.
Fig. 4.
Histograms of cell–cell displacements from the starting value. (A) Schematic illustration of the local microenvironmental condition. (B) Shown are histograms of changes in cell–cell separation distance from the initial value (∆cell–cell r), taken after 2 h of on-chip cell adaptation. Data are plotted for time intervals of ∆t = 2, 4, and 6 h for cell pairs initially separated by distances <200 μm (determined to be the stable point). The histograms were fitted to a Gaussian distribution to highlight deviations as time increases. The fit is acceptable at the shortest time, (R2 = 0.95 for ∆t = 2 h) but not at longer times (R2 = 0.89 and 0.7 for ∆t = 4 and 6 h, respectively). The asymmetry that emerges over time is evidence of active, unbalanced processes arising from cell–cell interactions.
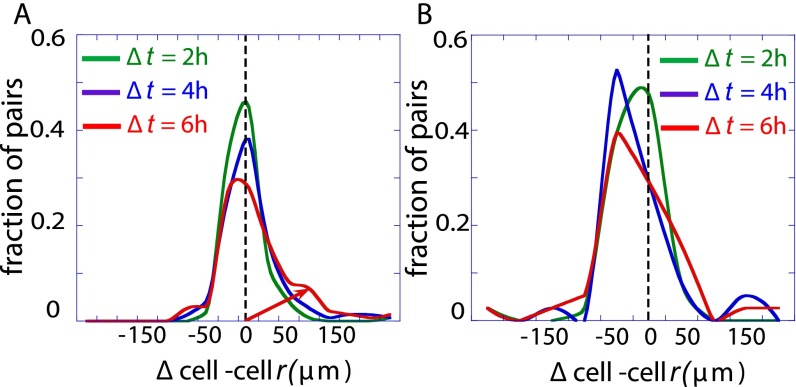
Referring to the histograms of Fig. 4, cells initially exhibit a near Gaussian distribution of cell–cell displacements for ∆t = 2 h. (Fig. 4 and a summary in Fig. S5A), but developed an increasingly resolved tail toward higher positive values for the time intervals ∆t = 4 and 6 h (Fig. 4), thus implying the presence of nonrandom forces influencing cell migration. If we analyze just those cells initially located <200 μm from each other, the trend over time is toward larger separations (Fig. 4 and Fig. S5A). By contrast, cell pairs initially separated by >200 μm (Fig. S5B) tended to reduce the cell–cell distance.
Fig. S5.
Examination of cell–cell movement toward the steady state. The displacements observed after ∆t = 2, 4, and 6 h were binned into histograms for the cell pairs initially separated by <200 μm (A) and at >200 μm (B). The smooth curves for the histograms were generated in KaleidaGraph software by applying a Stineman function to the data. The plots are presented on the same scale (∆cell–cell r) for comparison.
Determining Equations of Motions for Cell Pairs.
We explore here the hypothesis that cell–cell motion can be approximated to leading order by a two-body interaction potential, similar to other two-body systems in physics and chemistry. To this end, we describe a quantitative approach for simulating the experimentally measured kinetic cell trajectories from Figs. 3 and 4. In particular, we show that the equations of motions that are used to simulate the general case of high-friction motion apply to cell–cell movement (20, 21).
When motion is heavily damped, the equation of motion that also includes the role of a random force is the Langevin equation (22), which takes the following form (23):
| [2] |
The inputs required are the diffusion coefficient D, the fiction coefficient γ, and the cell–cell two-body potential . The random motion is described by the isotropic random force and is the only force term when the cell is isolated. The solution of Eq. 2 under a random force alone leads to Gaussian-distributed displacements (22, 23).
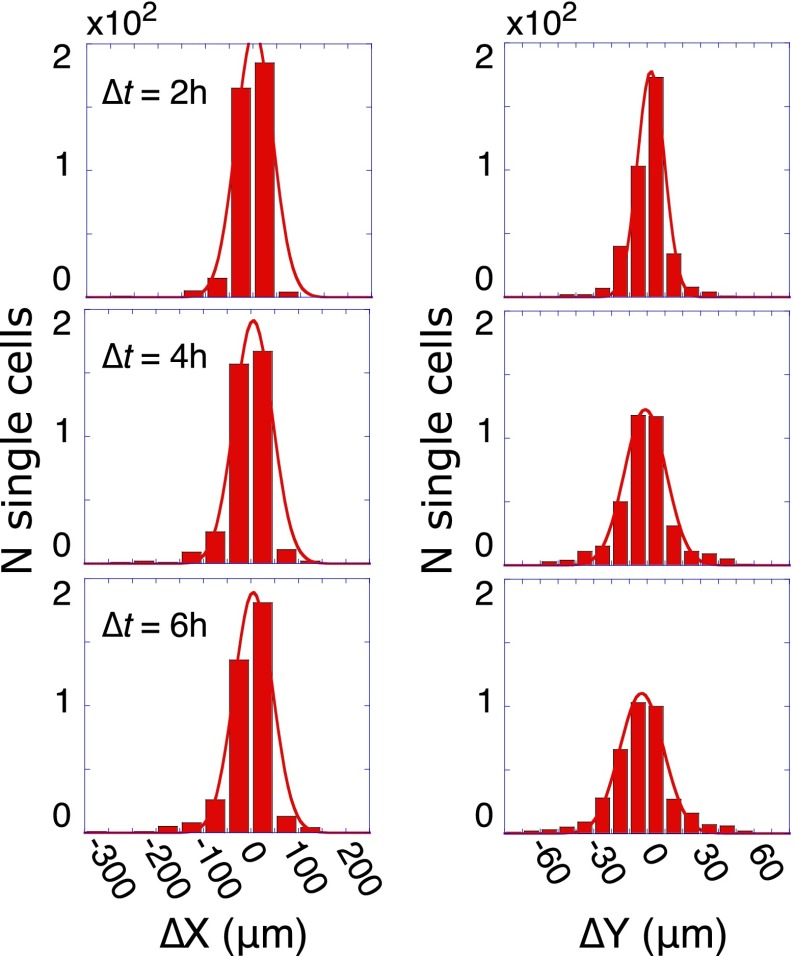
We begin by an examination of the role of the friction on the cell movement. To do so, we exclude the influence of signaling by confining attention to measurements of cell motion within the ∼400 microchambers that contained only single cells. In Fig. 5, we show histograms of the displacements in the directions of the microchamber length (X) and width (Y) (Fig. 5). The Gaussian shapes for all time windows demonstrate that the motion of isolated cells is indeed random, with the cells performing a Brownian motion with diffusion coefficient D. The width of the distributions increases only slowly with time, implying that cell motion is heavily damped by cell adhesion to the surface (high friction). The Stokes–Einstein relation expresses D in terms of the friction coefficient γ at a given temperature T by (22, 23), where is Boltzmann’s constant. Thus, these single-cell trajectories provide us with two of the three inputs for Eq. 2, and so we now turn toward determining the cell–cell interaction potential .
Fig. 5.
Brownian-like motion of isolated cells. Displacements of noninteracting single cells in the X (left column) and Y directions, observed after time delays of ∆t = 2, 4, and 6 h for about 400 isolated single cells. Displacements were binned into histograms and fitted to Gaussian distributions (R2 > 0.97 for all histograms). Because the microchamber is rectangular, the displacements along X and Y do not span the same range. The diffusion coefficient D was determined from the fits using the Einstein–Smoluchowski equation for the width of the histogram in a given direction, .
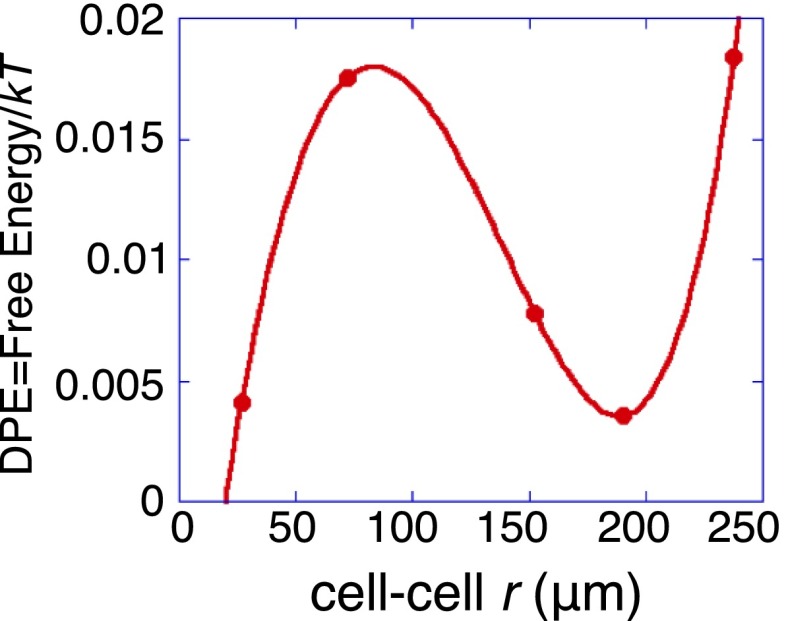
At a stable point, the potential is at a minimum. is the work required to displace the cell–cell system to the separation r and is computed from the experimental levels of the secreted proteins, and the calculated protein levels at the steady state (Fig. S6). Surprisal analysis determines this separation to be about 200 μm. About a stable separation the potential must increase parabolically. Over most of the distance ranges, surprisal analysis shows that a harmonic restoring potential is satisfactory in describing the deviations from the stable state (Fig. S6). The force, , for the Langevin equation (Eq. 2), is therefore taken to be a linear restoring force [Hooke’s law (22)] about the stable separation. However, the parabolic rise of the harmonic potential is not consistent at very small cell–cell separations (below about 50 μm) as further discussed in Supporting Information (Surprisal Analysis, Free Energy as a Function of Cell–Cell Separation) and also plotted in Fig. S6. This is likely attributable to physical contact between the cells (24), which can either increase the effective friction or provide an additional steady state. A close agreement with the experiment for small cell–cell separations requires a restoring force that is not as high as harmonic (Materials and Methods).
Fig. S6.
Free energy as a function of cell–cell separation (in units of the thermal energy kT, per protein). The DPE function was calculated using the experimental levels of the secreted proteins, and the calculated protein levels at the steady state . Dots: experimental results computed as described in Surprisal Analysis, Free Energy as a Function of Cell–Cell Separation. Curve: a polynomial fit showing the harmonic potential about the minimum at 200 μm and the low value at very short distances, likely reflecting cell–cell adhesion.
Using the extracted parameters D, γ, and , we solved the Langevin equation for 5,000 simulated trajectories of cell–cell motions sampling the variety of experimentally sampled initial cell–cell separations (Fig. S7A and Materials and Methods).
Fig. S7.
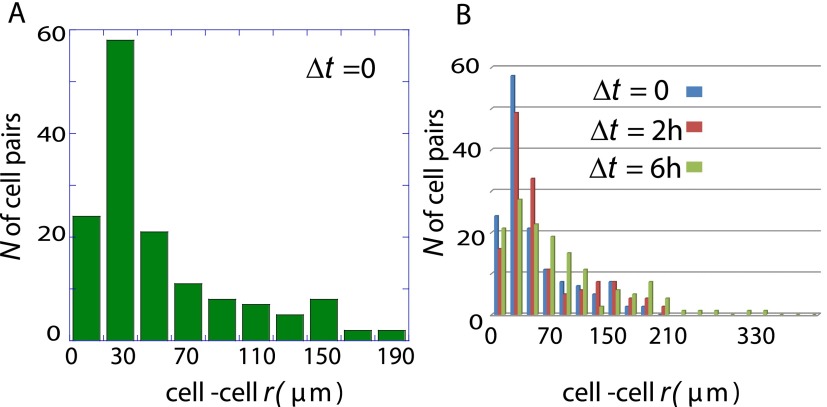
Distribution of cell–cell separations immediately after acclimation and after an additional delay of 2 and 6 h. (A) Experimental results for the distribution of cell–cell separations at the earliest time point, acclimation (2 h after the cell loading to the chip, Δt = 0 h). The cell–cell separations observed after acclimation were binned into histograms for the cell pairs initially separated by <200 μm. (B) Experimental results for the distribution of cell–cell separations at the earliest time point as shown in A and after Δt = 2 and 6 h are shown. The cell–cell separations were binned into histograms for the cell pairs initially separated by <200 μm. The cells that are separated by less than about 50 μm do not move by much toward the steady-state separation of .
The resulting cell–cell displacement distributions were converted into histograms at ∆t = 2, 4, and 6 h (Fig. 6). These theoretical results correspond to a relaxation time of 8 h of the initial cell distance distribution (Materials and Methods). This is consistent with the experimental data and shows that, after 6 h, the distribution is still far from being centered about the most probable separation. The theoretical computations (Fig. 6) are in excellent agreement with the experimental measurements (Fig. 4). This result shows that the cell–cell interaction potential , which was extracted from the proteomic measurements of signaling proteins, can be used in a Langevin equation of motion to accurately describe the relative experimental migration of the U87EGFR cell pairs.
Fig. 6.
Theoretical histograms of cell–cell displacements, generated using 5,000 trajectories calculated by using the high friction limit of the Langevin equation, with a potential determined by the observed cell–cell signaling vs. distance. The theoretical histogram is to be compared with experimental results of Fig. 4. The potential used was harmonic about the steady-state separation of 200 μm. The high rise of the harmonic potential away from its minimum at 200 μm was moderated for distances below 50 μm, to match experimental observations at short separations.
Restraining the Unbalanced Signaling Inhibits the Directed Motion.
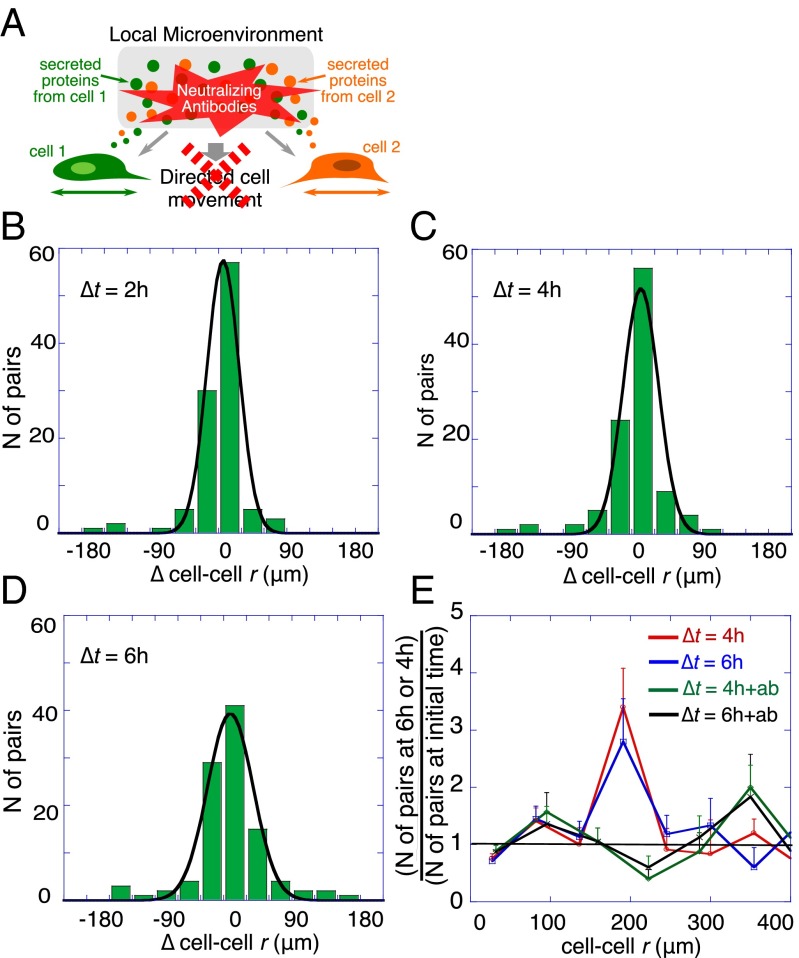
Our hypothesis is that unbalanced signaling induces the directed motion. As a direct test of this hypothesis, we identified those proteins most associated with the unbalanced processes. Fig. S4 shows the weights of secreted proteins in the balanced state and in the two unbalanced processes. For the most important process , HGF and IL-6 dominate. Accordingly, we measured the cell motion trajectories for two cell microchambers under the influence of neutralizing antibodies to inhibit IL-6 and HGF signaling. Fig. 7 shows that, even after a delay of 6 h, there is hardly any directed motion, with zero-centered Gaussian distributions of slowly increasing widths with time, as expected for Brownian motion. The data clearly demonstrate that inhibiting unbalanced signaling hinders any directed motion but hardly affects the Brownian part. More generally, the data also illustrate that the information theory analysis of the proteomic data correctly identifies those signaling proteins that influence relative cell motion the most. It also shows that experimentally influencing the activity of those proteins provides an experimental handle for influencing cell organization and migration.
Fig. 7.
Cell–cell motion after treatment with neutralizing antibodies against IL-6 and HGF. (A) Schematic illustration of the local microenvironmental condition. (B–E) Following the inhibition of signaling, the changes in the distribution of the cell–cell displacements (∆cell–cell r) after ∆t = 2 h (B), ∆t = 4 h (C), and ∆t = 6 h (D). The results shown are for about 150 U87EGFR cell pairs that were initially separated by less than 200 μm. The measured displacements (∆cell–cell r) were binned into histograms. The histograms were fitted to Gaussian distribution (R2 > 0.95). Even after a delay of 6 h, the histogram of the cell–cell distances could be well fitted by a Gaussian distribution (R2 = 0.97). (E) The results shown in Fig. 3A and the corresponding results for a similar number of cell pairs treated with the neutralizing antibodies. For the antibody-treated cells (+ab), the probability of finding a cell pair at any distance range after 4 and 6 h was similar to the value at the initial time (green and black curves fluctuating about 1).
Discussion
Cell motion is an active biological process (20) that cannot be fully described by random Brownian motion (20, 21). The U87EGFR cancer cells investigated here are representative of the highly invasive disease of GBM, and so understanding the motility of such cells has both fundamental and practical value. We report on a search for a pairwise cell interaction potential that is governed by cell–cell signaling. The minimal point of this potential is the steady state of the cell–cell signaling. The potential induces cells to move toward that steady-state separation. We applied a thermodynamics-based theory to a dataset from hundreds of isolated cell pairs that integrated measurements of secreted protein levels with 6 h of cellular motion trajectories. Surprisal analysis of that dataset revealed the existence of a free-energy gradient, with an energy minimum at a cell separation of 200 μm. Analysis of the relative motion of the cell pairs revealed directed cell movement toward this steady-state separation, implying that, at this separation, cell–cell signaling is balanced and corresponds to the most stable state of the cell–cell potential. Away from this separation distance, the signaling is unbalanced, and cell motion is described by two tendencies: isotropic motility and directed movement due to the cell–cell potential gradient. Simulations of the directed motion using the high friction limit, the Langevin equation, and the potential derived from the signaling closely reproduced the experimental observations. We showed that the unbalanced cell–cell signaling is the cause of the directed motion by inhibiting those two proteins most responsible for the free-energy gradient. In summary, we show that soluble factor signaling between two cells can define a free-energy gradient, which, in turn, directs the relative cell motions. Experimental control over the levels of those soluble factors provides a handle for controlling cellular motion in a predictive fashion.
Materials and Methods
Surprisal Analysis.
The analysis was carried out as described in some detail before (19, 25) and in Supporting Information. The particular application to pairs of cells has also been presented (10) for the purpose of determining the most stable steady-state separation in U87EGFRvIII and U87PTEN cell types. It was shown therein that this separation as determined for isolated cell pairs accounts for the most probable cell–cell distance in bulk cell cultures. This is similar to molecular liquids or crystals where the two-body force provides a realistic first approximation for the many-body energy.
The Langevin Equation.
The equation is solved numerically by drawing random values between 1 and −1 for the random force, making a new drawing at each time step because the force is taken to be uncorrelated. To derive the interpretation in terms of relaxation time, we expand the cell–cell potential about the steady-state separation = 200 μm, namely . Near the Langevin equation reads , showing that for consistency of units has the dimension of “time” and that it has the interpretation of the relaxation time to the steady separation. The value for the relaxation time of 8 h is determined by the fit to the data for cells that are near .
The experimental results for the distribution of cell–cell separations at the earliest time after acclimation (Fig. S7A), and after an additional delays of 2 and 6 h (Fig. S7B), show that cells that were initially located at short cell–cell separation distances are not strongly attracted toward the steady-state separation of = 200 μm. However, the harmonic approximation for introduced above, implies a very strong restoring force at short distances, which is inconsistent with the experimental results (Fig. S7) at small separations . This is also inconsistent with the results of surprisal analysis of the signaling as shown in Fig. 2B and Fig. S6. At short distances, the signaling is almost stable (Fig. 2B and Fig. S6). Therefore, for separations below 50 μm, we reduce the force constant k down to 10% of its value for r = 200 μm.
Cell Culture and Reagents.
U87EGFR cells were kindly provided by Paul Mischel’s Laboratory (University of California, San Diego, La Jolla, CA). Cells were routinely maintained in DMEM (American Type Culture Collection) containing 10% (vol/vol) FBS in a humidified 5% (vol/vol) CO2 incubator at 37 °C. See Tables S1 and S2 for lists of DNAs and antibodies used in the study. For neutralization assay, anti–IL-6 and anti-HGF antibodies were added to single-cell suspension at a final concentration of 0.5 μg/mL, respectively, before loading into the device.
Table S1.
Reagents used: Oligonucleotides
| Name | DNA sequence | Melting point |
| B | 5′-NH3-AAA AAA AAA AAA AGC CTC ATT GAA TCA TGC CTA-3′ | 57.4 |
| B′ | 5′-NH3-AAA AAA AAA ATA GGC ATG ATT CAA TGA GGC-3′ | 55.9 |
| C | 5′-NH3-AAA AAA AAA AAA AGC ACT CGT CTA CTA TCG CTA-3′ | 57.6 |
| C′ | 5′-NH3-AAA AAA AAA ATA GCG ATA GTA GAC GAG TGC-3′ | 56.2 |
| D | 5′-NH3-AAA AAA AAA AAA AAT GGT CGA GAT GTC AGA GTA-3′ | 56.5 |
| D′ | 5′-NH3-AAA AAA AAA ATA CTC TGA CAT CTC GAC CAT-3′ | 55.7 |
| E | 5′-NH3-AAA AAA AAA AAA AAT GTG AAG TGG CAG TAT CTA-3′ | 55.7 |
| E′ | 5′-NH3-AAA AAA AAA ATA GAT ACT GCC ACT TCA CAT-3′ | 54.7 |
| F | 5′-NH3-AAA AAA AAA AAA AAT CAG GTA AGG TTC ACG GTA-3′ | 56.9 |
| F′ | 5′-NH3-AAA AAA AAA ATA CCG TGA ACC TTA CCT GAT-3′ | 56.1 |
| M | 5′-NH3-AAA AAA AAA AGT CGA GGA TTC TGA ACC TGT-3′ | 57.6 |
| M′ | 5′-Cy3-AAA AAA AAA AAC AGG TTC AGA ATC CTC GAC-3′ | 56.9 |
The table provides the sequences of the oligonucleotides used in the protein immunoassays. All oligonucleotides were synthesized by Integrated DNA Technology and purified via HPLC. The DNA-coding oligomers were pretested for orthogonality to ensure that cross-hybridization between noncomplementary oligomer strands was negligible (<1% in photon counts).
Table S2.
Reagents used: ELISA kits
| DNA label | Antibody | Source |
| Antibody for conjugation in SCBC | ||
| B′ | Human IL-6 DuoSet, 15 plate | R&D DY206 |
| C′ | Human VEGF DuoSet, 15 plate | R&D DY293B |
| D′ | Human CXCL8/IL-8 DuoSet, 15 plate | R&D DY208 |
| E′ | Human HGF DuoSet, 15 plate | R&D DY294 |
| F′ | Human MIF DuoSet, 15 plate | R&D DY289 |
| Antibody for neutralization | ||
| Human IL-6 mAb (clone 6708) | R&D MAB206 | |
| Human HGF mAb (clone 24612) | R&D MAB294 | |
All of the antibodies and standard proteins were purchased from R&D Systems. Shown is a list of the ELISA kits used for the SCBC multiplexed protein assay and two neutralizing antibodies.
SCBC Design and Fabrication.
The SCBC is composed of a two-layer elastomer microfluidics layer bonded on top of a barcode-patterned glass slide. Details of microchip design and fabrication can be found in Supporting Information. In brief, molds for polydimethylsiloxane (PDMS) microfluidic device were fabricated by photolithography. These molds were used to mold PDMS elastomer for flow and control layers that form 2,640 microchambers after thermal bonding. For experiments, cells are randomly loaded to microchambers and allowed to acclimate for 2 h. The cell numbers and cell positions are recorded using light microscopy through the transparent microchip. We observe that, even after a delay of 6 h, only a small fraction, about 15%, of the cells reach to the wall of the chamber.
Antibody Microarray.
The antibody microarray is prepared by converting an array of distinct ssDNA into an antibody array by hybridizing antibody–ssDNA conjugates. The detailed procedure of manufacturing the microarrays can be found in Supporting Information.
SCBC Assay.
A mixture of antibody–ssDNA conjugates in 1.5% (wt/vol) BSA (in 1× PBS) solution was flowed into the device for 1 h to convert the DNA barcodes into antibody microarrays. After removal of unbound conjugates, the channels were blocked with 1% BSA [in 1× PBS with Tween 20 (PBST)] solution for 1 h under flow condition. The channel surfaces were treated with laminin solution (0.075 mg/mL in 1× PBS) for 1 h followed by brief rinsing with cell culture medium. After cell loading to the SCBC device, control valves were closed to form 2,640 microchambers. The images of each chamber were recorded using a microscope–CCD camera (Olympus IX81) over an 8-h period at 2-h intervals. After the incubation, the cells were quickly flushed away by 1× PBST. The captured proteins were developed by flowing a mixture of biotin-labeled detection antibodies and Alexa Fluor 647-labeled streptavidin in BSA solution (1% in 1× PBST) for 1 h. The channels were washed with 1× PBST for 30 min. The barcode slide was then peeled off from the PDMS slab and rinsed thoroughly. After drying, the slide was scanned by an Axon GenePix 4400A. Signals from two-color channels were collected and digitized by the manufacturers’ software followed by analysis with a MATLAB-based custom algorithm.
Surprisal Analysis
Secreted proteins are a vehicle for cell–cell communication and signaling (5). Such signals, when received by a cell, can initiate intracellular signaling cascades, resulting in changes in gene transcription, protein expression, and the activation of cellular functions. Altered functions can include cell division, cell motility, or the secretion of a new group of proteins (1). Intercellular protein signaling depends upon the cell–cell distance and the processes that respond to signaling are balanced at the steady stable state (14). This balanced stable state corresponds to a particular distribution of the levels of the secreted proteins. As is discussed below, we seek to determine this steady-state distribution and to compare the observed distribution of signaling protein levels to those of the stable state. Any deviations from the stable state are interpreted as evidence for the presence of constraints, or unbalanced processes, operating on the cell–cell signaling. Those deviations are then translated to a change in free energy—the work that is required to displace the system from the stable state to the observed state (26). We use the thermodynamics-based surprisal analysis, discussed below, to compute this change in free energy. This is implemented by relating a change in the copy numbers of specific proteins to change in the chemical potential of those proteins. Our measurements enable us to plot the free energy vs. cell–cell separation.
The theoretical methodology of surprisal analysis, which was first applied to characterize the dynamics of nonequilibrium systems in chemical physics (16, 17), is based on searching for the state of maximum entropy of the system subject to constraints. The analysis is based on the assumption that the entropy of a system is at its possible maximum. Any biological perturbation that prevents the cells from reaching the steady state can be considered as a constraint and will therefore decrease the entropy from its maximal value at the steady state.
In biology, the temperature and the pressure can be considered to be constant. For experiments at constant temperature, an entropy maximum is equivalent to a free-energy minimum, and the state of lowest free energy is the steady state. Mathematically, searching for the entropy maximum given the constant temperature and pressure is equivalent to searching for the minimum of the function, what we call the free energy, under those constraints (27, 28). Surprisal analysis, as presented in Eq. 1 of the main text, identifies both the steady state and the biologically constrained state where the protein expression levels deviate from the steady state. The analysis is done for each of the five experimentally accessed distance ranges. Because our experiment measures only a few proteins, we are not completely capturing changes in the free energy of the full intercellular signaling system. However, we provide evidence that the proteins that we measure are sufficient enough for us to build a predictive model from them.
To motivate our approach, consider the result for the free energy G of an ideally dilute mixture as is derived in many textbooks. At a fixed pressure and temperature (T and P), the free energy G can be written as follows:
| [S1] |
where is the concentration of species i and is its chemical potential (22). The variation of the free energy at a fixed pressure and temperature satisfies the following:
| [S2] |
Eq. S2 is a special case of the celebrated Gibbs–Duhem equation, “a very useful result for solutions” (22). The Gibbs–Duhem equation reduces to Eq. S2 under the biological conditions of a fixed temperature and pressure. The experimental readouts of the SCBC technology, fluorescence intensities, can be reliably converted into concentrations of proteins based on the linear portion of the calibration curve (Fig. S3). We take a statistically sufficient number of readings, which enables us to say that the concentrations of the signaling proteins in the microchamber can be reliably determined as an average over the readings of many cells that are found at a given distance range. That concentration of protein i is denoted by . For the experimental details, see Detailed Experimental Methods below.
Implementation of Surprisal Analysis in Biology (for More Details, See Refs. 10, 18, and 19).
At a given time point, every distance range can be regarded as a different sample of mixture of signaling proteins. In the experiment, the concentrations of the signaling proteins were measured at the last time point, a delay of 6 h past the initial incubation of 2 h (Δt = 6 h). First, we relate protein concentrations to the chemical potential using the fundamental physical chemical relationships (27):
| [S3] |
By solving the system of the above equations, we obtain the following:
| [S4] |
From the experimental data , we seek to obtain , which is the functional protein expression expected at the steady state, as well as , which is the deviation from the steady state. The thermodynamic relations [S3] imply that the deviation, , represents a change in a free energy of the system due to the constraint(s). Eq. S4 allows the interpretation that, at every distance range, the biological system is in a state of maximal entropy. Unlike the stable state, the general case is a state of maximal entropy subject to signaling constraints. In the notation of Eq. 1 of the text, we write the following:
| [S5] |
Eq. S5 relates the protein distribution as a function of distance to the distribution at the maximal entropy without signaling constraints. Surprisal analysis seeks to identify the protein weights that describe the extent to which a given protein i participates in the steady state and in a constraint α (Fig. S4). Using the technique of Lagrange multipliers as described in refs. 10, 18, and 19, we also determine the values of the Lagrange multipliers as a function of cell–cell separation distance, r.
To numerically determine the values of the parameters that we need for our main equation,
| [S6] |
we use mathematical method called singular value decomposition (SVD). Detailed description of the method can be found in refs. 10, 18, and 19. Briefly, the input matrix for the SVD procedure has the mean values of the logarithms of the protein abundances along its rows. Each column is the results at a given distance range (columns). For each constraint (each value of α), the SVD procedure yields the values of the parameters and . As discussed (10, 18, 19), SVD also yields these values for the stable steady state .
We seek to identify which constraints are important, the biological meaning of those constraints (according to the participating proteins), and the influence of those constraints on the levels of the assayed proteins. Other than the steady-state term (), only two constraints, and 2 (Fig. 2 in the main text), are resolved by SVD. Thus, the steady-state level and two constraints quantitatively account for the observed mean protein expression levels at any of the measured intercellular separation distance ranges.
Free Energy as a Function of Cell–Cell Separation.
The plot of Fig. 2B shows that the amplitudes of the two constraints and go to zero near the intercellular separation range of 200 μm. Within this distance range, only the steady-state term contributes, which means the steady state is attained for cell pairs in this distance range. Shorter or longer distance ranges will represent states with higher free energy.
The deviation in free energy per protein molecule due to the biological constraints can be presented by the function DPE(r). Following ref. 10, we computed the free energy of the signaling proteins as a function of their relative distance:
If the system is at the steady state, then . According to the calculated , Fig. S6, two cells separated by around 200 μm are effectively at the steady state. It can be also noted that the free energy rises parabolically on both sides of the minimum. Furthermore we draw attention to the polynomial fit to the free energy vs. r as shown in Fig. S6 that strongly indicates a secondary minimum at short distances. See the main text for the implications.
Detailed Experimental Methods
Cell Culture and Reagents.
U87EGFR cells were kindly provided by Paul Mischel’s Laboratory (University of California, San Diego, La Jolla, CA). Cells were routinely maintained in DMEM (American Type Culture Collection) containing 10% (vol/vol) FBS in a humidified 5% (vol/vol) CO2 incubator at 37 °C. See Tables S1 and S2 for the lists of DNAs and antibodies used in the study. For neutralization assay, anti–IL-6 and anti-HGF antibodies were added to single-cell suspension at a final concentration of 0.5 μg/mL, respectively, before loading into the device.
Synthesis of DNA–1° Antibody Conjugates.
As-received antibodies (Table S2) were desalted, buffer exchanged to pH 7.4, 1× PBS and concentrated to 0.5 mg/mL using Zeba protein desalting spin columns (Pierce). Succinimidyl 4-hydrazinonicotinate acetone hydrazine (SANH) (Solulink) in N,N-dimethylformamide (DMF) was added to the antibodies at variable molar excess of (300:1) of SANH to antibody. Separately, succinimidyl 4-formylbenzoate (SFB) (Solulink) in DMF was added at 16-fold molar excess to 5′-aminated 30-mer oligomers in 1× PBS. After incubation for 4 h at room temperature, excessive SANH and SFB were removed by buffer exchange of both samples to pH 6.0 citrate buffer using protein desalting spin columns. A 30-fold excess of derivative DNA was then combined with the antibody and allowed to react for 2 h at room temperature followed by overnight incubation at 4 °C. Noncoupled DNAs were removed by FPLC with Pharmacia Superdex 200 gel filtration column (GE) at 0.5 mL/min isocratic flow of 1× PBS. The conjugates were then concentrated to 0.5 mg/mL by Amicon Ultra-4 Centrifugal Filter Unit with Ultracel-10 membrane (Millipore 10 kDa) and stored at 4 °C. The conjugation yield was determined by protein BCA assay with Nanodrop 2000C (Thermo Scientific).
Microchip Fabrication.
The SCBCs were assembled with a glass slide patterned with DNA barcode microarrays and a two-layer PDMS microfluidic device. The DNA barcode microarray was patterned by the microchannel-guided flow patterning technology (8). The PDMS chips for DNA patterning were fabricated by soft lithography. The master mold for the PDMS chips was prepared by SU-8 2015 negative photoresist. The mold has long meandering channel lines with 20 and 35 μm in width and height, respectively. The mixture of Sylgard 184 PDMS (Corning) prepolymer and curing agent in 10:1 ratio (wt/wt) was poured onto the mold, degassed in a homemade vacuum chamber, and cured at 80 °C for 1 h. The cured PDMS slab was released from the mold, inlet/outlet holes punched, and bonded onto a poly-l-lysine (PLL)-coated glass slide (Thermo Scientific) to form enclosed channels. The number of microfluidic channels determines the size of the barcode array, and six parallel microchannels were used in this study. The PDMS microfluidic chip for the cell experiment was fabricated using a two-layer soft lithography approach. The control layer was molded from a SU-8 2025 negative photoresist (∼40 μm in thickness) silicon master using a mixture of Sylgard 184 PDMS prepolymer part A and part B (10:1). The flow layer was fabricated by spin-casting the prepolymer of Sylgard PDMS part A and part B (20:1) onto a SPR 220 positive photoresist master at ∼2,000 rpm for 1 min (PWM50, Headway Research, Inc.). The SPR 220 mold was ∼18 μm in height after rounding via thermal treatment. The PDMS part for control layer was then carefully aligned and placed onto the flow layer, which was still situated on its silicon master mold. An additional 60-min thermal treatment at 80 °C was performed to enable bonding. Afterward, this two-layer PDMS chip was cut off and access holes were punched. Finally, the two-layer PDMS slab was thermally bonded onto the barcode-patterned glass slide to yield a fully assembled microchip.
DNA Barcode Chip Patterning and Validation.
DNA barcode patterns are prepared as described elsewhere (7, 8) with slight modifications. After bonding of PDMS device to the PLL slide, 0.1% PLL solution (Sigma-Aldrich) flowed through the channels followed by air blow dry. Then a library of 5′-amine modified ssDNA was dissolved in a mixture of DMSO and deionized water (vol/vol = 2:3) with a final concentration of 300 μM and mixed with a 2 mM PBS solution of BS3 linker (Thermo Fisher) at 1:1 ratio (vol/vol). A library of freshly prepared DNA solutions were flowed into different channels, and the assembly was incubated at room temperature for 2 h. The glass slide was then separated from the PDMS slab and washed with 0.02% SDS solution and water. Each DNA barcode slide was validated before bonding to the single-cell assay chip. A small area close to the edge was validated to check the DNA loading and uniformity. To do this, fluorescent Cy3-labeled cDNA mixture in 1% BSA (Sigma-Aldrich) in 1× PBS (Irvine Scientific) were hybridized for 1 h. After washing three times with 1% BSA/PBS and PBS, the slide was dried by nitrogen gun and scanned by Axon GenePix 4400A. Under laser power of 15% and gain of 450, fluorescence intensity above 30,000 was acceptable for cytoplasmic protein detection at the single-cell level.
Operation of the SCBC Devices.
Conversion of the DNA barcodes to capture antibody microarrays.
A mixture of DNA-encoded antibody conjugates in a BSA solution [1.5% (wt/vol) in 1× PBS] was flowed into the channels and incubated at 37 °C for 1 h to convert the DNA barcodes into antibody microarrays. The unbound conjugates were then washed off by 1× PBST (Cell Signaling; 0.05% Tween 20) and the channels were then blocked with a BSA (1% in 1× PBST) solution for 1 h.
Cell loading and incubation.
The channel surfaces were treated with laminin solution (0.075 mg/mL in 1× PBS) under flowing condition for 1 h followed by brief rinsing with cell culture medium. Simultaneously, U87EGFR cells are trypsinized and prepared as single-cell suspension at a concentration of 106 cells per mL The suspension was loaded into the SCBC device and compartmentalized into 2,640 isolated microchambers with single cell or defined number of cells in each chamber. The cell-loading step results in a random distribution of different numbers of cells in different chambers. The statistical distribution can be adjusted by varying the loading concentration and the flow speed. The images of each chamber were recorded using a microscope–CCD camera (Olympus IX81) over an 8-h period at 2-h intervals. After the incubation, the cells were quickly flushed away by 1× PBST.
Applying the detection mixture.
A mixture of biotin-labeled detection antibodies and Alexa Fluor 647-labeled streptavidin was prepared in BSA solution (1% in 1× PBST) and flowed into the device for 60 min to develop the proteins captured into fluorescence signal.
Rinse and fluorescence readout.
The channels were washed with 1× PBST for 30 min. The barcode slide was then peeled off from the PDMS slab, washed sequentially with 1× PBS, 0.5× PBS, and Millipore water, dried by a VWR Miniarray microcentrifuge, and scanned by an Axon GenePix 4400A at laser power 50% (635 nm) and 10% (532 nm), and at 2.5 μm/pixel resolution. Signals from two-color channels were collected and digitized by the manufacturers’ software.
Data analysis.
The resultant digitized signals from the images were used to analyze the level of the secreted proteins. The analysis of the acquired optical images of cells in each chamber was done with ImageJ (NIH) and a custom algorithm, written in MATLAB (MathWorks). Coordinates of each individual cells were tracked for all of the time points, and the cell–cell distance as well as distance traveled by cells were matched with the secreted protein signals for the analysis.
Acknowledgments
We acknowledge helpful discussions with Dr. David A. Nathanson and Lisa Ta. This work was funded by National Cancer Institute Grant 1U54CA199090-01 [to J.R.H., principal investigator (PI)], the Ben and Catherine Ivy Foundation (J.R.H.), the Jean Perkins Foundation (J.R.H., PI), the Korean-American Scientists and Engineers Association (Y.S.S., PI), the Phelps Family Foundation (Y.S.S.), and European Commission FP7 Future and Emerging Technologies–Open Project BAMBI 618024 (to R.D.L.). N.K.-B. was supported by an EMBO postdoctoral fellowship.
Footnotes
The authors declare no conflict of interest.
This article is a PNAS Direct Submission.
This article contains supporting information online at www.pnas.org/lookup/suppl/doi:10.1073/pnas.1602171113/-/DCSupplemental.
References
- 1.Lodish H, et al. Molecular Cell Biology. 4th Ed W. H. Freeman; New York: 2000. [Google Scholar]
- 2.Hu B, Chen W, Rappel WJ, Levine H. Physical limits on cellular sensing of spatial gradients. Phys Rev Lett. 2010;105(4):048104. doi: 10.1103/PhysRevLett.105.048104. [DOI] [PMC free article] [PubMed] [Google Scholar]
- 3.Levine H, Rappel WJ. The physics of eukaryotic chemotaxis. Phys Today. 2013;66(2):24–30. doi: 10.1063/PT.3.1884. [DOI] [PMC free article] [PubMed] [Google Scholar]
- 4.Alon U, Surette MG, Barkai N, Leibler S. Robustness in bacterial chemotaxis. Nature. 1999;397(6715):168–171. doi: 10.1038/16483. [DOI] [PubMed] [Google Scholar]
- 5.Alberts B, et al. Cell Motility in Cancer Invasion and Metastasis Molecular Biology of the Cell. Garland Science; New York: 2002. [Google Scholar]
- 6.Wang J, et al. Quantitating cell-cell interaction functions with applications to glioblastoma multiforme cancer cells. Nano Lett. 2012;12(12):6101–6106. doi: 10.1021/nl302748q. [DOI] [PMC free article] [PubMed] [Google Scholar]
- 7.Shin YS, et al. Protein signaling networks from single cell fluctuations and information theory profiling. Biophys J. 2011;100(10):2378–2386. doi: 10.1016/j.bpj.2011.04.025. [DOI] [PMC free article] [PubMed] [Google Scholar]
- 8.Shin YS, et al. Chemistries for patterning robust DNA microbarcodes enable multiplex assays of cytoplasm proteins from single cancer cells. ChemPhysChem. 2010;11(14):3063–3069. doi: 10.1002/cphc.201000528. [DOI] [PMC free article] [PubMed] [Google Scholar]
- 9.Shi Q, et al. Single-cell proteomic chip for profiling intracellular signaling pathways in single tumor cells. Proc Natl Acad Sci USA. 2012;109(2):419–424. doi: 10.1073/pnas.1110865109. [DOI] [PMC free article] [PubMed] [Google Scholar]
- 10.Kravchenko-Balasha N, Wang J, Remacle F, Levine RD, Heath JR. Glioblastoma cellular architectures are predicted through the characterization of two-cell interactions. Proc Natl Acad Sci USA. 2014;111(17):6521–6526. doi: 10.1073/pnas.1404462111. [DOI] [PMC free article] [PubMed] [Google Scholar]
- 11.Mellinghoff IK, et al. Molecular determinants of the response of glioblastomas to EGFR kinase inhibitors. N Engl J Med. 2005;353(19):2012–2024. doi: 10.1056/NEJMoa051918. [DOI] [PubMed] [Google Scholar]
- 12.Lipscomb CE. Medical Subject Headings (MeSH) Bull Med Libr Assoc. 2000;88(3):265–266. [PMC free article] [PubMed] [Google Scholar]
- 13.Lu Y, et al. High-throughput secretomic analysis of single cells to assess functional cellular heterogeneity. Anal Chem. 2013;85(4):2548–2556. doi: 10.1021/ac400082e. [DOI] [PMC free article] [PubMed] [Google Scholar]
- 14.Nelson DL, Lehninger AL, Cox MM. Lehninger Principles of Biochemistry. 5th Ed W. H. Freeman; New York: 2008. [Google Scholar]
- 15.Levine RD. An information theoretical approach to inversion problems. J Phys Math Gen. 1980;13(1):91–108. [Google Scholar]
- 16.Levine RD. Molecular Reaction Dynamics. Cambridge Univ Press; Cambridge, UK: 2005. [Google Scholar]
- 17.Levine RD, Bernstein RB. Energy disposal and energy consumption in elementary chemical reactions. Information theoretic approach. Acc Chem Res. 1974;7(12):393–400. [Google Scholar]
- 18.Kravchenko-Balasha N, et al. Convergence of logic of cellular regulation in different premalignant cells by an information theoretic approach. BMC Syst Biol. 2011;5:42. doi: 10.1186/1752-0509-5-42. [DOI] [PMC free article] [PubMed] [Google Scholar]
- 19.Remacle F, Kravchenko-Balasha N, Levitzki A, Levine RD. Information-theoretic analysis of phenotype changes in early stages of carcinogenesis. Proc Natl Acad Sci USA. 2010;107(22):10324–10329. doi: 10.1073/pnas.1005283107. [DOI] [PMC free article] [PubMed] [Google Scholar]
- 20.Dieterich P, Klages R, Preuss R, Schwab A. Anomalous dynamics of cell migration. Proc Natl Acad Sci USA. 2008;105(2):459–463. doi: 10.1073/pnas.0707603105. [DOI] [PMC free article] [PubMed] [Google Scholar]
- 21.Stokes CL, Lauffenburger DA, Williams SK. Migration of individual microvessel endothelial cells: Stochastic model and parameter measurement. J Cell Sci. 1991;99(Pt 2):419–430. doi: 10.1242/jcs.99.2.419. [DOI] [PubMed] [Google Scholar]
- 22.McQuarrie DA. Statistical Mechanics. 1st Ed University Science Books; Sausalito, CA: 2000. [Google Scholar]
- 23.Gardiner C. 2009. Stochastic Methods: A Handbook for the Natural and Social Sciences. Springer Series in Synergetics (Springer, Berlin), 4th Ed.
- 24.Roycroft A, Mayor R. Forcing contact inhibition of locomotion. Trends Cell Biol. 2015;25(7):373–375. doi: 10.1016/j.tcb.2015.05.001. [DOI] [PMC free article] [PubMed] [Google Scholar]
- 25.Kravchenko-Balasha N, et al. On a fundamental structure of gene networks in living cells. Proc Natl Acad Sci USA. 2012;109(12):4702–4707. doi: 10.1073/pnas.1200790109. [DOI] [PMC free article] [PubMed] [Google Scholar]
- 26.Procaccia I, Levine RD. Potential work: A statistical-mechanical approach for systems in disequilibrium. J Chem Phys. 1976;65(8):3357–3364. [Google Scholar]
- 27.Mayer JE, Mayer MG. Statistical Mechanics. 2nd Ed Wiley; New York: 1977. [Google Scholar]
- 28.McMillan WG, Mayer JE. The statistical thermodynamics of multicomponent systems. J Chem Phys. 1945;13(7):276–305. [Google Scholar]


