Significance
Glioblastoma multiforme (GBM) is the most malignant brain tumor. The recurrence or chemoresistance of GBM is attributed to the presence of cancer stem cells (CSCs). Although many studies indicate that CD133 protein is a biomarker for GBM CSC (GSC) enrichment, CD133 is not specific for GSCs and is also present on cancer cells. In this study, we report that ganglioside D3 (GD3) is not only an alternative marker but also an additional marker to CD133 for the identification and enrichment of GSCs. We further prove that the properties of CSCs in GBM are suppressed when GD3 synthase is inhibited, supporting GD3 as a GBM stem cell marker and a promising therapeutic target for GBM treatment.
Keywords: GBM, ST8SIA1, gangliosides, glycosphingolipids, cancer stem cells
Abstract
The cancer stem cells (CSCs) of glioblastoma multiforme (GBM), a grade IV astrocytoma, have been enriched by the expressed marker CD133. However, recent studies have shown that CD133− cells also possess tumor-initiating potential. By analysis of gangliosides on various cells, we show that ganglioside D3 (GD3) is overexpressed on eight neurospheres and tumor cells; in combination with CD133, the sorted cells exhibit a higher expression of stemness genes and self-renewal potential; and as few as six cells will form neurospheres and 20–30 cells will grow tumor in mice. Furthermore, GD3 synthase (GD3S) is increased in neurospheres and human GBM tissues, but not in normal brain tissues, and suppression of GD3S results in decreased GBM stem cell (GSC)-associated properties. In addition, a GD3 antibody is shown to induce complement-dependent cytotoxicity against cells expressing GD3 and inhibition of GBM tumor growth in vivo. Our results demonstrate that GD3 and GD3S are highly expressed in GSCs, play a key role in glioblastoma tumorigenicity, and are potential therapeutic targets against GBM.
Glioblastoma multiforme (GBM) is extremely infiltrative and difficult to treat, and most patients develop recurrence after therapy. Over the past decade, many studies have suggested that bulk GBM tumors harbor cancer stem cells (CSCs) (1, 2), a distinct subpopulation of cancer cells that are able to initiate new tumors efficiently, have long-term self-renewal capacity, and survive better against chemo- or radiotherapy (2–4). CD133 has become a widely used marker for the enrichment of GBM CSCs (GSCs) and other tumor types (5–10). However, recent studies have shown that CD133 is not specific for GSCs because CD133− cells also possess tumor-initiating potential (11–13), indicating the need to identify more specific and exclusive markers for GSCs to facilitate our understanding of GSCs and therapeutic development against GBM. Several reports have proposed L1CAM, A2B5, integrin α6, MET, and CD15 as markers for GSCs (14–18). However, none of these protein markers could be used specifically to identify GSCs, and no study was reported with respect to glycans as potential markers, although glycan biosynthesis involves multiple genes and it is possible to create different structures in cancer progression. It is noted that ganglioside D2 (GD2) and ganglioside D3 (GD3) were found on the surface of neural stem cells (NSCs) and that stage-specific embryonic antigen 3 (SSEA3) and SSEA4 were found on embryonic stem cells and cancer cells (19–21), but there is no glycan marker found on the surface of GSCs.
Gangliosides are sialic acid-containing glycosphingolipids (GSLs) that are most abundant in the nervous system (22). The expression levels and patterns of gangliosides during brain development shift from simple gangliosides, such as GM3 and GD3, to complex gangliosides, such as GM1, GD1a, GD1b, and GT1b (23, 24). Moreover, several unique ganglioside markers, including SSEA3, SSEA4, GD2, and GD3, have been identified in stem cells (19). GD3, a b-series ganglioside containing two sialic acids, is highly expressed in mouse and human embryonic NSCs (20, 25). In cancers, GD3 is highly accumulated in human primary melanoma tissues as well as in established melanoma cell lines (26), whereas human normal melanocytes express no or minimal levels of GD3 (27). Moreover, malignant gliomas contain higher levels of GD3, and its expression correlates with the degree of malignancy (28). GD3 is produced from the precursor GM3 by the activity of GD3 synthase (GD3S), which mediates the properties of CSCs through the c-MET signaling pathway and correlates with poor prognosis in triple-negative human breast tumors (29). These findings suggest that GD3 may play an important role in the transformation of normal cells into tumors, and imply that GD3 could be a cell surface marker for GSCs.
This study was designed to identify glycan markers for the enrichment of GBM stem cells and then uses these enriched GBM stem cells to characterize tumorigenicity, their association with clinical GBM specimens, and their regulation in tumor progression. The results showed that GD2 and GD3 were positively stained on GBM neurospheres. We found that cells with high GD3 expression display functional characteristics of GSCs. Suppression of GD3S, a critical enzyme for GD3 synthesis, impeded neurosphere formation and tumor initiation. The expression of GD3S correlated with the grades of astrocytomas and mediated self-renewal through c-Met activation. Furthermore, a GD3 antibody was found to eliminate the GD3+ cells through complement-dependent cytotoxicity (CDC) in vitro and to suppress tumor growth in mice. These results suggest that GD3 could be a significant biomarker for GSCs, that CD3 could be combined with CD133 for the enrichment of GSCs, and that both GD3 and GD3S could be targets for the development of new therapies against GBM.
Results
Expression Levels of Glycan Epitopes Are Evaluated on GBM Cells and Neurospheres.
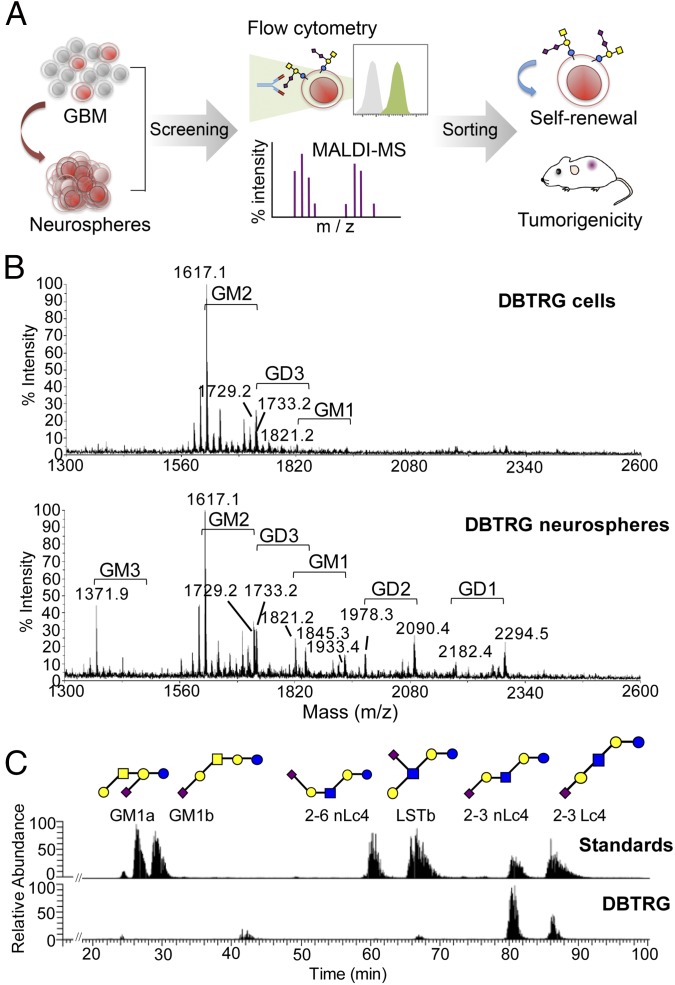
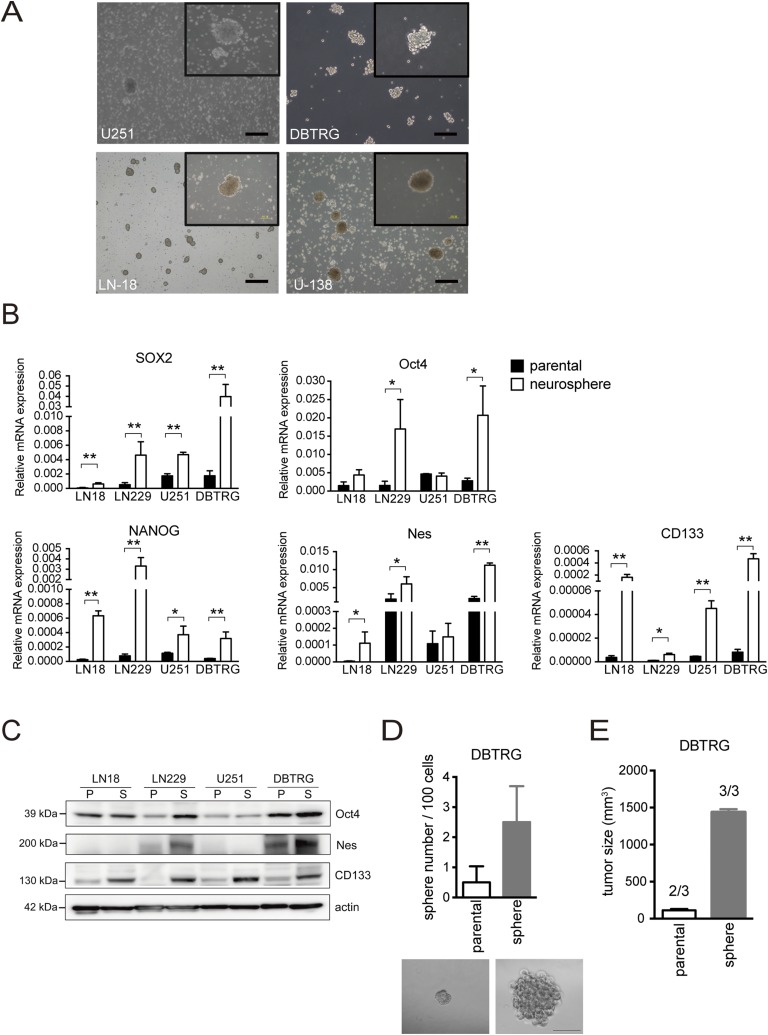
We enriched GBM stem-like cells in a serum-free medium containing EGF and basic FGF (30) to generate neurospheres in four human GBM cell lines: LN18, U251, DBTRG, and LN229 (Fig. 1A and Fig. S1A). All GBM neurospheres were examined for GSC characteristics. The mRNA expression levels of stemness genes (SOX2, Oct4, NANOG, and NES) and the reported marker CD133 were dramatically increased in GBM neurospheres (Fig. S1B). The protein expression levels of Oct4, NES, and CD133 were also highly increased in GBM neurospheres compared with parental cells (Fig. S1C). Moreover, the cells dissociated from DBTRG neurospheres showed an increased number of neurospheres compared with parental cells (Fig. S1D) and powerful tumor growth and tumor initiation ability in immunodeficient mice (three tumors generated in three mice) (Fig. S1E). These results suggested that the established culture system for enriched stem-like cells showed GSC properties in vitro and in vivo.
Fig. 1.
Profiling and discovery of glycan markers for GBM stem cells. (A) Glycan-related molecules specifically expressed in GBM neurospheres (stem-like cells) were screened and verified by flow cytometry and MS, respectively. The cells carrying these specific glycan markers were enriched from GBM xenograft tumors and further examined for their abilities of self-renewal and tumorigenicity in vivo. (B) Extracted gangliosides from DBTRG cells and neurospheres were permethylated and analyzed by MALDI-MS. The major ganglioside in DBTRG cells was GM2 (m/z = 1,617.0), whereas the most predominant complex gangliosides in DBTRG neurospheres were GM3 (m/z = 1,371.9), GM2 (m/z = 1,617.1), GM1 (m/z = 1,821.2), GD1 (m/z = 2,294.5), GD3 (m/z = 1,733.2), and GD2 (m/z = 2,090.4). Gangliosides with the same glycan moiety but with different fatty acyl contents are bracketed. (C) Isomeric structures of GM1 in DBTRG cells were separated by a porous graphitized carbon LC-MS–based platform. The major gangliosides include 2-3 sialyl lactotetraose (Lc4) (21.4%), 2-3 sialyl neolactotetraose (nLc4) (70.6%), and a small amount of sialyl-lacto-N-tetraose b (LSTb) (4%) and GM1a (4%). Monosaccharide symbols were used as follows: yellow circle, galactose; blue circle, glucose; yellow square, N-acetylgalactosamine; blue square, N-acetylglucosamine; purple diamond, N-acetylneuraminic acid.
Fig. S1.
Characteristics of GSCs in an established neurosphere culture system. (A) Morphology of neurospheres was observed in four GBM cells. (Magnification: Inset, 100×. Scale bars, 100 μm.) (B) mRNA expression levels of SOX2, Oct4, NANOG, NES, and CD133 were examined by Q-PCR. Data are the mean ± SD of three independent experiments. (C) Protein expression of Oct4, NES, and CD133 was detected by Western blotting. P, parental cells; S, neurosphere. (D) Ability of self-renewal was evaluated by neurosphere formation. (Scale bar, 100 μm.) The mean ± SD for each group (n = 10) is shown. (E) Tumor growth and tumor initiation ratio for 10,000 parental cells and neurospheres were assayed in immunodeficient mice (n = 3 mice per group). The P value between groups was determined by an unpaired Student’s t test. *P < 0.05; **P < 0.01.
GD2 and GD3 Are Expressed at High Levels in Various GBM Neurospheres.
After the neurosphere system was established, we profiled the glycan-related molecules by flow cytometry and MALDI-MS (Fig. 1A). To check the expression levels of glycan epitopes, antibody staining was conducted and analyzed by flow cytometry on five GBM cell lines: LN18, U138MG, U251, DBTRG, and G5T. The glycan epitopes stained were gangliosides (GM3, GM2, GM1, GD1a, GD3, GD2, GT1b, and A2B5), Lewis antigens [Lex, sialyl Lex (sLex), and Ley], globoseries GSLs (SSEA-3, SSEA-4, and Globo H), O-linked glycans [Thomsen–Friedenreich antigen (TF), Tn, and sialyl Tn (sTn)], and stem cell-associated glycoproteins (Table S1). High levels of SSEA4 were observed on most GBM parental cells, but decreased on GBM neurospheres. SSEA3 staining was positive on LN18, U138MG, and G5T parental cells, but weak on their neurospheres, and VK9 (anti-Globo H) staining was negative on GBM cells. Both GBM parental cells and neurospheres showed high levels of TF, Tn, Lex, and Ley; a low level of sLex; and no sTn. The levels of CD44 and CD90 were abundant on both GBM cells and neurospheres, but CD24 was low on neurospheres and only DBTRG neurospheres displayed CD133 staining. With respect to gangliosides, GBM parental cells and neurospheres showed high levels of GM2, GM1, GD1a, and GT1b and a low level of GM3 and A2B5. Moreover, GD3 and GD2 staining intensity was low on GBM parental cells, but high on GBM neurospheres (Table S1).
Table S1.
Expression profiles of glycan-related molecules in GBM parental cells and neurospheres
| LN18 | U138MG | U251 | DBTRG | G5T | ||||||
| Antibody | Parental | Sphere | Parental | Sphere | Parental | Sphere | Parental | Sphere | Parental | Sphere |
| GM3 | ++ | + | ++ | + | − | − | − | − | − | − |
| GM2 | +++ | +++ | ++++ | ++++ | ++++ | +++ | ++++ | ++ | ++ | ++ |
| GM1 | +++ | +++ | ++++ | ++++ | ++++ | +++ | ++++ | ++ | ++ | ++ |
| GD1a | ++++ | ++++ | ++++ | ++++ | ++++ | ++++ | ++++ | +++ | + | +++ |
| GD3 | + | ++ | − | + | − | ++ | − | ++ | − | +++ |
| GD2 | + | +++ | − | + | − | ++ | − | ++++ | − | +++ |
| GT1b | ++++ | ++++ | ++++ | ++++ | ++ | ++ | N.D. | N.D. | + | + |
| A2B5 | ++ | ++ | ++ | ++ | + | + | + | + | + | + |
| LeX | − | − | − | + | +++ | ++ | N.D. | +++ | +++ | +++ |
| sLeX | − | − | − | − | ++ | − | N.D. | N.D. | − | − |
| LeY | ++ | + | − | + | ++ | +++ | N.D. | N.D. | − | ++ |
| TF | +++ | + | ++ | ++ | + | +++ | N.D. | N.D. | − | + |
| Tn | +++ | ++ | + | ++ | ++ | + | N.D. | N.D. | + | + |
| sTn | − | − | + | ++ | − | − | N.D. | N.D. | − | − |
| SSEA3 | ++ | + | ++ | − | − | − | − | − | ++++ | +++ |
| SSEA4 | ++++ | + | ++++ | + | +++ | − | ++++ | ++ | ++++ | ++++ |
| Globo H | + | − | − | − | − | − | − | − | − | − |
| CD44 | ++++ | ++++ | ++++ | ++++ | ++++ | ++++ | ++++ | ++++ | ++++ | ++++ |
| CD24 | ++ | + | + | − | + | − | +++ | + | ++++ | + |
| CD90 | ++++ | ++++ | ++++ | ++++ | ++++ | ++++ | ++ | ++ | ++++ | ++++ |
| CD133 | − | − | − | − | − | − | − | + | − | − |
The intensity of glycan-related molecules was determined by flow cytometry as described in Materials and Methods. The symbols represent the percentage of positive cells in total cells: −, positive cells < 2.5%; +, 2.5% < positive cells < 25%; ++, 25% < positive cells < 50%; +++, 50% < positive cells < 75%; ++++, positive cells > 75%. N.D., not determined.
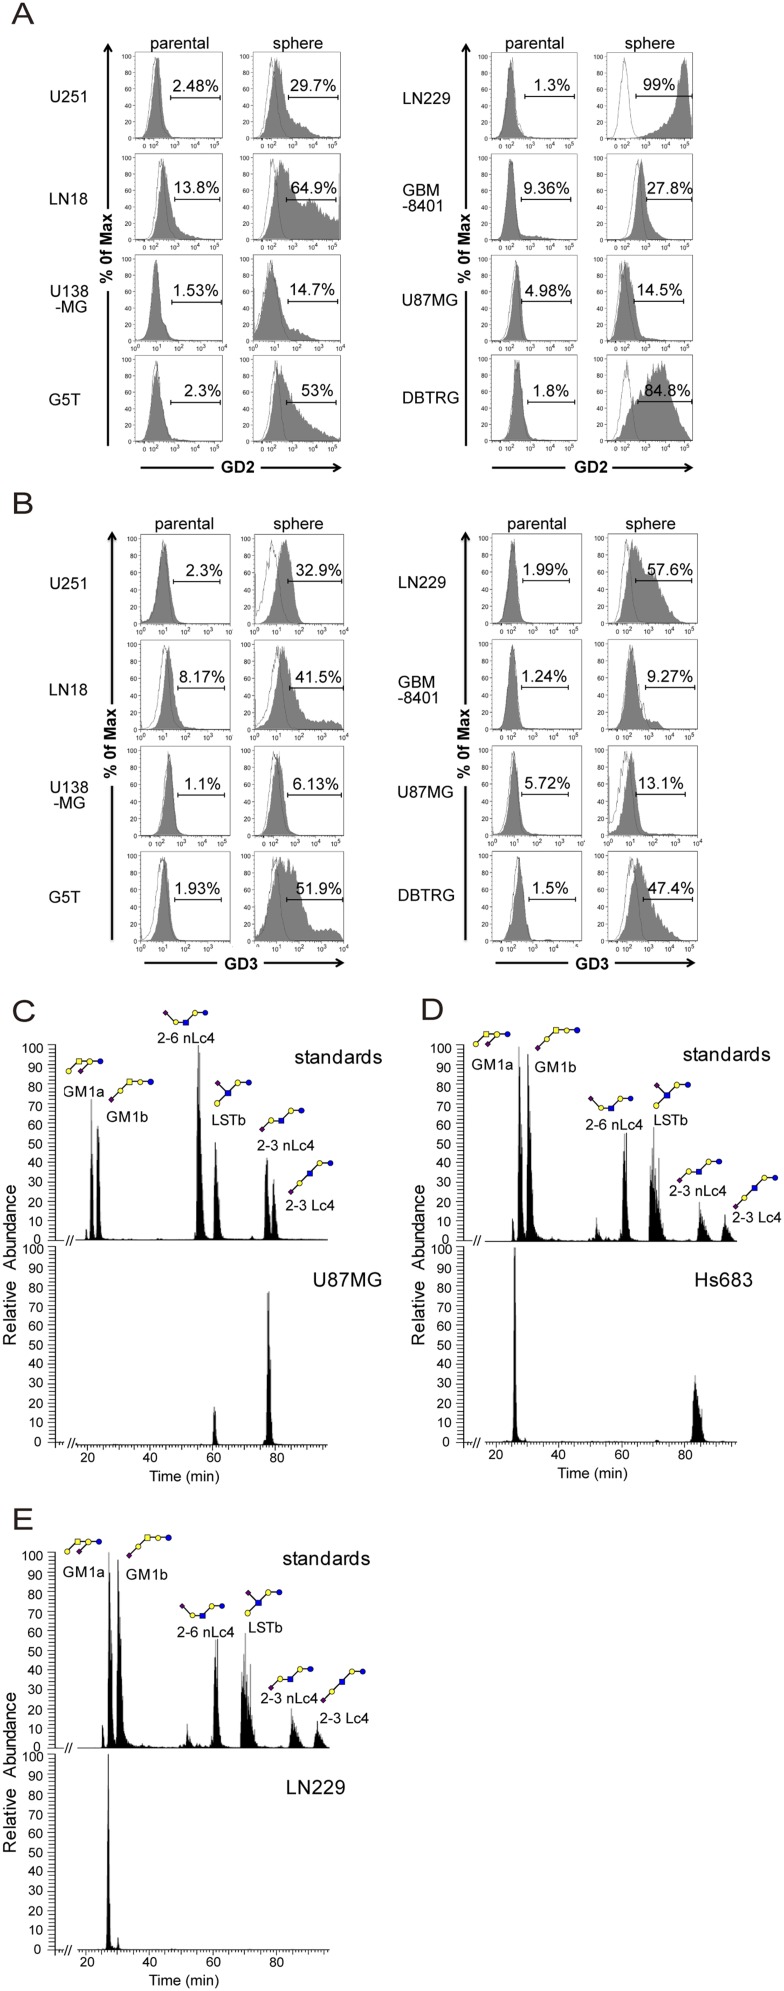
Because antibodies were not available for every ganglioside staining, we analyzed the ganglioside profile from DBTRG cells and DBTRG neurospheres by MALDI-MS (Fig. 1B). Two ceramide isoforms with differences in the sphingosine moiety (C16:0 and C24:0) were commonly detected in human tissues. The respective ganglioside profiles were thus assigned based on the m/z values of the major molecular ions, adjusted with the permethylation of hexose (Hex), N-acetylhexosamine, or N-acetylneuraminic acid residues. The MS profiles showed that the major species of gangliosides on DBTRG cells was GM2, whereas the most predominant complex gangliosides on DBTRG neurospheres were GM3, GM2, GM1, GD1, GD3, and GD2 (Fig. 1B). The result was consistent with the expression profile of various gangliosides determined by flow cytometry using different antiganglioside antibodies (Table S1). Based on these findings, we further examined the levels of gangliosides on additional GBM parental cells and neurospheres by flow cytometry, and found that GD3 and GD2 expression levels were negative or low on all GBM parental cells, but were relatively high on most of the GBM neurospheres (Fig. S2 A and B).
Fig. S2.
GD3 and GD2 expression analysis by flow cytometry and GM1 isomer analysis by porous graphitized carbon LC-MS. (A and B) GBM parental cells and neurospheres were stained with GD3 or GD2 antibody, and the staining intensity was analyzed by flow cytometry. The histograms of the cells stained with GD3 (or GD2) and isotype control are shown in gray and white, respectively. (C) GM1 isomers of U87 cells were mainly composed of 2-3 sialyl neolactotetraose (nLc4) (87%) and sialyl-lacto-N-tetraose b (LSTb) (13%). (D) GM1 isomers of Hs683 cells consisted of 2-3 sialyl nLc4 (75%) and GM1a (25%). (E) The only GM1 isomer expressed on LN229 cells was GM1a. Monosaccharide symbols were used as follows: yellow circle, galactose; blue circle, glucose; yellow square, N-acetylgalactosamine; blue square, N-acetylglucosamine; purple diamond, N-acetylneuraminic acid.
Isomeric Structures of GM1 and Their Distribution.
Of the gangliosides examined, GM1 exists as a mixture of structural isomers and could not be distinguished by MALDI-MS or reverse-phase liquid chromatography (LC)-MS alone and by existing antibodies. We therefore developed a method based on porous graphitized carbon LC-MS (31) to separate the isomers in positive ion mode, which were structurally confirmed and quantified by collision-induced dissociation (CID) MS/MS fragmentation and peak area. Fig. 1C shows a representative demonstration of this method used in the identification of GM1 isomers in DBTRG cells. The GM1 isomers of DBTRG cells are composed of mostly 2-3 sialyl lactotetraose (Lc4) (21.4%), 2-3 sialyl neolactotetraose (nLc4) (70.6%), and small quantity of sialyl-lacto-N-tetraose b (LSTb) (4%) and GM1a (4%). With this method established, it was found that the ratio of GM1 isomers differs from one cell to another and could serve as a characteristic fingerprint of individual cell types. On the contrary, GD3 and GD2 have no isomers found, and their structures could be unambiguously confirmed by both MS and existing antibodies. This platform was also applied to other GBM cells (Fig. S2 C–E).
GD3 and CD133 as Markers for the Enrichment of GSCs.
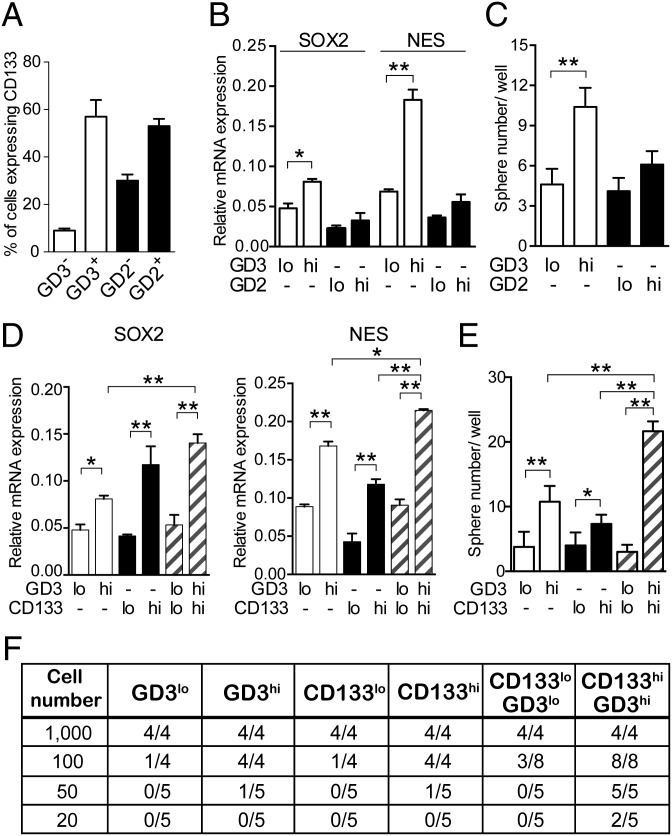
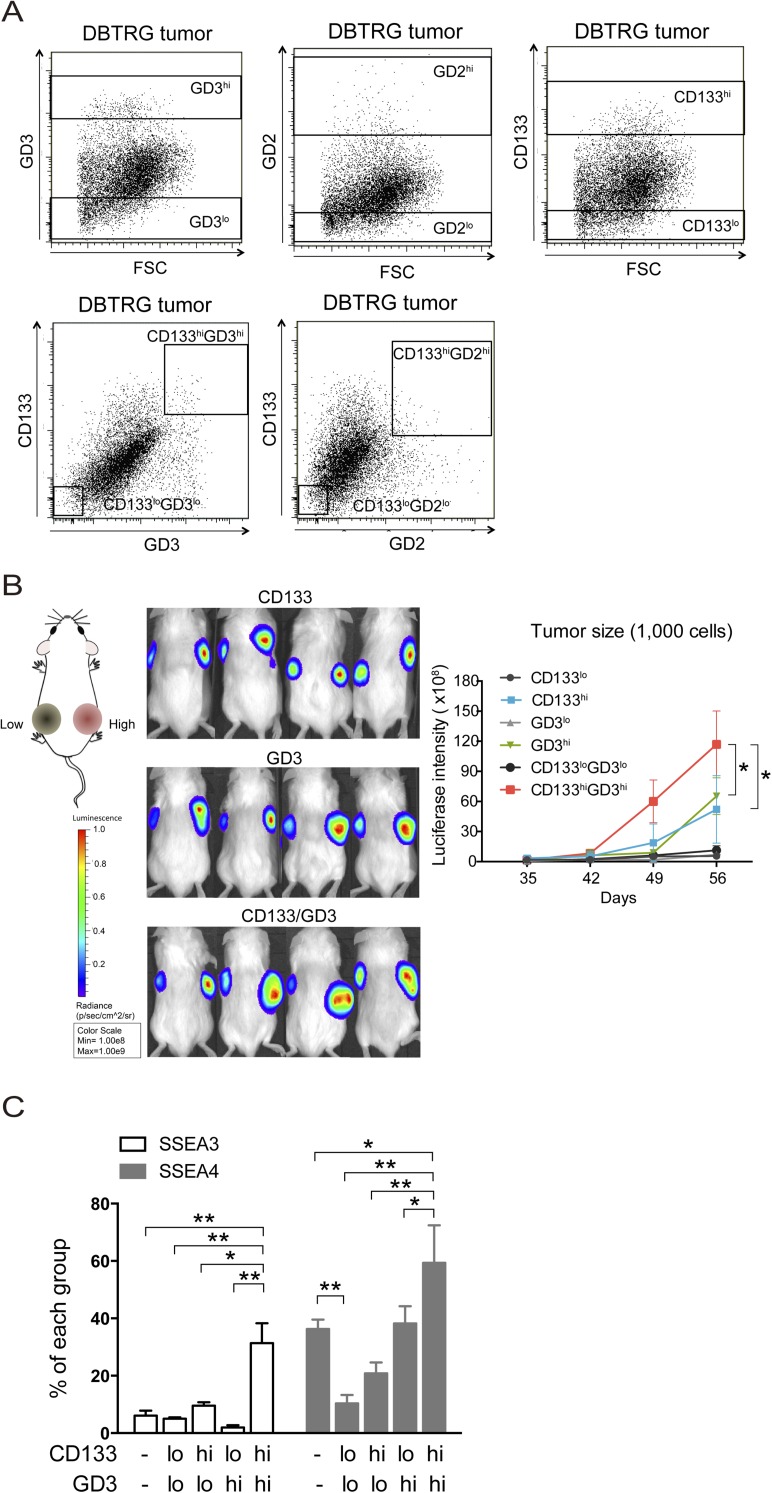
We dissociated the cells with GD3 and related markers from DBTRG xenograft tumors that were inoculated in immunodeficient mice. To investigate the correlation between GD3 (or GD2) and CD133 expression, we first analyzed the expression levels of CD133 in GD3+ or GD2+ tumor cells. More than 57% of GD3+ tumor cells displayed high CD133 signals, and less than 10% of GD3− tumor cells showed low CD133 signals, whereas 53% of GD2+ tumor cells and 30% of GD2− tumor cells were positive for CD133, suggesting that GD3 expression positively correlated with CD133 expression (Fig. 2A). Based on the expression levels of the isotype control, we gated and separated the tumor cells into GD3lo, GD3hi, GD2lo, and GD2hi cells (Fig. S3A), and it was found that GD3hi cells also expressed high levels of the stemness genes SOX2 and NES, and generated more neurospheres than GD2hi cells (Fig. 2 B and C). We further investigated the population of GD3hi cells vs. the population of CD133hi or GD3hiCD133hi cells with regard to the content of GSCs. GD3hi or CD133hi cells had higher expression levels of SOX2 and NES than GD3lo or CD133lo cells, and the cells with GD3hiCD133hi expression exhibited higher expression levels of stemness genes than GD3hi or CD133hi cells (Fig. 2D). In addition, GD3hi or CD133hi cells formed spheres more efficiently than the corresponding GD3lo or CD133lo cells, and more neurospheres formed from GD3hi cells than from CD133hi cells (Fig. 2E). We also found that an increased number of neurospheres was observed in wells from CD133hiGD3hi cells, but not from CD133loGD3lo cells, and that CD133hiGD3hi cells showed a higher potential for self-renewal than GD3hi or CD133hi cells (Fig. 2E). To estimate the frequency of stem cells in vitro, a limiting dilution assay for neurosphere formation was also conducted and computed using the extreme limiting dilution analysis (ELDA) algorithm as described in Materials and Methods, and it was found that GD3hi or CD133hi cells required more than 10 cells to form one neurosphere, whereas only six CD133hiGD3hi cells were enough to form one neurosphere (Table S2). Taken together, these results demonstrated that GD3hiCD133hi cells are a better representative of GSCs because this population has self-renewal ability with expression of stemness genes and a higher propensity to form neurospheres.
Fig. 2.
GD3 identifies GSCs in GBM tumors. (A) DBTRG tumor cells were costained with anti-GD2, anti-GD3, and anti-CD133 antibodies. We calculated the percentage of cells expressing CD133 in GD2+, GD2−, GD3+, or GD3− cells. (B) Expression levels of SOX2 and NES were examined in sorted cells by quantitative PCR (Q-PCR). Results are shown as mean ± SD (n = 3). (C) Sphere formation assays were performed in sorted cells. The mean ± SD for each group (n = 10) is shown. (D) Q-PCR analyses of stemness genes were performed in tumor cells sorted by the indicated molecules. Results are shown as mean ± SD (n = 3). (E) Self-renewal potential of each subpopulation from DBTRG tumors was evaluated in neurosphere formation assays. Cells seeded at a density of 100 cells per well were represented, and data are shown as mean ± SD (n = 10). (F) In vivo limiting dilution assay of separated subpopulations derived from xenograft tumors was conducted in mice. The numbers of tumor cell-injected mice and tumor-bearing mice are shown (20–1,000 cells per mouse, n = 4 or n = 5 mice per group). The P value was determined by an unpaired Student’s t test between groups (B and C) and by one-way ANOVA for multiple comparisons (D and E). *P < 0.05; **P < 0.01.
Fig. S3.
Expression levels of various markers in tumor cells and the tumor growth of 1,000 cells carrying GD3 and CD133 markers. (A) Expression levels of GD3, GD2, and CD133 of DBTRG tumor cells are displayed in a dot blot. The rectangle indicates the sorting area for different molecules. (B) One thousand cells expressing firefly luciferase and the indicated low or high levels of CD133, GD3, and CD133/GD3 were injected into the left or right flanks of nonobese diabetic-scid IL2rγnull mice, respectively, and tumor growth was monitored by bioluminescence imaging (BLI) from 35 to 56 d. (Left) Graphical representation is the BLI intensity for mice injected with the indicated cells at 56 d. Data are the mean ± SD of tumors in four mice. (C) DBTRG tumor cells were costained with anti-SSEA3 (or anti-SSEA4), anti-GD3, and anti-CD133 antibodies. We calculated the percentage of cells expressing SSEA3 or SSEA4 in separated CD133 and GD3 cells. The mean ± SD for each group (n = 3) is shown. All P values between groups were determined by one-way ANOVA. *P < 0.05; **P < 0.01.
Table S2.
Neurosphere formation of tumor cells sorted by various expression levels of GD3 and CD133
| Marker | GD3lo | GD3hi | CD133lo | CD133hi | CD133loGD3lo | CD133hiGD3hi |
| Estimated frequency for sphere formation | 1/43 | 1/13 | 1/28 | 1/11 | 1/30 | 1/6 |
| Confidence intervals | 1/26–1/73 | 1/6–1/25 | 1/16–1/50 | 1/6–1/21 | 1/20–1/46 | 1/4–1/10 |
The self-renewal potentials of each subpopulation from DBTRG xenograft tumors were determined by in vitro limiting dilution neurosphere formation assays. Cells were plated into 96-well ultra-low attachment plates with various seeding densities (5–100 cells per well, n = 10 wells per group), and the frequency for neurosphere formation was calculated as described in Materials and Methods.
To evaluate the tumorigenicity of glycan molecule-enriched cells, we dissociated cells from tumors that were inoculated in immunodeficient mice, and then recapitulated the selected cells into immunodeficient mice for evaluation. By monitoring the luciferase activity, we analyzed the potential of tumor initiation and tumor growth. Using 1,000 cells per site, however, there were no significant differences in the tumor initiation ability among these six populations: GD3hi and CD133hi cells generated tumors faster than GD3lo and CD133lo cells, respectively, and CD133hiGD3hi cells showed the most effective tumor growth among these six populations (Fig. 2F and Fig. S3B). At the level of 50 cells per site, GD3hi, CD133hi, and CD133hiGD3hi cells generated more tumors at a higher frequency than GD3lo, GD3lo, and CD133loGD3lo cells, respectively, and CD133hiGD3hi cells generated tumors in all mice (five of five mice). Moreover, at the lower level of 20 cells per site, there were fewer CD133hiGD3hi cells required for tumor initiation (two of five mice bearing tumors) compared with the GD3hi or CD133hi population (none of five mice bearing tumors) (Fig. 2F). These data firmly demonstrated that the cells enriched by CD133 plus GD3 were capable of tumor initiation at a higher frequency than the cells with GD3 or CD133 only, suggesting that GD3 is a major determinant of GSCs.
Because SSEA3 and SSEA4 were specifically found on embryonic stem cells (19) and breast CSCs (32, 33), as well as on 15 different types of cancer cells, including GBM (21), but not on normal cells, we hypothesized that SSEA3 and SSEA4 would be highly expressed in our defined CD133hiGD3hi GSCs. We analyzed the expression of SSEA3 and SSEA4 in the sorted cell population using CD133 and GD3 as markers, and found that more than 31.3% of CD133hiGD3hi cells were SSEA3+ and 59.4% were SSEA4+, whereas less than 10% of CD133loGD3lo cells were positive for SSEA3 and SSEA4 (Fig. S3C). Moreover, SSEA3 or SSEA4 was highly expressed in CD133hiGD3hi cells compared with other divided cell populations.
GD3S Mediates GSC Characteristics.
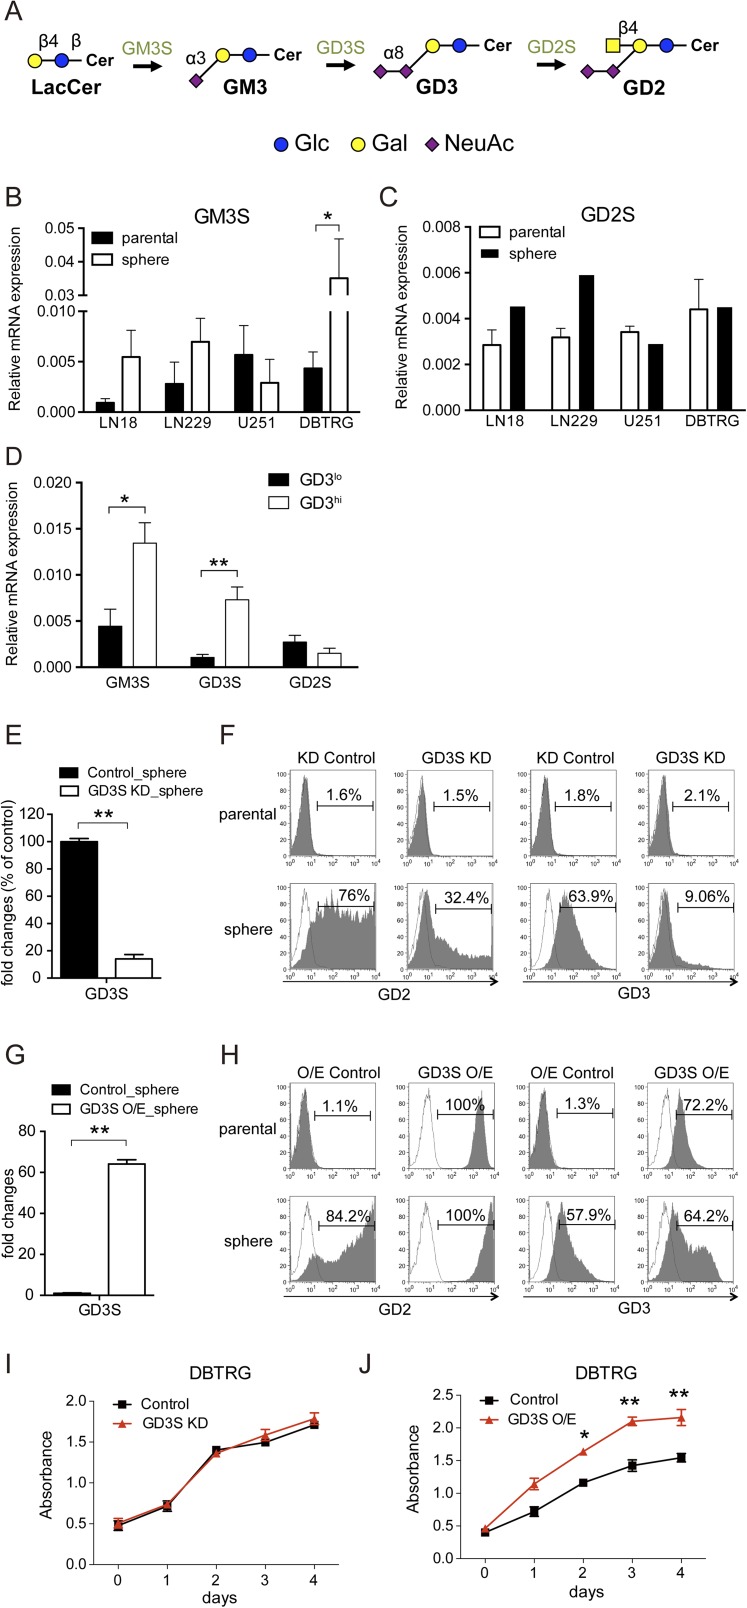
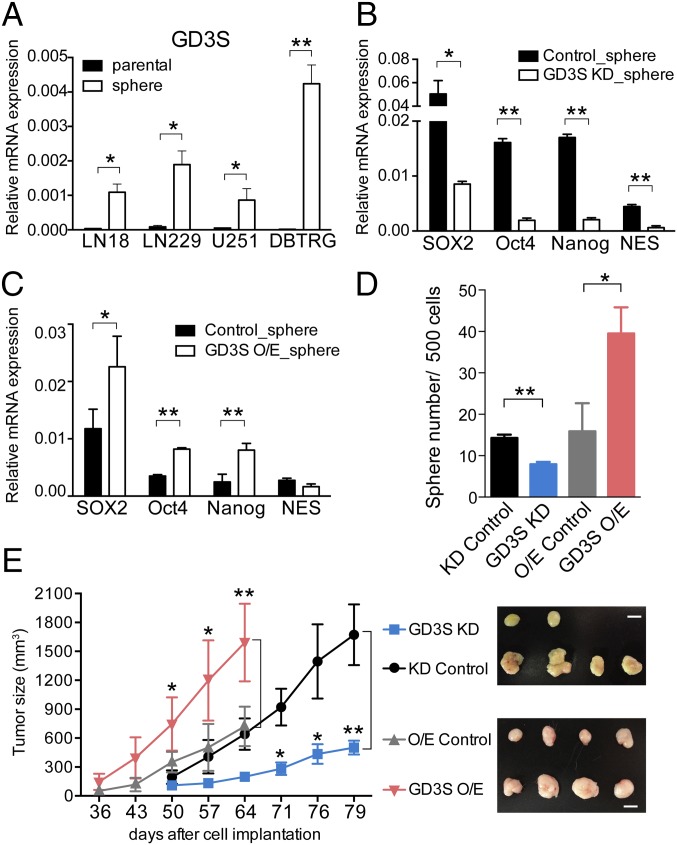
To understand the relationship between glycosyltransferases and GD3 expression, we analyzed the mRNA levels of GM3 synthase (GM3S, ST3GAL5), GD3S (ST8SIA1), and GM2/GD2 synthase (GD2S, B4GALNT1) individually in the parental cells and neurospheres. First, it was found that GM3S and GD3S, the enzymes involved in the conversion of lactosylceramide to GM3 and GM3 to GD3, respectively (Fig. S4A), were significantly up-regulated in neurospheres (Fig. 3A and Fig. S4B). In particular, GD3S was significantly up-regulated when GBM cells were cultivated into neurospheres, as shown by the cell lines LN18, LN229, U251, and DBTRG. GD2S was slightly increased in LN18 and LN229 neurospheres, whereas no changes in U251 and DBTRG neurospheres were observed (Fig. S4C). Interestingly, GD3hi cells exhibited the most abundant expression of GM3S and GD3S in fractionated GD3hi cells from DBTRG tumors (Fig. S4D). To investigate the functional role of GD3 in GSCs, we suppressed the expression of GD3S in DBTRG cells with a lentiviral shRNA expression vector or enhanced the expression of GD3S using a pcDNA3 expression vector. As expected, the GD3S knockdown (KD) showed no effect on parental cells with no detectable GD3, whereas the expression of GD3S and the percentage of GD3+ cells were significantly reduced from 63.9 to 9.06% in DBTRG neurospheres (Fig. S4 E and F). GD3S overexpression (O/E) cells displayed strong intensities of GD3S and GD3, and were further enhanced in neurospheres (Fig. S4 G and H). These results suggested that the expression level of GD3 is regulated by GD3S in GSCs. Interestingly, both GD3S KD and GD3S O/E caused the down- or up-regulated expression of stemness genes in neurospheres in comparison to parental cells (Fig. 4 B and C). In addition, suppression of GD3S inhibited neurosphere formation, but had no effect on parental cell growth (Fig. 3D and Fig. S4I). Adversely, O/E of GD3S increased neurosphere formation and promoted cell growth (Fig. 3D and Fig. S4J). Moreover, mice bearing GD3S shRNA cells showed significantly reduced tumor growth (Fig. 3E) and tumor formation (Table S3). Even after 20 wk, 10,000 GD3S shRNA cells had no tumor formation, whereas the control shRNA cells generated tumors in two of four mice. Adversely, mice bearing GD3S O/E plasmid showed increased tumor size and tumor initiation compared with the control on the indicated days (Fig. 3E and Table S3). Taken together, these findings demonstrated that GD3S is necessary for GSCs in vitro and in vivo.
Fig. S4.
GD3S-mediated GD3 expression, stemness genes, and cell growth. (A) Schematic diagram of the biosynthesis of a part of the ganglioseries GSLs. GM3, the precursor of GD3, is synthesized from lactosylceramide. Graphic notations are labeled. Gal, galactose; Glc, glucose; NeuAc, N-acetylneuraminic acid. (B and C) Measurement of the mRNA expression of GM3S and GD2S in DBTRG parental cells and neurospheres by Q-PCR. (D) Expression levels of glycosyltransferases in separated GD3hi and GD3lo cells of DBTRG tumors. (E) To measure the efficiency of GD3S KD in neurospheres, mRNA expression was analyzed by Q-PCR. (F) GD2 and GD3 levels in GD3S KD and vector control cells were analyzed by FACSCanto flow cytometry. The histograms of the cells stained with GD3 (or GD2) and isotype controls are shown in gray and white, respectively. (G) To measure the efficiency of GD3S O/E in neurospheres, mRNA expressions were analyzed by Q-PCR. (H) Same method as in E was performed in GD3S O/E and vector control cells. (I and J) Four thousand cells per well were seeded in several 96-well plates, and the cell numbers were measured by WST-1 at the indicated time for cell proliferations of GD3S KD, GD3S O/E, and vector control cells. Data are the mean ± SD (B–E, G, I, and J) of three independent experiments. The P value between groups was determined by an unpaired Student’s t test. *P < 0.05; **P < 0.01.
Fig. 3.
Manipulation of GD3S mediates stemness genes, sphere formation, and tumor initiation. (A) The expression level of GD3S in DBTRG parental cells and neurospheres was measured by Q-PCR. (B and C) The expression levels of stemness genes were determined in neurospheres that expressed vector control, GD3S KD (B), or GD3S O/E (C) plasmid. Results are shown as mean ± SD (n = 3). (D) Neurosphere formation assays using vector control, GD3S KD, or GD3S O/E cells were performed in 96 wells. The mean ± SD for each group (n = 10) is shown. (E) Tumor growth generated from 105 vector control, GD3S KD, or GD3S O/E cells was monitored using a caliper to measure the tumor size every 4 d between 8 and 12 wk (n = 4 mice per group). (Right) Gross view of isolated tumors. (Scale bars, 1 cm.) The P value between groups was determined by an unpaired Student’s t test. *P < 0.05; **P < 0.01.
Fig. 4.
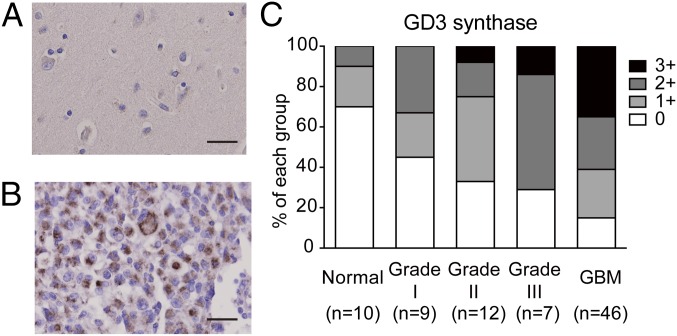
Expression of GD3S in GBM tissues. Representative images of normal brain tissues (A) and GBM (B) after immunohistochemical staining. (Scale bars, 20 μm.) (C) Statistical results of GD3S immunohistochemistry. Grade I (n = 9), grade II (n = 12), grade III (n = 7), grade IV (GBM, n = 46), and normal brain tissues (n = 10) were counterstained with hematoxylin after immunohistochemistry. The staining intensity of the tissues was scored as 0 (negative), 1+ (weak), 2+ (moderate), and 3+ (strong).
Table S3.
Tumor generation of tumor cells with GD3S KD or GD3S O/E in vivo
| Cell type | 106 cells | 105 cells | 104 cells |
| KD control | 4/4 | 4/4 | 2/4 |
| GD3S KD | 3/4 | 2/4 | 0/4 |
| O/E control | 3/3 | 4/4 | 1/4 |
| GD3S O/E | 3/3 | 4/4 | 3/4 |
The numbers of tumor cell-injected mice and tumor-bearing mice are shown (n = 3 or 4 mice per group).
GD3S Is Highly Expressed in GBM Specimens.
GD3S has been reported to be a potential therapeutic target for inhibiting breast cancer initiation (34), but the expression status of GD3S in GBM tissues was unclear. To investigate whether GD3S was overexpressed in clinical GBM specimens, we analyzed the expression of GD3S in grade I–IV astrocytomas and in normal brain tissues by screening human tissue arrays using immunohistochemistry. The results showed that most normal brain tissues were GD3S− (Fig. 4A), and GD3S was strongly located in the cytoplasm of GBM cells (Fig. 4B). Furthermore, the statistical results indicated that 38 of 46 GBM tissues (84.8%) were GD3S+ and more than half of the GBM specimens (60.8%) were intensely stained, with a score of 2+ or higher (Fig. 4C). On the contrary, 57.1% of low-grade astrocytoma specimens were weakly stained (scored as 1+) by GD3S antibody, and the score of GD3S intensity was positively correlated with the grades of astrocytomas. These results demonstrated that GD3S is highly expressed in GBM tumors.
GD3S Regulates Sphere Formation Through Activation of c-Met.
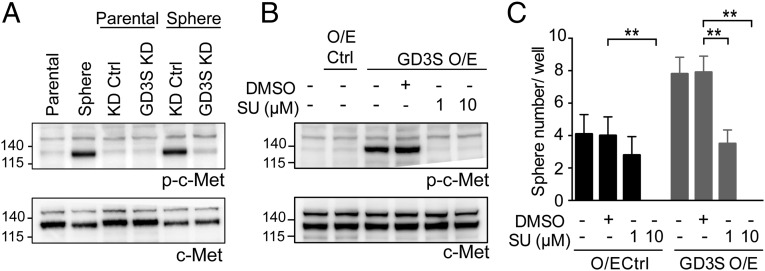
Previous studies showed that GD3S enhances the proliferation and tumor growth of MDA-MB-231 cells through c-Met signaling (35); hence, we analyzed the expression of phosphorylated c-Met (p-c-Met) in neurospheres, GD3S O/E, and GD3S KD cells. Interestingly, we observed no change in total c-Met and increased p-c-Met in neurospheres compared with their parental cells, and decreased p-c-Met in neurospheres expressing GD3S KD relative to their KD control counterparts (Fig. 5A). Moreover, the p-c-Met was strongly expressed in the GD3S O/E cells compared with O/E control cells (Fig. 5B), suggesting that GD3S regulates only the function of c-Met and not its expression. To address whether sphere formation regulated by GD3S was through activation of c-Met, we treated the GD3S O/E cells with SU11274, a c-Met inhibitor, and found that either 1 μM or 10 μM SU11274 was capable of reducing the p-c-Met expression (Fig. 5B) and the sphere formation capacity of O/E control cells and GD3S O/E cells (Fig. 5C), indicating that c-Met signaling functions downstream of GD3S.
Fig. 5.
GD3S regulates sphere formation through activation of c-Met signaling. (A) Western blot analysis of p-c-Met and c-Met expression in DBTRG parental cells, neurospheres, and both of them transfected with KD control and GD3S KD plasmid. (B) Expression of p-c-Met and c-Met in DBTRG GD3S O/E cells treated with or without SU11274. (C) SU11274 treatment in DBTRG O/E control and DBTRG GD3S O/E cells was used for sphere formation assay. The mean ± SD for each group (n = 10) is shown. The P value was obtained by one-way ANOVA. Ctrl, control; SU, SU11274. *P < 0.05; **P < 0.01.
GD3 Antibody Mediates CDC Against GBM Cells and Suppresses Tumor Growth in Vivo.
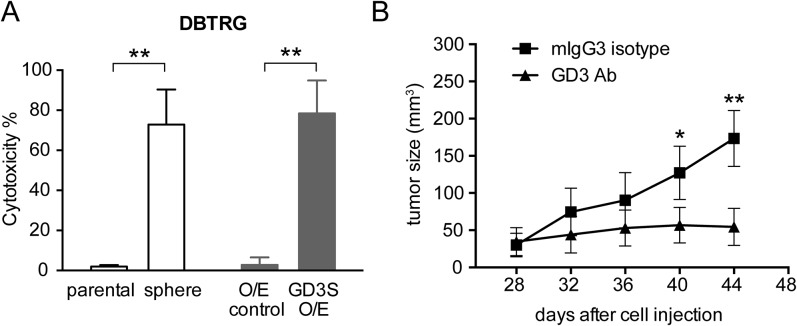
To examine whether targeting GD3 would trigger CDC in GBM cells, cells were treated with a GD3 antibody (R24) and rabbit complement. It was found that in the presence of complement, R24 reduced the number of viable GBM cells significantly (Fig. S5A). We observed an obvious R24-mediated CDC in GD3-expressed GBM cell lines and not in the GBM cells, which expressed no detectable GD3. Therefore, the level of R24-mediated CDC positively correlated with the expression level of GD3 in GBM cells.
Fig. S5.
GD3 antibody suppresses GBM cell and tumor growth. (A) DBTRG cells, neurospheres, O/E control, and GD3S O/E cells were treated with 20 μg/mL R24 and rabbit complement to observe R24-induced cell lysis. The mean ± SD for each group (n = 10) is shown. (B) Nude mice were inoculated with DBTRG cells in the right flank, and R24 or mouse IgG3 isotype control (150 μg per dose) was administered i.p. at days 28, 32, 36, and 40. The tumor volume in each group (n = 5–7) was measured at different time points and is shown as the mean ± SD. The P value between groups was determined by an unpaired Student’s t test. *P < 0.05; **P < 0.01.
To examine if R24 was able to suppress GBM tumor growth in vivo, R24 was administered to nude mice inoculated s.c. with DBTRG cells when the tumor size reached 15–30 mm3 at day 28 postinjection. The experiment showed that the administration of R24 could suppress DBTRG tumor growth (Fig. S5B). In comparison to mice receiving R24 treatment, DBTRG tumors grew aggressively in the control group treated with mouse IgG3. These results indicated that R24 can suppress the growth of GBM tumors.
Discussion
GBM displays a complex genetic and remarkable heterogeneity, so it is unlikely that the expression of a single marker can absolutely enrich and define GSCs in every tumor; hence, a combination of markers to enrich GSCs specifically and sufficiently is necessary. CD133 has been proven not to be a definitive marker for GSCs because CD133 expression is not detectable in many glioma cell lines and fresh GBM specimens (11, 12, 16), and both CD133− and CD133+ cells separated from the same tumor specimen can be cultured as neurospheres and are able to self-renew and initiate tumor formation (13). In addition, the tumor initiation assay required the injection of 100 or more CD133+ cells in immunodeficient mice. In this study, we evaluated the expression levels of glycan-related molecules in various GBM neurospheres and found the ganglioside GD3 is highly expressed in neurospheres. Moreover, the cells segregated by GD3, or in combination with CD133, showed a high self-renewal ability and robust tumor initiation potency.
Of all the gangliosides examined, neurospheres displayed the highest GD2 expression and medium GD3 expression in flow cytometry, but they showed similar expression levels of GD2 and GD3 in MALDI-MS assays, indicating that the antibody-binding affinity for GD2 and GD3 is different. The functional role of GD3 in GSCs is not clear. Recent studies suggest that gangliosides are widely expressed on tumor cells (36) and disialyl gangliosides enhance tumor phenotype with multiple modalities (37). These reports demonstrate that GD3 promotes cell growth and invasion through phosphorylation of p130Cas, paxillin, and focal adhesion kinase (FAK) in melanoma cells (38). Furthermore, the Src family kinase Yes was found to link with p130Cas or FAK as an activated form to promote malignant properties of human melanoma cells expressing GD3 (37, 39). It was also revealed that gangliosides, including GD1a, GD1b, GD3, and GM3, may facilitate tumor cell escape from the immune system within the tumor microenvironment (40). It has been shown that GM3 and GD3 induce apoptosis in immune cells, including natural killer (NK) and T cells (41). The b-series gangliosides, including GD3 and GD2, but not other ganglioseries gangliosides, were shown to bind to sialic acid-binding Ig-like lectin 7 (Siglec-7), an inhibitory receptor on human NK cells, and that cells that engineered to overexpress GD3S inhibit NK cell-modulated cytotoxicity via a Siglec-7–dependent mechanism (42). Considering the fact that CSCs have to overcome a complex immune system to survive and form tumors in the harsh microenvironment, the immunosuppressive function of GD3 may be critical for their tumorigenicity.
We previously showed that the globoseries glycolipids SSEA3 and SSEA4 are highly expressed on GBM cells and that an anti-SSEA4 antibody was effective against GBM (21). As a tumor-associated antigen, GD3 has been an attractive target in immunotherapy (43). The anti-GD3 mAb R24 has been described to mediate in vitro effector functions, including CDC and antibody-dependent cell-mediated cytotoxicity (ADCC), and to suppress tumor growth of melanoma in mice models, and it was used for patients with melanoma (44, 45). We found that R24 also showed a strong CDC effect on the GBM cells expressing high GD3, but not on the cells with low expression, suggesting that R24 could be used in GBM immunotherapy.
We also noted that the key enzyme regulating the expression levels of GD3 or GD2 is GD3S, but not GD2S, even though GD2S is the intermediate enzyme converting GD3 to GD2. In addition, the expression of GD3S mRNA is up-regulated in various GBM neurospheres and in GD3hi cells from GBM xenograft tumors. Recently, clinical studies showed that high expression of GD3S was found in estrogen receptor (ER)-negative breast cancer and was associated with poor histological grade in ER-negative tumors (29). GD3S can enhance proliferation of MDA-MB-231 breast cancer cells through the constitutive activation of the c-MET receptor and downstream mitogen-activated protein kinase/extracellular signal-regulated kinase and phosphoinositide-3 kinase/Akt signaling pathways (35). With respect to breast CSCs, GD3S not only regulates epithelial-mesenchymal transition and CSC properties but also metastasis in vivo (46). In summary, these findings uncovered a significant role of GD3 and the enzyme GD3S in GBM, and GD3 can be combined with CD133 for the enrichment of GSCs, suggesting GD3 and GD3S as therapeutic targets against GSCs and GBM.
Materials and Methods
Neurosphere Formation Assay.
Cultured cells or tumor cells (xenograft tumors) were trypsinized, and single-cell suspensions with the indicated cell number (5, 20, 50, and 100 cells per well) were cultured in 96-well ultra-low attachment plates (Corning, USA) containing Neurobasal medium (Invitrogen) supplemented with B27 (Invitrogen), 20 ng/mL EGF, and 20 ng/mL basic FGF (Peprotech). After 20 d, the number of wells with neurospheres was quantified. For secondary neurosphere formation assay, the established neurospheres were dissociated into single cells and were cultured in 96-well ultra-low attachment plates. The number of wells with neurospheres >100 μm in diameter was counted, and the frequency for sphere formation was generated and computed using the ELDA online algorithm (47) (bioinf.wehi.edu.au/software/elda/).
Tumor Formation in Vivo.
Four-week-old nonobese diabetic-scid IL2rγnull mice were obtained and maintained under specific pathogen-free conditions at the Genomics Research Center of Academia Sinica. Procedures involving animals and their care were conducted according to the protocols of the Academia Sinica Institutional Animal Care and Utilization Committee in compliance with national and international laws and policies. For xenograft tumor preparation, DBTRG cells with or without the luciferase gene (1 × 10⁷ cells in 200 μL of PBS) were injected into the flank regions of mice (around 4 wk old), and mice were killed when the tumor size reached 1 cm3. Single cells were harvested from the tumors, mechanically minced, and enzymatically treated with RPMI medium supplemented with 10% (vol/vol) FBS, 200 U/mL collagenase IV, and 0.6 U/mL dispase. For the limiting dilution assay of tumorigenicity, DBTRG tumor cells (six partitioned cell populations) carrying the luciferase gene were injected into the flank regions of mice (around 4 wk old) with the indicated cell number to generate the tumor, and tumor growth was monitored by bioluminescence every 4 d using the IVIS 200 imaging system (PerkinElmer). For the function of GD3S in tumor growth, DBTRG cells carrying the KD control or GD3S KD were injected into the flank regions of mice; the tumor size was determined using a vernier caliper by measuring the length (L) and width (W), and the tumor volume was calculated (in cubic millimeters) as 1/2 × LW2. For tumor growth inhibited by R24, BALB/c nude mice were purchased from the National Laboratory Animal Center (Taiwan) and maintained under specific pathogen-free conditions. DBTRG cells (107 cells per 200 μL of PBS) were injected s.c. into the flank regions of 4-wk-old mice to generate the xenograft model. On days 28, 32, 36, and 40, each mouse was injected i.p. with 150 μg of R24 or with mouse IgG3 isotype antibody.
SI Materials and Methods
Cell Culture.
U251, U138MG, LN18, LN229, U87MG, and G5T cells were routinely maintained in high-glucose DMEM (Invitrogen) supplemented with 10% (vol/vol) FBS (Biological Industries). DBTRG and GBM 8401 cells were maintained in RPMI 1640 (Invitrogen) with 10% (vol/vol) FBS. For SU11274 treatment, the cells were seeded overnight and treated with SU11274-containing medium for 24 h.
Reagents.
Anti-Lex, anti-sLex, phycoerythrin-labeled anti-CD90, and anti-GD2 antibodies were purchased from BD Biosciences. Anti-GD1a, anti-GT1b, and Alexa Fluor 488 anti-A2B5 antibodies were purchased from Millipore. Anti-GM1 and anti-GM2 antibodies were purchased from Calbiochem (Merck). Anti-Ley, anti-sTn, and anti-GD3 antibodies (R24) were purchased from Abcam. Anti-TF antibody was purchased from Thermo Scientific. Anti-Tn antibody was purchased from DakoCytomation. Fluorescence-labeled MC813-70 and MC631 were purchased from Biolegend. Anti-GM3 was purchased from Seikagaku. Anti-CD44 and anti-CD24 were purchased from eBioscience. CD133 was purchased from Miltenyi Biotec. For immunohistochemistry, GD3S pAb was purchased from Abnova.
The uses of these antibodies in individual experiments are described in the following sections. The GM1 isomer standards were purchased from Dextra Laboratories and Elicityl Research. SU1174 was purchased from Sigma–Aldrich.
Flow Cytometry.
Cells (1 × 10⁵) were stained with 0.5 μg of antibody in 50 μL of FACS buffer (PBS buffer with 1% FBS) on ice for 30 min. After being washed twice with FACS buffer, if necessary, cells were incubated with appropriate secondary antibody (1:500 diluted in FACS buffer; Biolegend) on ice for 30 min. After washing twice with FACS buffer, cells were resuspended in 200 μL of FACS buffer containing 1 μg/mL propidium iodide (PI) and subjected to analysis. Data acquisition was performed on a FACSCanto (BD Biosciences) with FACSDiva software (BD Biosciences), and data analyses were performed using FlowJo software (TreeStar). Live cells (PI-negative) were gated for analysis.
MALDI-MS.
Glycans released by recombinant endoglycoceramidase were permethylated by iodomethane using the NaOH/dimethyl sulfoxide slurry method. The permethylated derivatives were then extracted in chloroform and washed with water a few times. MALDI-MS profiling of permethylated glycans was conducted in an ABI 4700 Proteomics Analyzer (Applied Biosystems) using 2,5-dihydroxybenzoic acid as a matrix (10 mg/mL).
Porous Graphitized Carbon-Nano-LC-MS and MS/MS.
The glycans dissolved in water/0.1% formic acid were loaded onto a HyperCarb Porous Graphitic Carbon LC column (75 μm ×150 mm, 250 Å, 5-μm particle size; Thermo Scientific) at a flow rate of 300 nL⋅min−1. The gradient stayed at 0.1% formic acid (FA) for 1 min, increased to 5% (vol/vol) acetonitrile (ACN)/0.1% FA for 1 min, gradually increased to 25% (vol/vol) ACN/0.1% FA for 90 min, quickly increased to 85% (vol/vol) ACN/0.1% FA for 10 min, and finally held isocratically for 10 min. All data were processed by Xcalibur software v2.1, and the full-scan MS spectrum was acquired in an orbitrap at a resolution of 60,000 (at m/z 400).
Cell Proliferation Assay.
Cell proliferation was assayed using a water-soluble tetrazolium salt, 4-[3-(4-iodophenyl)-2-(4-nitrophenyl)-2H-5-tetrazolio]-1,3-benzene disulfonate (WST-1), according to the manufacturer’s instruction (Roche). Briefly, 2,000 cells per well were seeded in 96-well plates. After 24, 48, 72, or 96 h of cell growth, WST-1 (20 μL per well for 200 μL of culture medium) was added and allowed to incubate for 2 h at 37 °C. The absorbance at 450 nm and 690 nm (as references) was read by a SpectraMax M5 microplate reader (Molecular Devices).
Establishment of Stable Cell Lines.
To establish human GD3S O/E stable lines, full-length cDNA that encodes human GD3S was PCR-amplified (forward primer, 5′-CCGCTCGAGAATCTGAAAATGCGGCCATG-3′; reverse primer, 5′-CGGAATTCGGTCGAACTGAGTTTGGTCG-3′) and subcloned into expression vector pMSCVpuro (Clontech). Murine stem cell virus (MSCV)-control and MSCV-GD3S vesicular stomatitis virus G glycoprotein (VSV-G) pseudotyped retrovirus were then generated in GP2-293 cells (Clontech) and used to infect DBTRG and LN18 cells. Two days after viral infection, control and GD3S stable pools were selected with puromycin (1 μg/mL). To establish GD3S KD stable lines, the GIPZ Lentiviral shRNAmir System (Thermo Scientific) with the GD3S-short hairpin (sh) sequence 5′-TGATTGGCACCAACATCTG-3′ was used to generate lentiviruses. Briefly, shGD3S and shControl lentiviruses were pseudotyped with VSV-G in 293T cells and used to infect DBTRG cells for 2 d. Stable clones were selected with puromycin (1 μg/mL), and the KD efficiency was determined by quantitative PCR (Q-PCR) and a BD Aria II sorter.
Quantitative PCR.
Total RNA was extracted using an RNeasy Mini Kit (QIAGEN) according to the manufacturer’s instructions. One microgram of RNA was reverse-transcribed into cDNA using the RevertAid First Strand cDNA Synthesis Kit (Thermo Scientific). The Maxima SYBR Green/ROX qPCR Master Mix (Thermo Scientific) reaction system was used, and reactions were run on an ABI 7300 detection system (Life Technology). Q-PCR results were first normalized to the GAPDH transcript level to yield Δthreshold cycle (ΔCt) values. The results are expressed as 2^(−ΔCt). The primers used for PCR were as follows: SOX2 (forward primer, 5′-CACATGAACGGCTGGAGCAA-3′; reverse primer, 5′- GGAGTGGGAGGAAGAGGTAAC-3′), Oct4 (forward primer, 5′- GGTATTCAGCCAAACGACCATC-3′; reverse primer, 5′-TTCTCCAGGTTGCCTCTCACTC-3′), NANOG (forward primer, 5′-CGAAGAATAGCAATGGTGTGAC-3′; reverse primer, 5′- GGTCTGAGTGTTCCAGGAGTG-3′), NES (forward primer, 5′-CTCCAAGACTTCCCTCAGCTTTC-3′; reverse primer, 5′-GGGCTCTGATCTCTGCATCTACA-3′), CD133 (forward primer, 5′-CCTCATGGTTGGAGTTGGATT-3′; reverse primer, 5′- GAGTGCCGTAAGTGCCTCTA-3′), GAPDH (forward primer, 5′-GCTGTTGTCATACTTCTCATG-3′; reverse primer, 5′-TCTTCCAGGAGCGAGATCCC-3′), GM3 synthase (forward primer, 5′-ACATTGCTTGTGTTTGGAG-3′; reverse primer, 5′-GGACGACATTCCTTCTGC-3′), GD3 synthase (forward primer, 5′-TCCCAGCATAATTCGGCAA-3′; reverse primer, 5′-ATCTGACAGTGTATAATAAACCCTC-3′), and GD2 synthase (forward primer, 5′-TTCACTATCCGCATAAGACAC-3′; reverse primer, 5′-GTAACCGTTGGGTAGAAGC-3′).
Immunohistochemistry.
For GD3S staining of normal brain and GBM specimens, three different tissue microarray slides (Biomax), comprising a total of 10 normal brain sections and 74 GBM sections, were tested. The slides were dried at 60 °C for 30 min, deparaffinized in xylene, and rehydrated in graded alcohols, followed by treatment with blocking buffer [2% (wt/vol) Blocking Reagent (Roche) in PBS with 0.1% Triton X-100] for 30 min at room temperature. The slides were then incubated at 4 °C overnight with anti-GD3S pAb (1:100 in blocking buffer). After gently washing with PBS with 0.1% Tween-20, the immunoreactivity on specimens was detected with the SuperSensitive Polymer-HRP IHC Detection System (BioGenex), and the slides were counterstained with hematoxylin and prepared for mounting.
CDC Assay.
The CDC activity of anti-GD3 (R24) mAb was measured by lactate dehydrogenase (LDH) release assay using the CytoTox 96 Non-Radioactive Cytotoxicity Assay Kit (Promega). Cells (1 × 10⁴) were plated in each well of 96-well plates and washed with PBS twice after growth overnight. The cells were then incubated with 1 μg of anti-GD3 mAb in 50 μL of phenol red-free RPMI in a 5% CO2 incubator at 37 °C for 30 min. At that time, 150 μL of diluted rabbit complement (Life Technologies) was added into the wells, resulting in a final 1:5 dilution of serum complement. All experiments were performed in triplicate. After incubation for 1 h, the degree of cell lysis was determined by measuring the amount of LDH released into the culture supernatant. Maximum LDH release was determined by lysing the cells using the lysis solution provided by the kit. The percentage of specific lysis was calculated according to the equation:
Statistical Analysis.
GraphPad Prism 6 and Microsoft Excel were used for statistical analysis. An unpaired two-tailed Student’s t test and ANOVA with Tukey’s multiple comparisons test were used to compare parametric data between the two groups and among multiple groups, respectively. For each statistical analysis, two-tailed testing with a 95% confidence interval was performed and P < 0.05 was considered statistically significant.
Acknowledgments
We thank Dr. Hua-Chien Chen for providing various cancer cell lines. We also thank Dr. Chia-Ning Shen, Dr. Patrick C. H. Hsieh, and Tsung-Ching Lai for assistance with experiments. This research was supported by the Genomics Research Center, Academia Sinica, Taiwan.
Footnotes
The authors declare no conflict of interest.
This article contains supporting information online at www.pnas.org/lookup/suppl/doi:10.1073/pnas.1604721113/-/DCSupplemental.
References
- 1.Wen PY, Kesari S. Malignant gliomas in adults. N Engl J Med. 2008;359(5):492–507. doi: 10.1056/NEJMra0708126. [DOI] [PubMed] [Google Scholar]
- 2.Sanai N, Alvarez-Buylla A, Berger MS. Neural stem cells and the origin of gliomas. N Engl J Med. 2005;353(8):811–822. doi: 10.1056/NEJMra043666. [DOI] [PubMed] [Google Scholar]
- 3.Reya T, Morrison SJ, Clarke MF, Weissman IL. Stem cells, cancer, and cancer stem cells. Nature. 2001;414(6859):105–111. doi: 10.1038/35102167. [DOI] [PubMed] [Google Scholar]
- 4.Visvader JE, Lindeman GJ. Cancer stem cells in solid tumours: Accumulating evidence and unresolved questions. Nat Rev Cancer. 2008;8(10):755–768. doi: 10.1038/nrc2499. [DOI] [PubMed] [Google Scholar]
- 5.Singh SK, et al. Identification of human brain tumour initiating cells. Nature. 2004;432(7015):396–401. doi: 10.1038/nature03128. [DOI] [PubMed] [Google Scholar]
- 6.Collins AT, Berry PA, Hyde C, Stower MJ, Maitland NJ. Prospective identification of tumorigenic prostate cancer stem cells. Cancer Res. 2005;65(23):10946–10951. doi: 10.1158/0008-5472.CAN-05-2018. [DOI] [PubMed] [Google Scholar]
- 7.Suetsugu A, et al. Characterization of CD133+ hepatocellular carcinoma cells as cancer stem/progenitor cells. Biochem Biophys Res Commun. 2006;351(4):820–824. doi: 10.1016/j.bbrc.2006.10.128. [DOI] [PubMed] [Google Scholar]
- 8.Ricci-Vitiani L, et al. Identification and expansion of human colon-cancer-initiating cells. Nature. 2007;445(7123):111–115. doi: 10.1038/nature05384. [DOI] [PubMed] [Google Scholar]
- 9.Hermann PC, et al. Distinct populations of cancer stem cells determine tumor growth and metastatic activity in human pancreatic cancer. Cell Stem Cell. 2007;1(3):313–323. doi: 10.1016/j.stem.2007.06.002. [DOI] [PubMed] [Google Scholar]
- 10.Eramo A, et al. Identification and expansion of the tumorigenic lung cancer stem cell population. Cell Death Differ. 2008;15(3):504–514. doi: 10.1038/sj.cdd.4402283. [DOI] [PubMed] [Google Scholar]
- 11.Beier D, et al. CD133(+) and CD133(-) glioblastoma-derived cancer stem cells show differential growth characteristics and molecular profiles. Cancer Res. 2007;67(9):4010–4015. doi: 10.1158/0008-5472.CAN-06-4180. [DOI] [PubMed] [Google Scholar]
- 12.Joo KM, et al. Clinical and biological implications of CD133-positive and CD133-negative cells in glioblastomas. Lab Invest. 2008;88(8):808–815. doi: 10.1038/labinvest.2008.57. [DOI] [PubMed] [Google Scholar]
- 13.Wang J, et al. CD133 negative glioma cells form tumors in nude rats and give rise to CD133 positive cells. Int J Cancer. 2008;122(4):761–768. doi: 10.1002/ijc.23130. [DOI] [PubMed] [Google Scholar]
- 14.Ogden AT, et al. Identification of A2B5+CD133- tumor-initiating cells in adult human gliomas. Neurosurgery. 2008;62(2):505–514; discussion 514–515. doi: 10.1227/01.neu.0000316019.28421.95. [DOI] [PubMed] [Google Scholar]
- 15.Bao S, et al. Targeting cancer stem cells through L1CAM suppresses glioma growth. Cancer Res. 2008;68(15):6043–6048. doi: 10.1158/0008-5472.CAN-08-1079. [DOI] [PMC free article] [PubMed] [Google Scholar]
- 16.Son MJ, Woolard K, Nam DH, Lee J, Fine HA. SSEA-1 is an enrichment marker for tumor-initiating cells in human glioblastoma. Cell Stem Cell. 2009;4(5):440–452. doi: 10.1016/j.stem.2009.03.003. [DOI] [PMC free article] [PubMed] [Google Scholar]
- 17.Lathia JD, et al. Integrin alpha 6 regulates glioblastoma stem cells. Cell Stem Cell. 2010;6(5):421–432. doi: 10.1016/j.stem.2010.02.018. [DOI] [PMC free article] [PubMed] [Google Scholar]
- 18.Joo KM, et al. MET signaling regulates glioblastoma stem cells. Cancer Res. 2012;72(15):3828–3838. doi: 10.1158/0008-5472.CAN-11-3760. [DOI] [PubMed] [Google Scholar]
- 19.Yanagisawa M. Stem cell glycolipids. Neurochem Res. 2011;36(9):1623–1635. doi: 10.1007/s11064-010-0358-1. [DOI] [PubMed] [Google Scholar]
- 20.Yanagisawa M, Yoshimura S, Yu RK. Expression of GD2 and GD3 gangliosides in human embryonic neural stem cells. ASN Neuro. 2011;3(2):e00054. doi: 10.1042/AN20110006. [DOI] [PMC free article] [PubMed] [Google Scholar]
- 21.Lou YW, et al. Stage-specific embryonic antigen-4 as a potential therapeutic target in glioblastoma multiforme and other cancers. Proc Natl Acad Sci USA. 2014;111(7):2482–2487. doi: 10.1073/pnas.1400283111. [DOI] [PMC free article] [PubMed] [Google Scholar]
- 22.Yu RK, Tsai YT, Ariga T, Yanagisawa M. Structures, biosynthesis, and functions of gangliosides--an overview. J Oleo Sci. 2011;60(10):537–544. doi: 10.5650/jos.60.537. [DOI] [PMC free article] [PubMed] [Google Scholar]
- 23.Svennerholm L, et al. Human brain gangliosides: Developmental changes from early fetal stage to advanced age. Biochim Biophys Acta. 1989;1005(2):109–117. doi: 10.1016/0005-2760(89)90175-6. [DOI] [PubMed] [Google Scholar]
- 24.Ngamukote S, Yanagisawa M, Ariga T, Ando S, Yu RK. Developmental changes of glycosphingolipids and expression of glycogenes in mouse brains. J Neurochem. 2007;103(6):2327–2341. doi: 10.1111/j.1471-4159.2007.04910.x. [DOI] [PubMed] [Google Scholar]
- 25.Nakatani Y, Yanagisawa M, Suzuki Y, Yu RK. Characterization of GD3 ganglioside as a novel biomarker of mouse neural stem cells. Glycobiology. 2010;20(1):78–86. doi: 10.1093/glycob/cwp149. [DOI] [PMC free article] [PubMed] [Google Scholar]
- 26.Kageshita T, Nakamura T, Hirai S, Arao T. [Expression of gangliosides on malignant melanoma] Nippon Hifuka Gakkai Zasshi. 1990;100(6):689–694. Japanese. [PubMed] [Google Scholar]
- 27.Carubia JM, Yu RK, Macala LJ, Kirkwood JM, Varga JM. Gangliosides of normal and neoplastic human melanocytes. Biochem Biophys Res Commun. 1984;120(2):500–504. doi: 10.1016/0006-291x(84)91282-8. [DOI] [PubMed] [Google Scholar]
- 28.Gaini SM, et al. Ganglioside content and composition in human gliomas. Acta Neurochir Suppl (Wien) 1988;43:126–129. doi: 10.1007/978-3-7091-8978-8_27. [DOI] [PubMed] [Google Scholar]
- 29.Ruckhäberle E, et al. Gene expression of ceramide kinase, galactosyl ceramide synthase and ganglioside GD3 synthase is associated with prognosis in breast cancer. J Cancer Res Clin Oncol. 2009;135(8):1005–1013. doi: 10.1007/s00432-008-0536-6. [DOI] [PMC free article] [PubMed] [Google Scholar]
- 30.Ignatova TN, et al. Human cortical glial tumors contain neural stem-like cells expressing astroglial and neuronal markers in vitro. Glia. 2002;39(3):193–206. doi: 10.1002/glia.10094. [DOI] [PubMed] [Google Scholar]
- 31.Ruhaak LR, Deelder AM, Wuhrer M. Oligosaccharide analysis by graphitized carbon liquid chromatography-mass spectrometry. Anal Bioanal Chem. 2009;394(1):163–174. doi: 10.1007/s00216-009-2664-5. [DOI] [PubMed] [Google Scholar]
- 32.Chang WW, et al. Expression of Globo H and SSEA3 in breast cancer stem cells and the involvement of fucosyl transferases 1 and 2 in Globo H synthesis. Proc Natl Acad Sci USA. 2008;105(33):11667–11672. doi: 10.1073/pnas.0804979105. [DOI] [PMC free article] [PubMed] [Google Scholar]
- 33.Huang YL, et al. Carbohydrate-based vaccines with a glycolipid adjuvant for breast cancer. Proc Natl Acad Sci USA. 2013;110(7):2517–2522. doi: 10.1073/pnas.1222649110. [DOI] [PMC free article] [PubMed] [Google Scholar]
- 34.Battula VL, et al. Ganglioside GD2 identifies breast cancer stem cells and promotes tumorigenesis. J Clin Invest. 2012;122(6):2066–2078. doi: 10.1172/JCI59735. [DOI] [PMC free article] [PubMed] [Google Scholar]
- 35.Cazet A, et al. GD3 synthase expression enhances proliferation and tumor growth of MDA-MB-231 breast cancer cells through c-Met activation. Mol Cancer Res. 2010;8(11):1526–1535. doi: 10.1158/1541-7786.MCR-10-0302. [DOI] [PubMed] [Google Scholar]
- 36.Hakomori S. Tumor malignancy defined by aberrant glycosylation and sphingo(glyco)lipid metabolism. Cancer Res. 1996;56(23):5309–5318. [PubMed] [Google Scholar]
- 37.Hamamura K, et al. Functional activation of Src family kinase yes protein is essential for the enhanced malignant properties of human melanoma cells expressing ganglioside GD3. J Biol Chem. 2011;286(21):18526–18537. doi: 10.1074/jbc.M110.164798. [DOI] [PMC free article] [PubMed] [Google Scholar]
- 38.Hamamura K, et al. Ganglioside GD3 promotes cell growth and invasion through p130Cas and paxillin in malignant melanoma cells. Proc Natl Acad Sci USA. 2005;102(31):11041–11046. doi: 10.1073/pnas.0503658102. [DOI] [PMC free article] [PubMed] [Google Scholar]
- 39.Ohkawa Y, et al. Ganglioside GD3 Enhances Invasiveness of Gliomas by Forming a Complex with Platelet-derived Growth Factor Receptor α and Yes Kinase. J Biol Chem. 2015;290(26):16043–16058. doi: 10.1074/jbc.M114.635755. [DOI] [PMC free article] [PubMed] [Google Scholar]
- 40.Potapenko M, Shurin GV, de León J. Gangliosides as immunomodulators. Adv Exp Med Biol. 2007;601:195–203. doi: 10.1007/978-0-387-72005-0_20. [DOI] [PubMed] [Google Scholar]
- 41.Péguet-Navarro J, et al. Gangliosides from human melanoma tumors impair dendritic cell differentiation from monocytes and induce their apoptosis. J Immunol. 2003;170(7):3488–3494. doi: 10.4049/jimmunol.170.7.3488. [DOI] [PubMed] [Google Scholar]
- 42.Nicoll G, et al. Ganglioside GD3 expression on target cells can modulate NK cell cytotoxicity via siglec-7-dependent and -independent mechanisms. Eur J Immunol. 2003;33(6):1642–1648. doi: 10.1002/eji.200323693. [DOI] [PubMed] [Google Scholar]
- 43.Malisan F, Testi R. The ganglioside GD3 as the Greek goddess Hecate: Several faces turned towards as many directions. IUBMB Life. 2005;57(7):477–482. doi: 10.1080/15216540500167179. [DOI] [PubMed] [Google Scholar]
- 44.Nasi ML, Meyers M, Livingston PO, Houghton AN, Chapman PB. Anti-melanoma effects of R24, a monoclonal antibody against GD3 ganglioside. Melanoma Res. 1997;7(Suppl 2):S155–S162. [PubMed] [Google Scholar]
- 45.Kirkwood JM, et al. Analysis of therapeutic and immunologic effects of R(24) anti-GD3 monoclonal antibody in 37 patients with metastatic melanoma. Cancer. 2000;88(12):2693–2702. [PubMed] [Google Scholar]
- 46.Sarkar TR, et al. GD3 synthase regulates epithelial-mesenchymal transition and metastasis in breast cancer. Oncogene. 2015;34(23):2958–2967. doi: 10.1038/onc.2014.245. [DOI] [PMC free article] [PubMed] [Google Scholar]
- 47.Hu Y, Smyth GK. ELDA: Extreme limiting dilution analysis for comparing depleted and enriched populations in stem cell and other assays. J Immunol Methods. 2009;347(1-2):70–78. doi: 10.1016/j.jim.2009.06.008. [DOI] [PubMed] [Google Scholar]


