

Significance
Melanin pigments are synthesized in skin and hair cells called melanocytes and provide color to skin and hair and protection against UV rays. Inadequate protection poses the risk of accumulating genetic mutations in the DNA of skin cells, which can lead to skin cancer. It can also reduce folate levels, which then causes birth defects. Therefore, understanding pigmentation is important for human health. There are several protein components of the machinery that regulates human pigmentation that work in unknown ways. Two-pore channel 2 (TPC2) is one of them. Here we found that TPC2 is located in compartments inside melanocytes known as melanosomes, where melanin is synthesized. TPC2 regulates the pH and size of melanosomes, thus controlling the amount of melanin produced.
Keywords: melanosome, pigmentation, two-pore channel 2, organelle pH, membrane traffic
Abstract
Melanin is responsible for pigmentation of skin and hair and is synthesized in a specialized organelle, the melanosome, in melanocytes. A genome-wide association study revealed that the two pore segment channel 2 (TPCN2) gene is strongly linked to pigmentation variations. TPCN2 encodes the two-pore channel 2 (TPC2) protein, a cation channel. Nevertheless, how TPC2 regulates pigmentation remains unknown. Here, we show that TPC2 is expressed in melanocytes and localizes to the melanosome-limiting membrane and, to a lesser extent, to endolysosomal compartments by confocal fluorescence and immunogold electron microscopy. Immunomagnetic isolation of TPC2-containing organelles confirmed its coresidence with melanosomal markers. TPCN2 knockout by means of clustered regularly interspaced short palindromic repeat/CRISPR-associated 9 gene editing elicited a dramatic increase in pigment content in MNT-1 melanocytic cells. This effect was rescued by transient expression of TPC2-GFP. Consistently, siRNA-mediated knockdown of TPC2 also caused a substantial increase in melanin content in both MNT-1 cells and primary human melanocytes. Using a newly developed genetically encoded pH sensor targeted to melanosomes, we determined that the melanosome lumen in TPC2-KO MNT-1 cells and primary melanocytes subjected to TPC2 knockdown is less acidic than in control cells. Fluorescence and electron microscopy analysis revealed that TPC2-KO MNT-1 cells have significantly larger melanosomes than control cells, but the number of organelles is unchanged. TPC2 likely regulates melanosomes pH and size by mediating Ca2+ release from the organelle, which is decreased in TPC2-KO MNT-1 cells, as determined with the Ca2+ sensor tyrosinase-GCaMP6. Thus, our data show that TPC2 regulates pigmentation through two fundamental determinants of melanosome function: pH and size.
In humans, melanin is responsible for pigmentation of skin, hair, and eyes and serves to minimize the damage caused by exposure to UV radiation from sunlight (1, 2). Melanin is synthesized in a specialized organelle, the melanosome, which is produced in melanocyte cells in skin and hair follicles and in the eye retinal and iris pigmented epithelial cells (2–4). The melanosome is a lysosome-related organelle that houses the melanin-synthesizing enzymes: tyrosinase, tyrosinase-related protein-1, and tyrosinase-related protein-2 (2, 3, 5). The color of human skin and hair is determined by the amount and chemical composition of the melanin produced by melanosomes (2, 6, 7). Importantly, the activity of tyrosinase, the rate-limiting enzyme in melanin synthesis, is greatly reduced at acidic pH. Melanosomal pH, rather than tyrosinase expression level, has been shown to regulate tyrosinase activity and the amount of melanin produced in melanocytes from different skin types (2, 7–9). Melanosomes from melanocytes of fair-skinned individuals are significantly more acidic and display low tyrosinase activity, whereas melanosomes in dark skin melanocytes are less acidic or neutral and present higher levels of tyrosinase activity (8, 10). The organelle dimensions are also different: Melanosomes from highly pigmented skin are larger than those from lightly pigmented skin (11). Thus, revealing how melanosome pH and size are controlled is essential to understanding pigmentation in humans. However, our knowledge of the underlying regulatory factors and mechanisms is incomplete (2).
Less than 20 of the ∼300 pigmentation genes are known to directly function in the production of melanin or regulation of its chemical composition (2, 7, 12). Mutation of several of these genes, including the three melanogenic enzymes and a few ion transporters, causes oculocutaneous albinism (OCA) in patients and animal models (2, 5, 12). However, many genes that affect the color of skin, hair, and eyes encode proteins with unknown function in pigmentation (2, 12). TPCN2 is one such gene (13). Two single nucleotide polymorphisms in the TPCN2 gene were strongly associated with pigmentation variations in a genome-wide association study among 8,460 Icelanders and Dutch individuals (Fig. S1) (13). The TPCN2 gene encodes the two-pore channel 2 (TPC2) protein (13). Indirect clues as to the possible TPC2 protein function in pigmentation come from studies in other systems. TPC2 is a cation release channel expressed in endosomes and lysosomes in nonspecialized cells and platelet-dense granules, another specialized lysosome-related organelle (14–18). Nevertheless, it has not been experimentally demonstrated that TPC2 regulates pigmentation. It is also unclear how TPC2 would affect pigmentation.
Fig. S1.

CRISPR design and genotyping for knockout and EmGFP tagging of the TPCN2 gene, coding for the TPC2 protein. (A) Schematic of the TPC2 protein topology. Red stars indicate the two amino acid changes caused by single nucleotide polymorphisms strongly associated with pigmentation variations in a genome-wide association study (13). (B) Schematic of the CRISPR/Cas9 design. (C, Left) Genotyping of TPC2-KO CRISPR clones. PCR using the indicated primers (OUT-Fwd-N and OUT-Rev-N) was carried out for mock transfected MNT-1 cells and MNT-1 homozygous clones (TPC2-KO1 and TPC2-KO2), obtained by transfection with the indicated sgRNAs (sgRNA1+2 and sgRNA1+3, respectively). (Right) Genotyping of a heterozygous TPC2-EmGFP CRISPR clone. PCR using the indicated primers (OUT-Fwd-C and OUT-Rev-C primers or EmGFP primers) was carried out for mock-transfected MNT-1 cells and MNT-1 cells transfected with the indicated sgRNAs (sgRNA4+5) and donor plasmid.
Here, we show that TPC2 is expressed in the melanosome-limiting membrane in human melanocytic MNT-1 cells, a well-characterized system to study melanosome biology (19, 20). Knockout of TPCN2 using the clustered regularly interspaced short palindromic repeat (CRISPR)/CRISPR-associated 9 (Cas9) gene editing system produced a striking increase in the melanin content in MNT-1 cells. siRNA-mediated knockdown of TPC2 also elicited a significant increase in melanin content in both MNT-1 cells and primary human melanocytes. Conversely, overexpression of TPC2 reduced the amount of melanin, suggesting TPC2 is indeed involved in the regulation of melanin production by melanosomes. We demonstrate that TPC2 regulates melanosomal pH and size in living cells, providing a direct explanation to the pigmentation phenotype. We also show TPC2 is responsible for Ca2+ release from melanosomes. Our data show TPC2 works in human pigmentation by regulating melanosome function.
Results
TPC2 Is Present in the Melanosome-Limiting Membrane.
To investigate TPC2, we first tagged the endogenous TPCN2 gene with Emerald-GFP (EmGFP) in melanocytic MNT-1 cells, an ideal system to study melanosome biology (19–23). To this end, we used the CRISPR/Cas9 gene editing system (24), as depicted in Fig. 1A (Right). Briefly, the last exon of the TPCN2 gene was replaced by homology-directed repair with a version containing the EmGFP coding sequence right in front of the stop codon. Genotyping with EmGFP-specific primers showed incorporation of the DNA coding for the fluorescent tag, and analysis with primers annealing outside of the substituted region demonstrated correct localization (Fig. S1). Cells expressing TPC2-EmGFP from the endogenous gene were then transiently transfected with plasmids expressing TPC2-Cherry or the melanosomal markers tyrosinase-iRFP and Cherry-Rab27a (Fig. 1B). Live cell confocal fluorescence microscopy analysis showed endogenous TPC2-EmGFP colocalized with exogenously expressed TPC2-Cherry [Manders’ Overlap Coefficient (MOC) = 0.56 ± 0.05; nine cells] and, to a lower degree, with tyrosinase-iRFP and Cherry-Rab27a [MOC = 0.39 ± 0.05 (23 cells) and 0.37 ± 0.07 (32 cells), respectively]. Control experiments showed that the empirical maximum MOC detectable for a given protein simultaneously labeled with two different fluorophores in live cells is 0.71 ± 0.06. Also, by analyzing the colocalization between TPC2-EmGFP and an exogenously expressed peroxisomal marker, mRFP-SKL, in live cells, the background MOC was determined to be 0.12 ± 0.03 (Fig. S2). In fixed cells, endogenous TPC2-EmGFP showed a very high level of colocalization with the immunostained endogenous melanosomal marker tyrosinase-related protein 1 (TYRP1; MOC = 0.83 ± 0.01; Fig. 1C). Therefore, TPC2 is expressed in melanocytes and localizes to melanosomes.
Fig. 1.

TPC2 localizes to melanosomes. (A) Schematic of the CRISPR/Cas 9 design. (B) Confocal fluorescence microscopy images of live MNT-1 cells coexpressing endogenous TPC2-EmGFP and exogenous TPC2-Cherry, tyrosinase-iRFP, or Cherry-Rab27a. (Scale bars, 5 µm.) (C) Confocal fluorescence microscopy images of fixed/permeabilized MNT-1 cells expressing endogenous TPC2-EmGFP and immunostained for endogenous TYRP1. (Scale bar, 5 µm.) (D, Upper) Immunogold electron micrograph of an MNT-1 cell labeled with an anti-TPC2 antibody (15,000×). (Scale bar, 500 nm.) (Lower) Higher-magnification view from the region indicated in the upper panel showing examples of pigmented melanosomes (M) and endosomes (E) labeled with the TPC2 antibody. (Scale bar, 250 nm.) (E) Postnuclear supernatant extracts of MNT-1 cells expressing TPC2-GFP were subjected to immunomagnetic isolation with anti-GFP and irrelevant antibodies. Immunoblotting revealed the presence of tyrosinase, PMEL17, and Rab32 in the anti-GFP sample. Blots are representative of three experiments.
Fig. S2.

MNT-1 cells expressing TPC2-EmGFP from the endogenous locus were transfected with the peroxisomal marker mRFP-SKL and imaged by confocal fluorescence microscopy to calculate the empirical background MOC. MOC = 0.12 ± 0.03 (n = 15 cells). (Scale bar, 5 µm.)
Thin-section immunogold electron microscopy analysis of MNT-1 cells labeled with an anti-TPC2 antibody showed the majority of endogenous TPC2 localizes to pigmented, stage III and IV melanosomes (Fig. 1D) (3, 20, 21). A smaller proportion of the label was found associated with electron-lucent compartments likely representing endosomes (3, 20, 21) (Fig. 1D). Quantification showed 68 ± 5% of the label was associated with pigmented melanosomes and 22 ± 4% with endosomes/lysosomes (185 gold particles, eight cells). Labeling of other organelles was very low (nucleus: 5 ± 2%; mitochondria: 3 ± 2%). Similar results were obtained with MNT-1 cells transfected with a TPC2-GFP plasmid and labeled with an anti-GFP antibody (Fig. S3; pigmented melanosomes: 57 ± 9% of label; endosomes/lysosomes: 36 ± 6%; nucleus: 2 ± 2%; mitochondria: 2 ± 1%; 982 gold particles, nine cells).
Fig. S3.

Thin-section immunogold electron microscopy analysis of MNT-1 cells overexpressing TPC2-GFP and labeled with an anti-GFP antibody. E, endosome; M, pigmented melanosome. Pigmented melanosomes: 57 ± 9% of label; endosomes/lysosomes: 36 ± 6% of label; nucleus: 2 ± 2% of label; mitochondria: 2 ± 1% of label; 982 gold particles, nine cells. (Scale bar, 500 nm.)
To complement the microscopy studies, a biochemical approach was used to test for TPC2 localization to melanosomes. A postnuclear supernatant extract of MNT-1 cells transfected with a TPC2-GFP plasmid was submitted to immunomagnetic isolation of organelles, using an anti-GFP antibody or an irrelevant antibody as a control. Immunoblotting analysis revealed the presence of the melanosome resident proteins tyrosinase, PMEL17, and Rab32 in the anti-GFP immunoisolated samples, thus confirming the presence of TPC2 in melanosomes (Fig. 1E).
TPC2 Expression Level Determines the Overall Melanin Content.
Once it was established that TPC2 is expressed in melanosomes, we investigated the effect of knocking out TPCN2 in MNT-1 cells. The first exon of the TPCN2 gene was excised, using the CRISPR/Cas9 system (Fig. 1A, Left), and the deletion was confirmed by genotyping of two independent clones: TPC2-KO1 and TPC2-KO2 (Fig. S1). Real-time PCR of the TPC2-KO clones confirmed negligible TPC2 mRNA expression (Fig. 2A). When the TPC2-KO1 and TPC2-KO2 cells were pelleted, they appeared strikingly darker than wild-type MNT-1 cells. Quantification of their melanin content revealed a fourfold increase in total melanin compared with wild-type cells (Fig. 2B). Importantly, in rescue experiments carried out by transfecting a TPC2-GFP plasmid, the melanin content of the TPC2-KO cells was restored to levels similar to wild-type cells, indicating specificity (Fig. 2C). As an independent approach, we subjected MNT-1 cells and primary human melanocytes to TPC2 siRNA and control siRNA knockdown and determined the total melanin content. Following the same trend as the TPC2-KO cells, the TPC2 siRNA treated MNT-1 cells and primary melanocytes more than doubled the melanin content of the corresponding control siRNA-treated cells (Fig. S4). Conversely, overexpression of TPC2-GFP in control MNT-1 cells had the opposite effect, significantly reducing the melanin content (Fig. S4). Overall, these results demonstrate an inverse correlation between TPC2 expression level and melanin content in MNT-1 cells and primary human melanocytes.
Fig. 2.

TPC2 expression level determines the melanin content in MNT-1 cells. (A) RNA was isolated from wild-type MNT-1 cells or two independent clones of CRISPR/Cas9 TPC2-KO homozygous cells and reverse-transcribed into cDNA. Relative amounts of the TPC2 mRNA were determined in triplicate by real-time PCR. (B) Melanin content was determined for the cells in A. (C) Melanin content was determined for mock-transfected wild-type MNT-1 cells, CRISPR/Cas9 TPC2-KO cells, and TPC2-GFP transfected TPC2-KO cells 5 d posttransfection (n = 2 for WT+Mock, n = 3 for TPC2-KO+Mock, and n = 9 for TPC2-KO+TPC2-GFP cells).
Fig. S4.
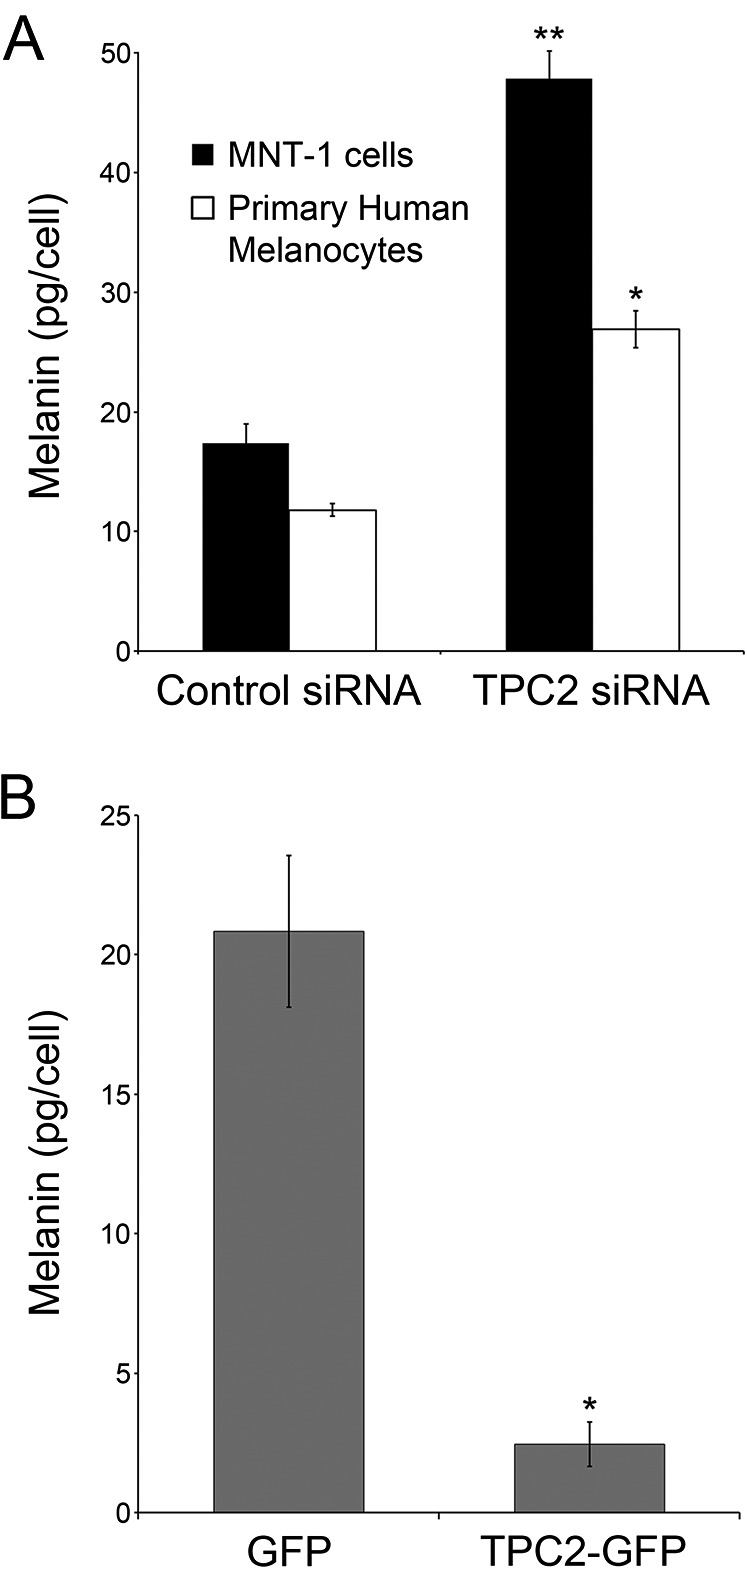
TPC2 expression level and melanin content are inversely correlated in MNT-1 cells and primary human melanocytes. (A) Melanin content was determined in MNT-1 cells (black bars) and primary human melanocytes (white bars) subjected to control siRNA and TPC2 siRNA. (B) Melanin content was determined in MNT-1 cells transfected with GFP and TPC2-GFP plasmids.
TPC2 Regulates Melanosome Luminal pH.
Tyrosinase is the key enzyme in melanin synthesis, and its catalytic activity is low at acidic pH and high at neutral pH (2, 7, 8, 10). Therefore, an increase in melanosome luminal pH in the TPC2-KO cells may be responsible for the increase in melanin content in these cells. Accordingly, we investigated the effect of both TPC2 expression level and activity on melanosome luminal pH. To this end, we engineered a genetically encoded melanosome-localized pH sensor (MELOPS) capable of detecting pH changes in the melanosome lumen of living cells. MELOPS was created by inserting the coding sequence of the pH sensor protein Nectarine (25) into the first luminal loop of the melanosome protein OCA2, the product of the gene mutated in oculocutaneous albinism type 2 (Fig. S5). This OCA2 loop was previously used to add other tags without affecting the protein trafficking and function (26). Providing OCA2 functions in chloride transport, we used the nonconductive V443I pore mutant to avoid any change MELOPS expression might cause on melanosomal pH (9). The feasibility of using MELOPS to measure melanosomal pH was tested by expressing it in MNT-1 cells and incubating the cells in buffers with pH values ranging from 4.5 to 6.5 in the presence of ionophores (27). Fluorescence microscopy imaging analysis revealed MELOPS colocalizes with the melanosomal marker tyrosinase-iRFP (MOC = 0.52 ± 0.02), and its fluorescence intensity is proportional to the pH of the buffers from pH 5.0 to 6.5 (Fig. S5). Using this calibration curve as a reference, the melanosome luminal pH in control MNT-1 cells was calculated as 5.7 ± 0.6 (44 cells; Fig. S5).
Fig. S5.

Design and validation of MELOPS, a genetically encoded melanosome localized pH sensor. (A) Cartoon illustrating MELOPS is built on the basis of the oculocutaneous albinism type 2 (OCA2) protein. The pH-sensitive fluorescent protein Nectarine was inserted in the loop connecting the first and second transmembrane domains, which is exposed to the organelle lumen. The OCA2 V443I mutation that renders the OCA2 channel inactive was also introduced. (B) MNT-1 cells were transfected with MELOPS and incubated in buffers with pH values ranging from 4.5 to 6.5 in the presence of ionophores. The graph indicates the fluorescence intensity of MELOPS is proportional to the pH of the buffers from pH 5.0 up to pH 6.5 (R2 = 0.99; pH, 4.5: 32 cells; pH, 5.0: 30 cells; pH, 5.5: 34 cells; pH, 6.0: 36 cells; pH, 6.5: 29 cells). (C) Spinning-disk confocal fluorescence microscopy image of a cell incubated at pH 6.5, showing the high degree of colocalization between MELOPS and Tyrosinase-iRFP. (Scale bar, 5 µm.) (D) Spinning-disk confocal fluorescence microscopy image of live wild-type MNT-1 cells expressing MELOPS and tyrosinase-iRFP. The graph shown in B was used to interpolate the luminal melanosomal pH of MNT-1 cells (pH, 5.7 ± 0.6; 44 cells). (Scale bar, 5 µm.)
Then, we expressed MELOPS in wild-type and TPC2-KO MNT-1 cells and determined higher fluorescence intensity, and therefore a higher melanosomal pH in TPC2-KO cells (Fig. 3 A and B). This effect can be rescued by transient transfection of TPC2-iRFP in the TPC2-KO cells, corroborating the lack of TPC2 caused the pH increase in the melanosome lumen (Fig. 3 A and B). Consistently, primary human melanocytes subjected to TPC2 siRNA knockdown also showed higher melanosomal pH than control siRNA-treated cells (Fig. S6). Conversely, overexpression of TPC2-GFP in primary human melanocytes caused a lower melanosomal pH, relative to control cells (Fig. S6). TPC2 overexpression in wild-type MNT-1 cells also causes a decrease in melanosomal pH that can be blocked by the TPC2-specific inhibitors Ned19 and tetrandrine (Fig. S7) (28). Furthermore, incubation of wild-type MNT-1 cells with the TPC2-specific inhibitor Ned19 produced a significant increase in their melanin content relative to MNT-1 cells treated with vehicle (Fig. S7). The data all together demonstrate a tight inverse correlation between TPC2 expression level and melanosome luminal pH. The fact that Ned19 and tetrandrine inhibit the effect of TPC2 on melanosomal pH indicates ion flux through TPC2 is required to exert this function. These results explain, at least in part, the increase in melanin content of TPC2-deficient MNT-1 cells and primary melanocytes, as well as the decrease in melanin content of MNT-1 cells overexpressing TPC2.
Fig. 3.

TPC2 regulates melanosome luminal pH. (A) Wild-type or CRISPR TPC2-KO MNT-1 cells expressing MELOPS and tyrosinase-iRFP were analyzed by confocal fluorescence microscopy. In a rescue experiment performed in parallel, TPC2-KO MNT-1 cells expressing MELOPS and TPC2-iRFP were also analyzed. (Scale bar, 5 µm.) (B) The average MELOPS fluorescence intensity was determined for all treatments (WT+Tyr = 30 cells; TPC2-KO+Tyr = 25 cells; TPC2-KO+TPC2 = 21 cells).
Fig. S6.

TPC2 regulates melanosomal pH in primary human melanocytes. (A and B) The average fluorescence intensity of MELOPS was determined for primary human melanocytes subjected to either control siRNA (n = 38 cells) or TPC2 siRNA knockdown (n = 44 cells). (C and D) The average fluorescence intensity of MELOPS was determined for primary human melanocytes overexpressing LAMP2-GFP as a control (n = 47 cells) or TPC2-GFP (n = 50 cells).
Fig. S7.

TPC2 inhibitors alkalize the melanosomal lumen and increase melanin content in MNT-1 cells. (A) The average fluorescence intensity of MELOPS was determined for MNT-1 cells overexpressing LAMP2-GFP, as a control (n = 31 cells), or for TPC2-GFP, and treated for 1 h with vehicle (DMSO; n = 28 cells) or the TPC2 inhibitors Ned19 (100 µM; n = 36 cells) and tetrandrine (2 µM; n = 36 cells). (B) Melanin content was determined for MNT-1 cells treated with DMSO or Ned19 (100 µM) for 6 d.
TPC2 Regulates Melanosome Size.
During the course of our studies, we noticed that melanosomes imaged with various markers appeared to be larger in TPC2-KO MNT-1 cells than in wild-type MNT-1 cells. To better investigate this possibility, we used Rab27a, a well-established marker of pigmented melanosomes (29, 30) that in our hands produces the most crisp confocal fluorescence microscopy images. Wild-type and TPC2-KO MNT-1 cells were transfected with a plasmid expressing Cherry-Rab27a and subjected to live cell confocal fluorescence microscopy analysis (Fig. 4A). Quantification of the images using the Slidebook software automated object analysis function showed no increase in the number of melanosomes per cell in TPC2-KO MNT-1 cells compared with wild-type cells (264 ± 89 and 285 ± 115, respectively; n = 41 and 37 cells). However, the analysis revealed melanosomes in TPC2-KO MNT-1 cells were significantly larger than those in wild-type cells (Fig. 4 A and B).
Fig. 4.

TPC2 regulates melanosome size. (A) Wild-type or CRISPR TPC2-KO MNT-1 cells expressing Cherry-Rab27a were analyzed by confocal fluorescence microscopy. Insets are magnifications of the boxed regions. (Scale bar, 5 µm.) (B) The average melanosome size was measured for wild-type and TPC2-KO cells (n = 37 and 41 cells, respectively). (C) Electron micrographs of wild-type (Left) or CRISPR TPC2-KO (Right) MNT-1 cells (18,500×). Roman numerals indicate melanosome maturation stage. (Scale bar, 500 nm.) (D) The average stage II–IV melanosome size was measured for wild-type and TPC2-KO cells (wild-type: seven cells, 464 melanosomes; TPC2-KO: nine cells, 567 melanosomes).
To confirm this result, we analyzed wild-type and CRISPR TPC2-KO MNT-1 cells by thin-section electron microscopy (Fig. 4 C and D and Fig. S8). Once again, we found that the total amount of melanosomes per cell did not differ between wild-type and TPC2-KO cells (66 ± 19 and 63 ± 19 melanosome stages II–IV per cell or thin section, respectively), but TPC2-KO cells showed strikingly larger melanosomes than wild-type MNT-1 cells (Fig. 4 C and D and Fig. S8). TPC2-KO MNT-1 cells also revealed more heavily pigmented melanosomes than wild-type cells (Fig. 4C and Fig. S8). These results indicate that TPC2 regulates melanosome size and are consistent with higher pigment content in TPC2-deficient MNT-1 cells compared with control cells.
Fig. S8.

Larger thin-section electron micrographs of the wild-type (Upper) and CRISPR TPC2-KO (Lower) MNT-1 cells shown in Fig. 4 (18,500×). (Scale bars, 500 nm.)
TPC2 Regulates Ca2+ Release from Melanosomes.
TPC2 is a Ca2+ channel, and therefore we reasoned that Ca2+ release from melanosomes into the cytosol could be affected in TPC2-KO cells. To detect Ca2+ released from melanosomes, we attached the genetically encoded Ca2+ sensor GCaMP6 (31) to the C-terminal cytosolic tail of tyrosinase, which is expressed on the cytosolic side of the melanosome membrane. A similar approach was previously used to measure TPC2-mediated Ca2+ release from other organelles such as platelet dense granules and lysosomes (17, 32). Indeed, TPC2-KO cells exhibited a reduced level of GCaMP6 fluorescence intensity, indicative of lower local Ca2+ concentration, compared with wild-type cells (Fig. 5 A and B). Similar experiments were carried out with tyrosinase-GCaMP6-Cherry, a construct in which Cherry was added at the C terminus of tyrosinase-GCaMP6 to obtain a ratiometric measurement of fluorescence intensity. The TPC2-KO cells exhibited lower GCaMP6/Cherry fluorescence intensity ratio compared with wild-type cells, which is indicative of lower levels of Ca2+ around melanosomes (Fig. S9). Together, these data suggests normal Ca2+ release from melanosomes depends on the presence of TPC2 in these organelles.
Fig. 5.

TPC2 regulates Ca2+ release from melanosomes. (A) Wild-type or CRISPR TPC2-KO MNT-1 cells expressing tyrosinase-GCaMP6 were analyzed by confocal fluorescence microscopy. (Scale bar, 5 µm.) (B) The tyrosinase-GCaMP6 fluorescence intensity was determined for wild-type and TPC2-KO cells (n = 37 and 41 cells, respectively).
Fig. S9.

TPC2 regulates Ca2+ release from melanosomes. (A) Spinning-disk confocal fluorescence microscopy images of live wild-type and TPC2-KO MNT-1 cells expressing tyrosinase-GCaMP6-Cherry. (Scale bars, 5 µm.) (B) The green/red fluorescence intensity ratio was calculated for wild-type and TPC2-KO MNT-1 cells expressing tyrosinase-GCaMP6-Cherry (n = 17 and 19 cells, respectively).
Discussion
The complexity of human pigmentation results from hundreds of proteins functioning in melanocyte development, melanosome biogenesis, melanin synthesis, and melanosome transfer to neighboring keratinocytes in skin and hair (1, 2, 7, 12). Even though two TPC2 polymorphisms have been associated with pigmentation variations in a genome-wide association study (13), it is unknown where and how TPC2 works to bring about such diversity. Here, we first show that TPC2 is expressed in melanocytes, and a significant cohort localizes to the melanosome-limiting membrane with a smaller fraction localizing to endosomes and lysosomes, as found in other cell types. TPC2 expressed from the endogenous gene in MNT-1 cells colocalizes with melanosome markers such as tyrosinase, Rab27a, and TYRP1 by confocal fluorescence microscopy. Similarly, immunogold electron microscopy analysis of MNT-1 cells showed that both endogenous and exogenous TPC2 localize to pigmented melanosomes. Biochemical experiments confirmed the presence of TPC2 in melanosomes. Second, the melanin content was substantially increased in CRISPR TPC2 knockout and siRNA TPC2-depleted MNT-1 cells, as well as siRNA TPC2-depleted primary human melanocytes. Consistently, TPC2 inhibition by Ned19 caused an increase in melanin content in MNT-1 cells. Conversely, higher TPC2 expression resulted in lower melanin content in MNT-1 cells. These results demonstrate an inverse correlation between the level of TPC2 expression and melanin content in MNT-1 cells and primary melanocytes. The data show experimentally that TPC2 indeed regulates pigmentation, thus confirming the genome-wide association study (13), and that TPC2 works in melanocytes by controlling the amount of melanin produced by melanosomes.
How does TPC2 regulate the amount of melanin in melanocytes? Melanosome pH is a key determinant of melanin synthesis in melanosomes because of its effect on the catalytic activity of the rate-limiting enzyme tyrosinase (2, 7). In addition, spontaneous late reactions of eumelanin polymerization that take place after the Dopachrome stage are also pH-dependent (33). In both the enzymatic and nonenzymatic reactions, a lower pH decreases the amount of melanin produced. Consistently, indirect determinations with fixed cells showed melanosomes from light skin melanocytes are more acidic than those from dark skin melanocytes (8, 10). To study melanosome pH, we developed MELOPS, the first genetically encoded melanosome localized pH sensor that allows live cell determinations. MELOPS should be a useful tool in melanosome research to dissect the effect of pH by a variety of pigmentation genes. Using MELOPS, we established an increase in the melanosome lumen pH in live TPC2-KO MNT-1 cells compared with wild-type MNT-1 cells. Likewise, primary human melanocytes subjected to TPC2 siRNA knockdown displayed higher melanosome lumen pH, whereas overexpression of TPC2 elicited lower melanosome lumen pH relative to control melanocytes. Furthermore, overexpression of TPC2 in MNT-1 cells produced a decrease in melanosomal pH that could be blocked using the TPC2-specific inhibitors Ned19 or tetrandrine (28). These results both supported the concept of an anticorrelation between melanosomal pH and TPC2 expression levels and indicated that TPC2 activity regulates melanosomal pH. Therefore, TPC2 controls melanin synthesis in melanocytes, at least in part, through regulation of melanosomal pH. It is worth noting that TPC2 has also been reported to regulate the pH of lysosomes and platelet-dense granules, and the gene is present in evolutionarily distant eukaryotes such as plants (14, 17). Thus, melanosomes seem to have incorporated and adapted an ancient component of the pH regulatory machinery of membrane-bound compartments.
A key factor regulating organelle pH is the vacuolar (V)-ATPase, which is also present in melanosomes (2, 33). Several other ion channels and transporters involved in human pigmentation are present in the melanosome-limiting membrane. The recently described OCA2-mediated Cl− channel regulates melanin synthesis in part through melanosome pH (7, 9). The melanosome-localized K+-dependent Na+/Ca2+ exchanger, SLC24A5, regulates pigmentation, potentially through pH changes (2, 34). The SLC45A2 gene (member of the solute carrier 45A family) is responsible for the OCA4 disease and affects pigmentation through melanosome pH, although the identity of the molecule or molecules transported by this carrier is unknown (35). TPC2 thus joins a growing list of melanosome-localized ion channels and transporters that regulate pigmentation at least in part through regulation of organelle pH. Therefore, the melanosome luminal pH appears to be determined by a complex cross talk between channels, transporters, and pumps that control not only the amount but also the type of melanin produced by the melanosome. Additional work is needed to understand how TPC2 may regulate melanosome pH.
The second determinant of pigmentation we found to be regulated by TPC2 is the melanosome size. Melanosomes in MNT-1 cells lacking TPC2 are remarkably larger than in wild-type cells. However, the melanosome count did not differ between wild-type and TPC2-KO cells. This result implies an increase in melanin content per melanosome in TPC2-KO cells, which was evident in the electron micrographs. The data are also consistent with the fact that melanosomes in dark skin are larger than those from light skin people (11). Interestingly, TPC2 has been implicated in membrane trafficking events in other cell types. TPC2 was recently shown to function in endolysosomal trafficking in the context of Ebola virus infection (28) and in regulation of membrane fusion/fission events between platelet-dense granules (17). A function of TPC2 in regulation of membrane trafficking would also be in line with its reported physical interaction with the endolysosome tethering and fusion machinery (18, 36). Such membrane dynamic events are regulated by Ca2+. Our results showing TPC2-KO MNT-1 cells have a reduced [Ca2+] on the cytosolic side of the melanosome membrane suggest a decreased Ca2+ release and are consistent with altered membrane traffic.
In summary, our results show experimentally that TPC2 is a true regulator of pigmentation. Importantly, TPC2 is expressed in the melanosome membrane, and its activity controls the melanin content of melanosomes, most likely by regulating organelle pH and size.
Materials and Methods
CRISPR Design.
Guide RNAs were designed using the CRISPR Design Tool [crispr.mit.edu (37)] to minimize potential off-target effects. Annealing, phosphorylation, and cloning of the guide RNAs (Table S1) into the pX330 vector were carried out as described (24). For the TPC2-EmGFP donor plasmid, the left and right homology arms (855 and 904 bp, respectively) were amplified from genomic DNA, and mutations were introduced in the PAM sequences to avoid cleavage of the modified alleles. Genotyping was performed using the primers listed in Table S2.
Table S1.
Oligonucleotides used for sgRNA cloning into pX330 vector
| sgRNA name | Direction | Sequence 5′ to 3′ | Modification |
| sgRNA1 | F | caccgCGCGCACGGCACTGTGGCGC | TPC2-KO |
| R | aaacGCGCCACAGTGCCGTGCGCGc | ||
| sgRNA2 | F | caccgACCAGGTTCGAGTCCGAGCG | |
| R | aaacCGCTCGGACTCGAACCTGGTc | ||
| sgRNA3 | F | caccgGGCGCGCCCGGCAGAAAGCG | |
| R | aaacCGCTTTCTGCCGGGCGCGCCc | ||
| sgRNA4 | F | caccgTAGTGGCTACATCCATCCTG | TPC2-EmGFP |
| R | aaacCAGGATGGATGTAGCCACTAc | ||
| sgRNA5 | F | caccgCCAGCTTAGTGGTCCGTCAG | |
| R | aaacCTGACGGACCACTAAGCTGGc |
Table S2.
Oligonucleotides used for genotyping
| Name | Sequence 5′ to 3′ |
| OUT-Fwd-N | GGAACGAAGCTGAGCTCCACCCTAGAGG |
| OUT-Rev-N | GGATCAGGACGCGACACGGAAGAGAC |
| OUT-Fwd-C | TCCTGGCAGCTTTGAGATGG |
| OUT-Rev-C | GAAAGGTCCCTGTGGAGTCG |
Other Procedures.
Additional procedures are described in SI Materials and Methods and Table S3.
Table S3.
Oligonucleotides used for real-time PCR
| Target | Primer name | Direction | Sequence 5′ to 3′ |
| TPC2 | TPC2-N | F | CTGACCACTTACCGCAGCAT |
| R | AGTCCGTTGGCATACGTTCG | ||
| GAPDH | GAPDH | F | TGTTGCCATCAATGACCCCT |
| R | TCGCCCCACTTGATTTTGGA |
SI Materials and Methods
Plasmids.
We previously reported the generation, validation, and use of human TPC2, tyrosinase, and Rab27a constructs (17, 38). Here, they were subcloned into pmCherry, pGP-CMV-GCaMP6m [Addgene 40754 (31)], and piRFP682-N1 [Addgene 45459 (39)], as indicated and confirmed by DNA sequencing. Tyrosinase-GCaMP6-Cherry was created by cloning mCherry after GCaMP6. MELOPS was engineered by replacing the triple HA tag in pCR3-OCA2-HA [gift from M. S. Marks (40)] with Nectarine [Addgene 21717 (25)]. Site-directed mutagenesis was performed with Quickchange II kit (Agilent Technologies) to introduce the OCA2-V443I mutation in MELOPS. mRFP-SKL was a gift from P. K. Kim. The pX330-U6-Chimeric_BB-CBh-hSpCas9 was a gift from F. Zhang [Addgene 42230 (41)].
Cell Culture.
Human MNT-1 cell culture, nucleofection, and siRNA treatment were performed as described (22, 37). Oligonucleotides (Sigma) used for siRNA: negative control (SIC001-10 NMOL) and TPC2 siRNA1 (SASI_Hs01_00129376), as described previously (17). Nonidentified human neonatal epidermal melanocytes were obtained from a commercial source (ThermoFisher Scientific Catalog no. C0025C) and cultured in supplemented Medium 254, following manufacturer specifications. Ned19 was from Santa Cruz and Tetrandrine from Sigma.
Fluorescence and Electron Microscopy.
Cells were imaged as previously described (17, 38, 42), using a temperature-controlled chamber at 37 °C and 5% CO2 on an Olympus IX81 spinning disk confocal microscope with Photometrics Cascade II camera, a 100×/1.40NA objective, and phasor holographic photobleaching/photoactivation system (3i). Excitation was performed with diode lasers of 473 nm (GFP, GCaMP6), 561 nm (mCherry, mNectarine), and 658 nm (iRFP). The microscope has a CSU 22 head with quad dichroic and additional emission filter wheels to eliminate spectral crossover. The following emission filters were used: 521 ± 12.5 nm, 607 ± 12.5 nm, and 700 ± 12.5 nm. Fixation and immunofluorescence staining were performed as described (22). The monoclonal mouse anti-TYRP1 antibody (MEL5, clone Ta99) was from Santa Cruz. The Alexa-546-conjugated anti-mouse secondary antibody was from Invitrogen. Images from both fixed and live cells were acquired and analyzed with Slidebook 5.5 software (3i). The colocalization module with auto threshold was used to determine the MOC of two-color images processed with a Laplacian 2D filter. High-pressure freezing, fixation, immunogold labeling, and electron microscopy were performed as described (38, 42). The Lowicryl HM20 resin was used for immunogold-labeling experiments, and images were taken on a JEOL2000 microscope (Fig. 1 and Fig. S3). The Epon resin was used for melanosome size and number quantification, and images were taken on a FEI Tecnai Spirit BioTwin microscope and analyzed with ImageJ (Fig. 4 and Fig. S8). Rabbit TPCN2 antibody was from Sigma, and the anti-GFP antibody was a gift from T. Giddings. Coloidal gold-complexed secondary antibodies (18 nm) were from Jackson Immunoresearch.
Biochemical Procedures.
MNT-1 postnuclear supernatant was prepared as described (42). Immunomagnetic isolation of organelles was carried out using protein G magnetic beads (Life Technologies) and 2 µg rabbit anti-GFP (gift from G. Payne) or an irrelevant rabbit IgG. For immunoblotting, proteins were fractionated on precast 4–20% gradient SDS/polyacrylamide gels (Life Technologies) and transferred by electroblotting to PVDF membranes. Membranes were incubated sequentially with blocking buffer, primary antibody [mouse anti-GFP; Roche), mouse anti-Tyrosinase (T311; Santa Cruz), mouse anti-PMEL17 (HMB45; Dako), and affinity-purified rat anti-Rab32 (22)], and horseradish peroxidase-conjugated secondary antibody (GE Amersham), as described (42). Bound antibodies were detected by using ECL Prime Western blotting reagent (GE Amersham).
RNA Analysis.
Total RNA from MNT-1 cells or primary neonatal melanocytes was isolated using the Aurum Total RNA Mini kit (BioRad), following the manufacturer’s instructions, and 500 ng purified RNA was used in reverse-transcription reactions using the iScript cDNA synthesis kit (BioRad). Relative amounts of each transcript were determined in triplicate by real-time PCR, using gene-specific primers (Table S3).
Melanin Determination.
Melanocytes (500,000 cells) were pelleted and solubilized in 500 μL 1N NaOH/10% DMSO for 2 h at 80 °C. The samples were centrifuged at 16,900 × g for 10 min at room temperature, and the absorbance at 490 nm of the supernatants was measured using a plate reader. Melanin content was determined by interpolation from a standard curve generated with purified melanin from Sepia officinalis (Sigma). Unless noted otherwise, results are the average of two independent experiments determined in duplicate.
Statistical Analysis.
Details on statistical analysis and n values are provided in the figure legends. Error bars indicate mean ± SEM. Statistical significance was determined via Student’s t test: *P ≤ 0.05; **P ≤ 0.01; ***P ≤ 0.001; ****P ≤ 0.0001.
Acknowledgments
We thank T. Giddings and C. Ozzello for help with high-pressure freezing and electron microscopy, and M. Marks, G. Payne, and P. Kim for their generous gifts of reagents. This work was supported by NIH grant R01HL106186 (to S.M.D.).
Footnotes
The authors declare no conflict of interest.
This article is a PNAS Direct Submission. G.R. is a guest editor invited by the Editorial Board.
This article contains supporting information online at www.pnas.org/lookup/suppl/doi:10.1073/pnas.1600108113/-/DCSupplemental.
References
- 1.Sturm RA. Molecular genetics of human pigmentation diversity. Hum Mol Genet. 2009;18(R1):R9–R17. doi: 10.1093/hmg/ddp003. [DOI] [PubMed] [Google Scholar]
- 2.Kondo T, Hearing VJ. Update on the regulation of mammalian melanocyte function and skin pigmentation. Expert Rev Dermatol. 2011;6(1):97–108. doi: 10.1586/edm.10.70. [DOI] [PMC free article] [PubMed] [Google Scholar]
- 3.Raposo G, Marks MS. Melanosomes--dark organelles enlighten endosomal membrane transport. Nat Rev Mol Cell Biol. 2007;8(10):786–797. doi: 10.1038/nrm2258. [DOI] [PMC free article] [PubMed] [Google Scholar]
- 4.Orlow SJ. Melanosomes are specialized members of the lysosomal lineage of organelles. J Invest Dermatol. 1995;105(1):3–7. doi: 10.1111/1523-1747.ep12312291. [DOI] [PubMed] [Google Scholar]
- 5.Huizing M, Helip-Wooley A, Westbroek W, Gunay-Aygun M, Gahl WA. Disorders of lysosome-related organelle biogenesis: Clinical and molecular genetics. Annu Rev Genomics Hum Genet. 2008;9:359–386. doi: 10.1146/annurev.genom.9.081307.164303. [DOI] [PMC free article] [PubMed] [Google Scholar]
- 6.Yamaguchi Y, Brenner M, Hearing VJ. The regulation of skin pigmentation. J Biol Chem. 2007;282(38):27557–27561. doi: 10.1074/jbc.R700026200. [DOI] [PubMed] [Google Scholar]
- 7.Ito S, Wakamatsu K. Human hair melanins: What we have learned and have not learned from mouse coat color pigmentation. Pigment Cell Melanoma Res. 2011;24(1):63–74. doi: 10.1111/j.1755-148X.2010.00755.x. [DOI] [PubMed] [Google Scholar]
- 8.Fuller BB, Spaulding DT, Smith DR. Regulation of the catalytic activity of preexisting tyrosinase in black and Caucasian human melanocyte cell cultures. Exp Cell Res. 2001;262(2):197–208. doi: 10.1006/excr.2000.5092. [DOI] [PubMed] [Google Scholar]
- 9.Bellono NW, Escobar IE, Lefkovith AJ, Marks MS, Oancea E. An intracellular anion channel critical for pigmentation. eLife. 2014;3:e04543. doi: 10.7554/eLife.04543. [DOI] [PMC free article] [PubMed] [Google Scholar]
- 10.Smith DR, Spaulding DT, Glenn HM, Fuller BB. The relationship between Na(+)/H(+) exchanger expression and tyrosinase activity in human melanocytes. Exp Cell Res. 2004;298(2):521–534. doi: 10.1016/j.yexcr.2004.04.033. [DOI] [PubMed] [Google Scholar]
- 11.Sturm RA, Box NF, Ramsay M. Human pigmentation genetics: The difference is only skin deep. BioEssays. 1998;20(9):712–721. doi: 10.1002/(SICI)1521-1878(199809)20:9<712::AID-BIES4>3.0.CO;2-I. [DOI] [PubMed] [Google Scholar]
- 12.Lamoreux ML, Delmas V, Larue L, Bennett DC. The Colors of Mice: A Model Genetic Network. 1st Ed Wiley-Blackwell; Hoboken: 2010. [Google Scholar]
- 13.Sulem P, et al. Two newly identified genetic determinants of pigmentation in Europeans. Nat Genet. 2008;40(7):835–837. doi: 10.1038/ng.160. [DOI] [PubMed] [Google Scholar]
- 14.Morgan AJ, Galione A. Two-pore channels (TPCs): Current controversies. BioEssays. 2014;36(2):173–183. doi: 10.1002/bies.201300118. [DOI] [PubMed] [Google Scholar]
- 15.Zhu MX, et al. Calcium signaling via two-pore channels: Local or global, that is the question. Am J Physiol Cell Physiol. 2010;298(3):C430–C441. doi: 10.1152/ajpcell.00475.2009. [DOI] [PMC free article] [PubMed] [Google Scholar]
- 16.Calcraft PJ, et al. NAADP mobilizes calcium from acidic organelles through two-pore channels. Nature. 2009;459(7246):596–600. doi: 10.1038/nature08030. [DOI] [PMC free article] [PubMed] [Google Scholar]
- 17.Ambrosio AL, Boyle JA, Di Pietro SM. TPC2 mediates new mechanisms of platelet dense granule membrane dynamics through regulation of Ca2+ release. Mol Biol Cell. 2015;26(18):3263–3274. doi: 10.1091/mbc.E15-01-0058. [DOI] [PMC free article] [PubMed] [Google Scholar]
- 18.Lin-Moshier Y, et al. The Two-pore channel (TPC) interactome unmasks isoform-specific roles for TPCs in endolysosomal morphology and cell pigmentation. Proc Natl Acad Sci USA. 2014;111(36):13087–13092. doi: 10.1073/pnas.1407004111. [DOI] [PMC free article] [PubMed] [Google Scholar]
- 19.Raposo G, Tenza D, Murphy DM, Berson JF, Marks MS. Distinct protein sorting and localization to premelanosomes, melanosomes, and lysosomes in pigmented melanocytic cells. J Cell Biol. 2001;152(4):809–824. doi: 10.1083/jcb.152.4.809. [DOI] [PMC free article] [PubMed] [Google Scholar]
- 20.Hurbain I, et al. Electron tomography of early melanosomes: Implications for melanogenesis and the generation of fibrillar amyloid sheets. Proc Natl Acad Sci USA. 2008;105(50):19726–19731. doi: 10.1073/pnas.0803488105. [DOI] [PMC free article] [PubMed] [Google Scholar]
- 21.Theos AC, et al. Functions of adaptor protein (AP)-3 and AP-1 in tyrosinase sorting from endosomes to melanosomes. Mol Biol Cell. 2005;16(11):5356–5372. doi: 10.1091/mbc.E05-07-0626. [DOI] [PMC free article] [PubMed] [Google Scholar]
- 22.Bultema JJ, Ambrosio AL, Burek CL, Di Pietro SM. BLOC-2, AP-3, and AP-1 proteins function in concert with Rab38 and Rab32 proteins to mediate protein trafficking to lysosome-related organelles. J Biol Chem. 2012;287(23):19550–19563. doi: 10.1074/jbc.M112.351908. [DOI] [PMC free article] [PubMed] [Google Scholar]
- 23.Di Pietro SM, et al. BLOC-1 interacts with BLOC-2 and the AP-3 complex to facilitate protein trafficking on endosomes. Mol Biol Cell. 2006;17(9):4027–4038. doi: 10.1091/mbc.E06-05-0379. [DOI] [PMC free article] [PubMed] [Google Scholar]
- 24.Ran FA, et al. Genome engineering using the CRISPR-Cas9 system. Nat Protoc. 2013;8(11):2281–2308. doi: 10.1038/nprot.2013.143. [DOI] [PMC free article] [PubMed] [Google Scholar]
- 25.Johnson DE, et al. Red fluorescent protein pH biosensor to detect concentrative nucleoside transport. J Biol Chem. 2009;284(31):20499–20511. doi: 10.1074/jbc.M109.019042. [DOI] [PMC free article] [PubMed] [Google Scholar]
- 26.Sitaram A, et al. Localization to mature melanosomes by virtue of cytoplasmic dileucine motifs is required for human OCA2 function. Mol Biol Cell. 2009;20(5):1464–1477. doi: 10.1091/mbc.E08-07-0710. [DOI] [PMC free article] [PubMed] [Google Scholar]
- 27.Lu Y, et al. Two pore channel 2 (TPC2) inhibits autophagosomal-lysosomal fusion by alkalinizing lysosomal pH. J Biol Chem. 2013;288(33):24247–24263. doi: 10.1074/jbc.M113.484253. [DOI] [PMC free article] [PubMed] [Google Scholar] [Retracted]
- 28.Sakurai Y, et al. Ebola virus. Two-pore channels control Ebola virus host cell entry and are drug targets for disease treatment. Science. 2015;347(6225):995–998. doi: 10.1126/science.1258758. [DOI] [PMC free article] [PubMed] [Google Scholar]
- 29.Wu X, et al. Rab27a enables myosin Va-dependent melanosome capture by recruiting the myosin to the organelle. J Cell Sci. 2001;114(Pt 6):1091–1100. doi: 10.1242/jcs.114.6.1091. [DOI] [PubMed] [Google Scholar]
- 30.Hume AN, et al. Rab27a regulates the peripheral distribution of melanosomes in melanocytes. J Cell Biol. 2001;152(4):795–808. doi: 10.1083/jcb.152.4.795. [DOI] [PMC free article] [PubMed] [Google Scholar]
- 31.Chen TW, et al. Ultrasensitive fluorescent proteins for imaging neuronal activity. Nature. 2013;499(7458):295–300. doi: 10.1038/nature12354. [DOI] [PMC free article] [PubMed] [Google Scholar]
- 32.Medina DL, et al. Lysosomal calcium signalling regulates autophagy through calcineurin and TFEB. Nat Cell Biol. 2015;17(3):288–299. doi: 10.1038/ncb3114. [DOI] [PMC free article] [PubMed] [Google Scholar]
- 33.Ito S, Suzuki N, Takebayashi S, Commo S, Wakamatsu K. Neutral pH and copper ions promote eumelanogenesis after the dopachrome stage. Pigment Cell Melanoma Res. 2013;26(6):817–825. doi: 10.1111/pcmr.12137. [DOI] [PubMed] [Google Scholar]
- 34.Lamason RL, et al. SLC24A5, a putative cation exchanger, affects pigmentation in zebrafish and humans. Science. 2005;310(5755):1782–1786. doi: 10.1126/science.1116238. [DOI] [PubMed] [Google Scholar]
- 35.Bin BH, et al. Membrane-Associated Transporter Protein (MATP) Regulates Melanosomal pH and Influences Tyrosinase Activity. PLoS One. 2015;10(6):e0129273. doi: 10.1371/journal.pone.0129273. [DOI] [PMC free article] [PubMed] [Google Scholar]
- 36.Grimm C, et al. High susceptibility to fatty liver disease in two-pore channel 2-deficient mice. Nat Commun. 2014;5:4699. doi: 10.1038/ncomms5699. [DOI] [PubMed] [Google Scholar]
- 37.Hsu PD, et al. DNA targeting specificity of RNA-guided Cas9 nucleases. Nat Biotechnol. 2013;31(9):827–832. doi: 10.1038/nbt.2647. [DOI] [PMC free article] [PubMed] [Google Scholar]
- 38.Bultema JJ, et al. Myosin vc interacts with Rab32 and Rab38 proteins and works in the biogenesis and secretion of melanosomes. J Biol Chem. 2014;289(48):33513–33528. doi: 10.1074/jbc.M114.578948. [DOI] [PMC free article] [PubMed] [Google Scholar]
- 39.Shcherbakova DM, Verkhusha VV. Near-infrared fluorescent proteins for multicolor in vivo imaging. Nat Methods. 2013;10(8):751–754. doi: 10.1038/nmeth.2521. [DOI] [PMC free article] [PubMed] [Google Scholar]
- 40.Sitaram A, et al. Differential recognition of a dileucine-based sorting signal by AP-1 and AP-3 reveals a requirement for both BLOC-1 and AP-3 in delivery of OCA2 to melanosomes. Mol Biol Cell. 2012;23(16):3178–3192. doi: 10.1091/mbc.E11-06-0509. [DOI] [PMC free article] [PubMed] [Google Scholar]
- 41.Cong L, et al. Multiplex genome engineering using CRISPR/Cas systems. Science. 2013;339(6121):819–823. doi: 10.1126/science.1231143. [DOI] [PMC free article] [PubMed] [Google Scholar]
- 42.Ambrosio AL, Boyle JA, Di Pietro SM. Mechanism of platelet dense granule biogenesis: Study of cargo transport and function of Rab32 and Rab38 in a model system. Blood. 2012;120(19):4072–4081. doi: 10.1182/blood-2012-04-420745. [DOI] [PMC free article] [PubMed] [Google Scholar]