

Abstract
Deficiency citations for safety violations in U.S. nursing homes from 2000 to 2007 are examined (representing a panel of 119,472 observations). Internal (i.e., operating characteristics of the facility), organizational (i.e., characteristics of the facility itself) and external (i.e., characteristics outside of the influence of the organization) factors associated with these deficiency citations are examined. The findings show that nursing homes increasingly receive deficiency citations for resident safety issues. Low staffing levels, poor quality of care, and an unfavorable Medicaid mix (occupancy and reimbursement) are associated with the likelihood of receiving deficiency citations for safety violations. In many cases, this likely influences the quality of life and quality of care of residents.
In the research presented here, deficiency citations for violations of resident safety are examined in two ways. First, the scope and severity of deficiency citations for safety violations in U.S. nursing homes from 2000 to 2007 are examined (representing a panel of 119,472 observations). Scope and severity are classifications used to categorize the extent of potential harm for each deficiency citation received by a facility (described below). Examining scope and severity provides information on the likely impact safety violations have on residents’ quality of life. Second, internal (i.e., operating characteristics of the facility), organizational (i.e., characteristics of the facility itself) and external (i.e., characteristics generally outside of the influence of the organization) factors associated with deficiency citations for safety violations are examined. Examining internal, organizational, and external factors is important, because it is expected that these factors may help explain why some nursing homes are more likely to receive these deficiency citations than others.
As several authors have noted, many definitions of patient safety exist (National Patient Safety Foundation, 2000). We use a modified version of the definition of patient safety from The Agency for Healthcare Research and Quality (AHRQ), which is, “Freedom from accidental or preventable injuries produced by medical care” (AHRQ, 2008, p. 1). We use this definition because it is concise, it is commonly cited, and can be applied to the nursing home setting. The definition was modified slightly by removing “medical” in the text. Nursing homes provide social, nursing, and medical care; therefore, this modification is more specific to the nursing home context (i.e., freedom from accidental or preventable injuries produced by care).
Research has identified resident safety to be “a potential problem in U.S. nursing homes” (Castle, Handler, Engberg, & Sonon, 2007, p. 15). As documentation of resident safety a proxy measure was used in this prior research – the resident safety culture (Castle et al., 2007). Average scores for almost all areas of resident safety culture assessed in this prior research were low, indicating endemic poor safety culture environments in nursing homes. However, more direct measures of safety issues in nursing homes exist as violations of Medicare/Medicaid regulations (commonly called deficiency citations). To date, no empirical research has examined deficiency citations for resident safety in nursing homes. Thus, as more direct measures of resident safety, examining these deficiency citations may be important in further understanding how problematic resident safety issues are in nursing homes. In this analysis, we grouped together deficiency citations related to resident safety. However, we note that no consensus exists on defining and distinguishing these deficiency citations as measures of resident safety. Thus, a limitation of this approach is that these groupings were not based on any empirical estimation, and more refined analyses should develop and use measures more closely resembling resident safety indices.
This research is significant in several respects. First, no prior research, to date, has presented a nationally representative picture of deficiency citations for resident safety in nursing homes. Second, no prior research has presented a longitudinal analysis of deficiency citations for resident safety in nursing homes. Third, initiatives to improve the resident safety of nursing homes are underdeveloped (Bonner et al., 2008); and, this research may foster more interest in developing these initiatives. Fourth, deficiency citations for safety have significant implications for the health and well-being of nursing home residents.
BACKGROUND
Patient Safety and Healthcare
Patient safety has become an important topic for many healthcare providers. In addition, a number of influential organizations including AHRQ (AHRQ, 2008), Joint Commission (www.jointcommission.org), Centers for Medicare & Medicaid Services (CMS), National Patient Safety Foundation (www.npsf.org), National Center for Patient Safety (www.patientsafety.gov), Institute for Healthcare Improvement (www.ihi.org) (to name just six) have extensive initiatives focused on improving patient safety.
Moreover, many healthcare providers are increasingly being asked by both state and federal government bodies to publically report patient safety information. For example, patient safety scores in Medicare populations include infection control, falls, and death among surgical patients with treatable serious complications (CMS, 2009). To encourage improvements in patient safety, CMS withholds payments to hospitals if patients suffer from safety related conditions, also known as “never events” (e.g., certain hospital acquired urinary tract infections; CMS, 2009). Some states have similar initiatives, with Pennsylvania (for example) limiting reimbursement for hospital acquired infections (Slack, 2007). A description of state specific patient safety initiatives can be found on the National Academy for State Health Policy web-site (www.nasho.org).
Nursing Home Patient Safety Literature
Nursing homes are believed to lag behind acute care settings when it comes to institution-wide patient safety initiatives (Gruneir & Mor, 2008; Scott-Cawiezell & Volgelsmweier, 2006). Although, we should note that no comprehensive evaluation exists examining patient safety initiatives in nursing homes to make this determination. Several research studies have examined specific patient safety initiatives in nursing homes; this includes research on medication errors, falls, and pressure ulcers (a listing is available from the authors).
Despite our lack of information on institution-wide patient safety initiatives in nursing homes compared to the acute care setting, the groundswell of patient safety initiatives in acute care settings has certainly spilled over into long-term care. Several national initiatives exist to foster improvements in patient safety and improvements in the quality of care provided to nursing home residents. Prominent national organizations have developed wide ranging initiatives to assess and improve patient safety in the nursing home setting (details and listing available from the authors). We note that these initiatives represent more than just a reproduction of safety issues in the hospital setting; and, include several safety issues specific to nursing homes such as resident elopement (National Institute for Elopement Prevention and Resolution; www.elopement.org).
Missing from the nursing home literature is an evaluation of the overall incidence of patient safety (such as adverse events or errors) in nursing homes. The To Err is Human (Kohn, Corrigan, & Donaldson, 1999) Institute of Medicine (IOM) report galvanized the public and legislators partly by suggesting that as many as 98,000 deaths attributable to avoidable mistakes occurred in U.S. hospitals. No equivalent figures exist for nursing homes. Yet, nursing home residents are potentially more vulnerable to the consequences of errors. Nursing home residents generally are elderly, frail, have a high degree of dependence, and require diverse care (Scott-Cawiezell & Vogelsmeier, 2006). Given these characteristics, deaths are likely to occur attributable to avoidable mistakes.
The approach used in this research of examining deficiency citations for safety cannot enumerate a death rate similar to that published for hospitals; but, deficiency citations for safety do provide a picture of the scale and scope of patient safety problems in nursing homes. Moreover, the classifications used to categorize deficiency citations provide some information on the potential for harm that exists in nursing homes due to patient safety issues.
Certification Process
One strategy to assure quality of care provided in nursing homes is through the certification process (Kelly, Liebig, & Edwards, 2008). Certification is a requirement for nursing homes to receive reimbursement for Medicare and/or Medicaid residents. Most U.S. nursing homes care for at least some Medicare or Medicaid residents; thus, almost all nursing homes are certified (i.e., approximately 17,000 representing 96% of all U.S. nursing homes). The certification process occurs approximately yearly. Briefly, certification consists of an on-site inspection by a team of surveyors (also called the inspection team). These surveyors monitor quality of care and assess whether the facility meets standards for certification. Surveyors generally come from state agencies; however, CMS retains overall jurisdiction over the certification process.
When a nursing home is determined not to meet a certification minimum standard a deficiency citation is issued (CMS, 2008). For each deficiency citation, a determination of the scope and severity of the problem(s) identified is also made. That is, one of 12 categories is used which are labeled “A” through “L,” with A having the least severity and scope. The severity depends on the extent of harm to the resident. The scope depends on the number of residents affected (this includes isolated cases, a pattern of cases, and widespread cases).
In addition, as part of the Life Safety Code (LSC) inspection, a further 113 areas of the nursing home are assessed. The LSC deficiency citations are often called K-tags. These all address safety issues, and vary from K-029 for “hazardous areas separated by construction” to K-051 for “fire alarm systems.” All of the K-tags were combined for this analysis. These citations (F-tags and K-tags) are available in the On-line Survey, Certification and Reporting (OSCAR) system data, described below.
CONCEPTUAL MODEL
The research presented here uses the nursing home as the unit of observation. Thus, we use an organization based conceptual framework. That is, it is proposed that external, organizational, and internal factors influence resident safety deficiency citations. This conceptual framework was used previously in nursing home analyses (Castle, Engberg, Lave, & Fisher, 2009).
External factors are characteristics that for the most part are beyond the control of the organization. These factors may still influence the daily operation of the facility, and can help define the context in which the facility operates (Grabowski, Huskamp, Stevenson, & Keating, 2009). The Medicaid reimbursement rate is the external characteristic of most interest in this analysis, but other factors included in the analytic models are competition, average number of elderly (per square mile) in the county, and per capita income in the county.
Organizational factors are characteristics of the nursing home. These factors are the relatively stable attributes of the facility (Kash, Hawes, & Phillips, 2007). Nevertheless, they can also influence the daily operations of the facility. Quality of care and Medicaid resident occupancy are of most interest in this analysis, but other factors included in the analytic models are bed size, for-profit ownership, chain membership, and occupancy rate.
Internal factors are operating characteristics of the facility. These factors reflect operating decisions within the facility and for many facilities these can vary over time (Harrington et al., 2000). Staffing levels are of most interest in this analysis, but other factors included in the analytic models are resident case-mix, restraint use, psychiatric conditions, mental retardation, and dementia.
The basis of this conceptual framework relies on the availability of resources, organizational priorities, and organizational capabilities. With respect to the availability of resources, Medicaid reimbursement (external factor), for example, can significantly impact financial resources of a nursing home (Kelly, Liebig, & Edwards, 2008); chain membership (organizational factor) can provide a facility with resources needed to improve resident safety; and, a low case-mix (internal factor) may require less complex care and help improve the revenue of a facility that in turn can be used to improve resident safety.
Deficiency citations for resident safety may also be dependent on organizational priorities and capabilities. For example, with higher per capita income in the county (external factor) nursing homes may place a greater priority on resident safety so as to attract more potential private-pay residents. The capability for resident safety may be related to staffing levels (internal factor); with nursing homes with higher staffing levels more able to address safety issues.
FACTORS OF INTEREST
In this research, staffing levels (of Registered Nurses [RNs], Licensed Practical Nurses [LPNs], and Nurse Aides [NAs]), quality, and Medicaid (reimbursement and occupancy) are the factors of interest. These were identified as factors of interest because, as described below, the empirical nursing home research literature in other contexts has a substantial interest in these areas (e.g., Hyer, Temple, & Johnson, 2009). However, little empirical research has included examining the relationship of these factors with patient safety. Also, following the conceptual model, these factors likely have a strong association with resources, organizational priorities, and capabilities; and therefore, possibly with resident safety deficiency citations.
Empirical research has identified inadequate staff-to-resident ratios to exist in many nursing homes (e.g., Hyer, Temple, & Johnson, 2009). Inadequate staff-to-resident ratios are generally substantiated based on the association identified between staffing levels and quality indicators. Not all empirical studies have identified a relationship between staffing levels and quality indicators; but, on the whole, a somewhat robust association is evident (see Castle, 2008).
Evidence that staffing levels and resident safety may be associated also comes from prior work on the resident safety culture of nursing homes. Used as control factors in empirical examinations in nursing homes, staffing levels have been identified as associated with resident safety culture. This includes research by Bonner et al. (2009) and Castle (2006). Given this robust association with several quality indicators and resident safety culture, it would be reasonable to expect that resident safety also has an association with staffing levels.
The IOM outlined the frequent and persistent quality problems extant in many nursing homes (IOM, 2001). These quality problems include: unnecessary falls, high use of physical restraints, high use of psychoactive medications, and high incidence of pressure ulcers (to name just four). Moreover, quality problems have also been identified for poor working conditions (Scott-Cawiezell et al., 2005) and for poor sanitary conditions (Gross, 2006).
The resident safety culture of nursing homes is also associated with quality indicators. Castle (2006) identified poor resident safety culture of nursing home top managers to be associated with deficiency citations. Bonner and associates (2009) identified poor resident safety culture of NAs to be associated with the use of physical restraints. It is likely that nursing homes providing poor quality of care are also less involved in resident safety.
Characteristics of the Medicaid program have a pervasive influence on nursing home care. Medicaid payment rates are determined by each state. However, considerable variation exists across states. The lowest rates in some states are believed to be below the cost to nursing homes of providing care (Grabowski, Feng, Intrator, & Mor, 2004). This is important because many nursing homes are reliant on payments from this program – i.e., reimbursement rates (Grabowski, 2001). On average, state Medicaid reimbursement accounts for approximately 50% of all nursing home revenues (Grabowski, 2001).
For individual nursing homes, the influence of the Medicaid reimbursement rate is compounded by the Medicaid resident occupancy (i.e., number of residents living in the nursing home paid for by the Medicaid program). The impact of Medicaid reimbursement rates is likely greater in facilities with a higher Medicaid occupancy. Thus, the influence of the Medicaid program on nursing homes comes from the rate of reimbursement, Medicaid resident occupancy rate, and the interaction of both the rate and occupancy.
METHODS
Data
Data used in this investigation primarily came from the OSCAR. The OSCAR data is collected as part of the Medicare and/or Medicaid certification process (described above). Records for each nursing home are available approximately yearly. These repeat records were combined for the longitudinal panel analyses. Data from 2000 to 2007 were used in this analysis because this time period represents relatively recent information on resident safety deficiency citations and corresponds with increased interest in this area by legislators (described above).
The baseline nursing home sample consisted of 16,745 nursing homes. These were matched in each subsequent year of OSCAR data through to 2007. Some attrition occurred in matching; that is, approximately 10% (N=1,811) of nursing homes were lost. These facilities lost to follow-up were more likely to be of smaller bed size, lower staffing levels, and receive higher numbers of deficiency citations from the remaining facilities (at a p <.05). This may introduce some bias in our findings, but given our variables of interest this likely makes the findings presented more conservative. Combined for the longitudinal panel analyses approximately 120,000 nursing home observations were used in this analysis.
Medicaid reimbursement rates from 2000 through 2007 are included in the analyses (as external factors). This information for each state came from primary data collected by the authors, following a process previously used and published by others (e.g., Grabowski et al., 2004). The average number of elderly (per square mile) in the market and per capita income in the market from 2000 through 2007 are also included in the analyses (as external factors). This information came from the Area Resource File (ARF), which is described in detail on the World Wide Web (Health Resources and Services Administration; www.hrsa.gov).
Dependent Variables
Several F-tags were combined to represent environmental safety issues and others to represent care safety issues. We considered the following to be environmental safety issues: F-256 for “lighting levels”; F-323 for “environment free of accident hazards, and supervision to prevent accidents”; F-454 for “physical environment life safety from fire”; F-463 for “call system”; F-465 for “safe, functional, sanitary environment”; and, F-468 for “handrails.” We considered the following to be care safety issues: F-332 for “medication error rates”; F-333 for “residents free from significant medication errors”; F-389 for “availability of physician for ER care”; F-431 for “labeling and storage of drugs and biologicals”; and, F-441 for “infection control and hand hygiene.”
This assessment of deficiency citations and environmental safety and care safety issues was based on using the modified AHRQ definition of patient safety, described above. Using this definition, the authors of this research first examined all F-tags and choose those most relevant to resident safety. Second, these resident safety related deficiency citations were divided into environmental safety and care safety issues based on their content areas. In addition, all of the K-tags were combined for this analysis.
Independent Variables
The Medicaid reimbursement rate is the external factor of interest. This is the average dollar amount (inflation-adjusted) paid by Medicaid in each state per resident day. Other external factors were used as independent variables. Competition is measured using the Herfindahl index. This is a measure of market competitiveness, with the county used as the market. The index is calculated by taking each nursing home’s percentage share of beds in the county and dividing by the squared market shares of all nursing homes in the county (Department of Justice; www.usdoj.gov). The number of elderly in the market (i.e., county) represents a count of those age 65 and above and per capita income in the market represents average income for all residents.
Quality of care and Medicaid resident occupancy are the organizational factors of interest. Two groups of deficiency citations were used as quality indicators. First, a group of 19 deficiency citations labeled “quality of care” deficiency citations were used. These deficiency citations are listed in Table 1. Deficiency citations consist of broad conceptual areas (i.e., resident rights, quality of life, quality of care, resident assessment, services, dietary, pharmacy, rehabilitation, dental and physician, physical environment, and administration (GAO, 2002)). Those related to direct resident care are included in the quality of care category, and because they are believed to be most closely related to the quality of resident care (GAO, 2002; Harrington et al., 2000) they were combined and used as a quality indicator in this analysis.
Table 1.
Descriptive Statistics of Nursing Homes Receiving and Not Receiving Deficiency Citations for Resident Safety
| No Safety Citationsa | Environmental Safety Citationsb | Care Safety Citationsc | All K-Tag Citationsd | |||||
|---|---|---|---|---|---|---|---|---|
| Variables | Mean (or %) |
Standard Deviation |
Mean (or %) |
Standard Deviation |
Mean Mean |
Standard Standard |
Mean Mean |
Standard Standard |
| Internal Factors of Interest | ||||||||
| NA staffing (FTEs per resident) | 0.31 | 0.14 | 0.32 | 0.13 | 0.33 | 0.13 | 0.33 | 0.13 |
| LPN staffing (FTEs per resident) | 0.12 | 0.09 | 0.12 | 0.08* | 0.12 | 0.08 | 0.12 | 0.09 |
| RN staffing (FTEs per resident) | 0.07 | 0.11 | 0.06 | 0.08* | 0.06 | 0.08* | 0.07 | 0.10 |
| Other Internal Factors: | ||||||||
| Resident case-mix (ADL score) | 0.26 | 0.12 | 0.26 | 0.12 | 0.27 | 0.12 | 0.26 | 0.12 |
| Restraint use | 0.10 | 0.11 | 0.11 | 0.12 | 0.12 | 0.13 | 0.10 | 0.12 |
| Psychiatric condition | 0.15 | 0.16 | 0.17 | 0.17* | 0.17 | 0.16* | 0.16 | 0.16 |
| Mental retardation | 0.03 | 0.06 | 0.03 | 0.06 | 0.03 | 0.05 | 0.03 | 0.06 |
| Dementia | 0.43 | 0.20 | 0.43 | 0.19 | 0.42 | 0.19 | 0.43 | 0.20 |
| Organizational Factors of Interest: | ||||||||
| Quality of care deficiency citations | 1.55 | 1.70 | 2.77 | 2.23* | 2.88 | 2.42* | 1.85 | 2.00* |
| J, K, or L deficiency citations | 0.04 | 0.23 | 0.08 | 0.53* | 0.12 | 0.68* | 0.04 | 0.38 |
| Medicaid resident occupancy | 62% | 26 | 67%* | 26 | 68% | 23* | 64% | 26* |
| Other Organizational Factors: | ||||||||
| Size (number of beds) | 102 | 73 | 114 | 73* | 115 | 64* | 116 | 77* |
| For-profit ownership | 64% | – | 71% | –* | 75% | –* | 67% | –* |
| Chain member | 56% | – | 60% | –* | 62%* | –* | 56% | – |
| Occupancy rate | 83% | 17 | 82% | 16 | 83% | 15 | 83% | 16 |
| External Factors of Interest | ||||||||
| Medicaid reimbursement rate ($) | 132 | 31 | 125 | 27* | 127 | 29* | 130 | 29* |
| Other External Factors | ||||||||
| Competition (Herfindahl Index) | 2253 | 2379 | 2076 | 2374* | 1975 | 2309* | 1917 | 2346* |
| Elderly in county (# per square mile) | 125 | 369 | 117 | 316* | 114 | 339* | 157 | 437* |
| Per capita income ($) | 26856 | 7709 | 27123 | 7531* | 26856 | 7485 | 27674 | 7887* |
For details on Deficiency Citations included in Environmental Safety Issues, Care Safety Issues, and Quality of Care see Appendix 1.
Quality of care deficiency citations = F-tag 309 = Facility must provide the necessary care and services for each resident to attain or maintain
All K-Tags = All Life Safety Code (LSC) K-tags
N = 7,943 facilities (based on 2000 data);
N = 4,385 facilities (based on 2000 data);
N = 5,537 facilities (based on 2000 data);
N = 7,069 facilities (based on 2000 data)
FTE = full-time equivalent, LTC = long-term care, ADL = activities of daily living, RN = Registered Nurse, LPN = Licensed Practical Nurse; NA = Nurse aide
Difference between receiving deficiency citation and not significant at p<0.01.
Note, the figures presented are for the baseline 2000 data. The baseline figures are presented for parsimony.
As described in the Certification Process section (above), deficiency citations vary in scope and severity (and shown in Table 2). They can be given based on the potential for harm to residents, and not actual harm. Thus, we include a second quality indicator providing additional information on the most severe deficiency citations. That is, J, K, and L deficiency citations were used.
Table 2.
Scope and Severity Classifications Used for Medicare/Medicaid Certification Survey Deficiencies and Percent of Nursing Homes Receiving Deficiency Citations for Resident Safety in 2007
| Environmental Safety Deficiency Citationsa | Scope | ||
|---|---|---|---|
| Severity | Isolated | Pattern | Widespread |
|
|
|||
| Potential for minimal harm | A (NR) |
B 7.75% (420) |
C 4.72% (256) |
|
|
|||
| Potential for more than minimal harm | D 47.14% (2,556) |
E 36.50% (1,979) |
F 4.30% (233) |
|
|
|||
| Other actual harm | G 10.20% (553) |
H 0.26% (14) |
I 0% (0) |
|
|
|||
| Actual or potential for death/serious injury | J 0.98% (53) |
K 1.05% (57) |
L 0.37% (20) |
|
|
|||
| Care Safety Deficiency Citationsb | |||
|
|
|||
| Severity | Isolated | Pattern | Widespread |
|
|
|||
| Potential for minimal harm | A (NR) |
B 3.94% (218) |
C 1.58% (88) |
|
|
|||
| Potential for more than minimal harm | D 52.88% (2,928) |
E 35.51% (1,966) |
F 4.80% (266) |
|
|
|||
| Other actual harm | G 0.70% (39) |
H 0.13% (7) |
I 0.05% (3) |
|
|
|||
| Actual or potential for death/serious injury | J 0.09% (5) |
K 0.22% (12) |
L 0.09% (5) |
|
|
|||
Number in parentheses is the number of citations given in 2007.
Severity is the extent of harm to the resident.
Scope is the number of residents affected (Isolated defined as affecting a single or very limited number of residents; Pattern defined as affecting more than a very limited number of residents; Widespread defined as affecting a large portion or all residents).
NR, not recorded in the OSCAR.
For details on Deficiency Citations included in Environmental Safety Issues and Care Safety Issues see Appendix 1.
Note K-Tags are not recorded with scope and severity designations
The percentile distribution of these deficiency citations within each state is used, as this enables a more consistent comparison across states. Variation in the use of nursing home deficiency citations is known to occur from state to state. Using the percentile distribution of deficiency citations within each state (for both the quality of care and J, K, and L deficiency citations) enables a more-consistent comparison of deficiency citations across states.
The percent of residents paid for by Medicaid in each nursing home was used as a measure of Medicaid resident occupancy. Other organizational factors were used as control variables. The number of nursing home beds was used as a measure of size. Two classes of facility ownership were used, for-profit and not-for-profit. Two classes of chain membership were used, chain and non-chain. The occupancy rate is the percent of beds in each nursing home occupied by residents.
Staffing levels are the internal factors of interest. Three different types of nursing staff were included in the analyses, the number (measured as Full Time Equivalent [FTE]) of RNs, LPNs, and NAs per resident. Other internal factors were used as control variables. An average Activities of Daily Living (ADL) score was used to represent case-mix. For each of three ADL questions (eating, toileting, and transferring) in the OSCAR a score from 0 to 3 was used by using no assistance, moderate need for assistance, and high degree of need for assistance, respectively. These scores were combined, with higher scores indicating a greater average ADL impairment within the facility. The numbers of residents with psychiatric conditions, mental retardation, and dementia were used to calculate the proportions of residents in each facility with these conditions. Similarly, the number of residents in physical restraints were used to calculate proportions. Dummy variables representing each year of data were also included in all of the multivariate models to take into account any global trends in quality.
Analyses
The percent of deficiency citations per year from 2000 to 2007 given for environmental safety issues (i.e., F-256, F-323, F-454, F-463, F-465, and F-468), care safety issues (F-332, F-333, F-389, F-431, and F-441), and all K-tags were calculated. The percent of deficiency citations per year from 2000 to 2007 given for environmental safety issues and care safety issues were calculated for each level of deficiency citation.
The mean and percent of facilities with any environmental safety issues, care safety issues, or K-tag are presented, along with the mean and percent of facilities with no environmental safety issues, care safety issues, or K-tags. These descriptive statistics are only provided for the year 2000 (i.e., baseline) for parsimony.
Prior to conducting the multivariate modeling, the multicollinearity and the level of collinearity among the variables using the variance inflation factor test were examined. No problems were identified. To fit the panel data, marginal models were used (i.e., generalized estimating equations (GEE) with a logit link (Zeger & Liang, 1992)), which are an extension of Generalized Linear Models (Zeger & Liang, 1992). The logit link regression estimates the probability of mutually exclusive events (e.g., citation or no citation) and is therefore used with dichotomous dependent variables. To create dichotomous dependent variables, nursing homes receiving a deficiency citation of interest were coded as 1 and those not receiving a deficiency citation were coded as 0. In evaluating the effects of the independent variables included in the analyses, odds ratios were calculated by taking the exponent of the parameter estimates.
GEEs were used because biases can occur in logit estimates using data consisting of repeat observations. This occurs in our data structure, because we use repeat observations of the same facilities from 2000 to 2007. Repeat observations can bias the analyses due to the potential correlation among the repeated measures (typically leading to elevated significance levels). GEE controls for the correlation and provides unbiased significance levels (Zeger & Liang, 1992).
In addition, because the number of facilities is large relative to the number of years, the coefficient estimates are not influenced much by the correlation structure of the latent error terms. We used GEE with an exchangeable correlation structure and we estimate the standard errors with a sandwich estimator. The literature shows that the inferences are robust with this exchangeable correlation structure (Fitzmaurice, Laird, & Ware, 2004); thus, specific patterns over time in the deficiency citations will not affect the inferences obtained.
All of the multivariate models included the external, organizational, and internal factors shown in Table 1 (and defined above). Multivariate models were used for environmental safety issues, care safety issues, and all K-tags. SAS® version 9.13 was used for all statistical analyses.
RESULTS
Table 1 presents descriptive statistics of the variables used in the analysis for the baseline period of the year 2000. A total of 4,385 nursing homes received a deficiency citation we had classified as environmental safety related, 5,537 received a deficiency citation we had classified as care safety related, and 7,069 received at least one K-tag citation.
The descriptive results showing the percent of nursing homes receiving safety related deficiency citations per year are provided in Figure 1. This shows that the percent of nursing homes receiving deficiency citations for: environmental safety issues increased from 30% in 2000 to 33% in 2007; care safety issues increased from 28% in 2000 to 473% in 2007; and, K-tags increased from 50% in 2000 to 60% in 2007.
Figure 1. Deficiency Citations for Resident Safety in Nursing homes.
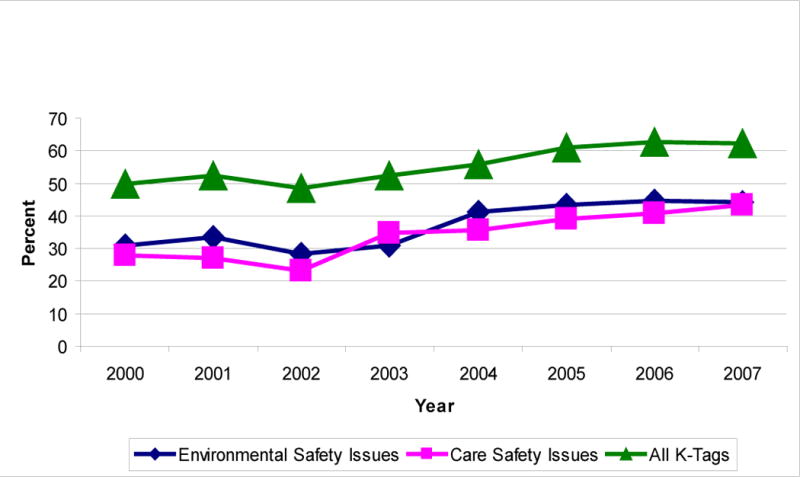
For details on Deficiency Citations included in Environmental Safety Issues and Care Safety Issues see Appendix 1. All K-Tags = All Life Safety Code (LSC) K-tags (e.g., fire, evacuation plans, etc).
Table 2 shows the percent of deficiency citations for 2007 given for environmental safety issues and care safety issues for each level of deficiency citation. This provides information on the severity of these deficiency citations. However, we note that for parsimony only information for 2007 is presented and nursing homes can overlap in each of the categories of deficiency citations used. Table 2 shows that relatively few nursing homes received deficiency citations in the most severe categories (i.e., J, K, and L).
Results from the GEE marginal models with a logit link are shown in Table 3. For the internal factors of interest (i.e., staffing) few Adjusted Odds Ratios (AOR) were consistently significant for either NA or LPN staffing levels. However, in all three analyses high staffing levels of RNs were associated with low deficiency citations for resident safety. For example, 5% fewer care safety deficiency citations result per unit increase in staffing levels of RNs (p<=.001).
Table 3.
Multivariate Results Examining Deficiency Citations for Resident Safety in Nursing Homes and Internal, Organizational and External Factors
| Environmental Safety Issues1 | Care Safety Issues2 | All K-Tags3 | |||||||
|---|---|---|---|---|---|---|---|---|---|
|
|
|||||||||
| AOR | 95% CI | AOR | 95% CI | AOR | 95% CI | ||||
| Internal Factors of Interest: | |||||||||
| FTE NAs/100 beds | 1.01 | (1.00 –1.02) | * | 1.01 | (0.99 –1.02) | 1.00 | (0.98 –1.01) | ||
| FTE LPNs/100 beds | 0.98 | (0.96 –1.01) | 1.02 | (1.00 –1.05) | * | 1.01 | (0.99 –1.04) | ||
| FTE RNs/100 beds | 0.97 | (0.95 –1.00) | ** | 0.95 | (0.92 –0.97) | *** | 0.97 | (0.96 –1.00) | ** |
| Other Internal Factors: | |||||||||
| Resident case-mix (ADL score) | 0.97 | (0.95 –0.99) | ** | 1.01 | (0.99 –1.03) | 1.01 | (0.99 –1.03) | ||
| Restraint use | 1.02 | (1.01 –1.04) | ** | 1.00 | (0.98 –1.02) | 1.03 | (1.02 –1.05) | ** | |
| Psychiatric condition | 1.04 | (1.02 –1.05) | *** | 1.00 | (0.98 –1.02) | 0.99 | (0.97 –1.01) | ||
| Mental retardation | 1.00 | (0.98 –1.01) | 1.00 | (0.98 –1.02) | 0.98 | (0.96 –1.00) | * | ||
| Dementia | 1.04 | (1.03 –1.06) | *** | 0.99 | (0.97 –1.01) | 0.99 | (0.98 –1.01) | ||
| Organizational Factor of Interest: | |||||||||
| Quality of care citations | 1.22 | (1.22 –1.23) | *** | 1.15 | (1.15 –1.16) | *** | 1.02 | (1.02 –1.02) | *** |
| Any J, K or L citation | 1.00 | (0.93 –1.07) | 0.93 | (0.88 –0.98) | *** | 1.01 | (0.98 –1.05) | ||
| Medicaid resident occupancya | 1.03 | (1.01 –1.05) | *** | 1.02 | (1.01 –1.10) | * | 1.04 | (1.00 –1.10) | * |
| Other Organizational Factors: | |||||||||
| Bed size | 1.02 | (1.00 –1.04) | * | 1.03 | (1.01 –1.05) | ** | 1.13 | (1.09 –1.17) | ** |
| For-profit ownership | 0.96 | (0.93 –1.00) | * | 1.03 | (0.99 –1.08) | 1.03 | (0.98 –1.08) | ||
| Chain membership | 1.00 | (0.97 –1.04) | 1.06 | (1.02 –1.11) | * | 0.96 | (0.92 –1.00) | * | |
| Occupancy rate | 0.97 | (0.95 –0.98) | ** | 1.04 | (1.02 –1.06) | ** | 1.00 | (0.97 –1.02) | |
| External Factor of Interest: | |||||||||
| Medicaid reimbursement rateb | 0.95 | (0.87 –0.98) | ** | 0.96 | (0.95 –0.98) | ** | 0.97 | (0.95 –1.00) | * |
| Medicaid reimbursement rate X | |||||||||
| Medicaid resident occupancyc | 1.08 | (1.02 –1.10) | ** | 1.10 | (1.03 –1.12) | ** | 1.06 | (1.02 –1.09) | ** |
| Other External Factors: | |||||||||
| Competition (Herfindahl index) | 0.99 | (0.97 –1.01) | 0.97 | (0.94 –0.99) | *** | 0.96 | (0.93 –0.99) | ** | |
| Number of elderly in county | 1.01 | (0.99 –1.03) | 0.99 | (0.96 –1.01) | 1.04 | (1.01 –1.07) | *** | ||
| Per capita income | 1.01 | (0.99 –1.03) | 0.99 | (0.97 –1.01) | 1.09 | (1.06 –1.13) | *** | ||
| Intercept | 0.10 | (0.06 –0.16) | *** | 0.09 | (0.05 –0.16) | *** | 0.00 | (0.00 –0.01) | *** |
N = 14,934 nursing homes and 119,472 observations
Statistically significant at p=0.05 level or better;
Statistically significant at p=0.01 level or better;
Statistically significant at p=0.001 level or better Results reported using generalized estimating equations (GEE).
Adjusted Odds Ratio for Medicaid reimbursement rate incorporates the interaction with Medicaid resident occupancy and are evaluated at the mean value for Medicaid resident occupancy.
Adjusted Odds Ratio for Medicaid resident occupancy incorporates the interaction with Medicaid reimbursement rate and are evaluated at the mean value for Medicaid reimbursement rate.
Adjusted Odds Ratios were manually calculated by using the mean levels of the variables (Medicaid reimbursement rate and Medicaid resident occupancy [i.e., a and b] and the variance/covariance matrix [Ai & Norton, 2003].
State dummies and year dummies also included (not shown).
FTE = full-time equivalent, LTC = long-term care, ADL = activities of daily living, RNs = Registered Nurses, LPNs = Licensed Practical Nurses, NAs = Nurse aides; AOR = Adjusted Odds Ratio; CI = Confidence Interval.
= See Appendix 1;
= See Appendix 1;
= All Life Safety Code (LSC) K-tags
Two of the organizational factors of interest had significant and robust associations with deficiency citations for resident safety. That is, high quality of care deficiency citation percentiles (indicating poor quality) were significantly associated with a greater likelihood of receiving resident safety deficiency citations (e.g., AOR = 1.22; p<= .001 for environmental safety issues). High average Medicaid occupancy was significantly associated with a greater likelihood of receiving resident safety deficiency citations (e.g., AOR = 1.03; p<= .001 for environmental safety issues).
The external factors of interest (i.e., Medicaid reimbursement rate and interaction) had a significant and robust association with resident safety deficiency citations. Using the care safety issues as an example, high Medicaid reimbursement rates (AOR = 0.96; p<= .01) were significantly associated with a lower likelihood of receiving a deficiency citation. The Medicaid occupancy/reimbursement rate interaction (AOR = 1.10; p<= .01) was significantly associated with a greater likelihood of receiving a deficiency citation. Thus, for the interaction facilities operating with both high Medicaid occupancy and low Medicaid reimbursement rates were more likely to receive a resident safety related deficiency citation.
Few consistent significant findings were identified for the other internal factors examined. Likewise, few consistent significant findings were identified for the other external factors examined. However, several consistent significant findings were identified for the other organizational factors examined. Greater bed size and chain membership were significantly associated with a high likelihood of receiving a resident safety deficiency citation.
DISCUSSION
The descriptive results of this research would appear to show that resident safety issues may be a considerable problem in nursing homes. Thirty three percent of nursing homes have environmental safety issues, 47% have care safety issues, and 60% have K-tags. As discussed above, some of these deficiency citations can be for relatively minor events. Nevertheless, we find 16% of nursing homes to have at least one of the most severe deficiency citations (i.e., J, K, and L; analyses not shown) from 2000 through 2007. These deficiency citations are for actual or potential for death/serious injury.
A further issue of concern is the trend over time of nursing homes receiving increasing numbers of resident safety related deficiency citations. All of the citations examined in this research had an upward trend over the eight year period examined. These descriptive findings may be influenced by many factors, including the emphasis state surveyors place on safety issues. Conceivably, since the focus on safety in acute care, surveyors may have placed more emphasis on identifying safety issues. Nevertheless, it is still somewhat disquieting that so many nursing homes are receiving deficiency citations in this area that could cause harm or death to residents.
To provide further insight into nursing homes receiving deficiency citations for resident safety issues, internal, organizational, and external factors were examined in a multivariate context. Specifically, we focused on staffing levels, quality of care measures, and Medicaid (occupancy and reimbursement).
Staffing Levels
Generally inconsistent findings have resulted in the literature examining staffing levels and quality. This has been noted as due to sample size limitations, cross-sectional designs, and methodological issues. A review of this literature identified some association between staffing levels and quality indicators, but cautioned that this was not the case for all quality indicators and for all types of staff (Castle, 2008). Our finding would seem to add to this notion. That is, high RN staffing levels seem important for low safety related deficiency citations which supports the position of the IOM on minimum staffing levels for nurses (IOM, 2004a).
We speculate that NA and LPN staffing levels are much less important (i.e., generally non-significant) than RN staffing levels may be related to the training and functions these different staff perform in the nursing home. For example, studies show that residents treated by nurses prepared in geriatrics are less likely to be physically restrained, have fewer readmissions to the hospital, and are less likely to be transferred inappropriately from nursing facilities to the hospital (IOM, 2008). That is, safety issues may be a “higher” level function of RNs. We believe that this may be one reason that many resident safety deficiency citations were identified in this study.
Following many prominent initiatives in the area of patient safety, all staff should be involved and this should not be primarily the domain of RNs (IOM, 2004a, 2004b, 2008). Again, however, we note that more information is needed on whether this is the case. Also, additional analyses could further examine the relationship of deficiency citations with staffing by including interactions and non-linear relationships.
Quality
A robust relationship between quality of care deficiency citations and safety deficiency citations was identified. That is, nursing homes with more quality of care deficiency citations were associated with more safety deficiency citations (including care, environment, and K-tags). That one class of deficiency citations should be related to another may not be surprising. However, the quality literature has shown such indicators actually have orthogonal relationships and are often not associated (Mor, 2005). That is, nursing homes often perform poorly in one area at the same time as they perform better in a different area.
The strong association of quality of care deficiency citations and safety deficiency citations identified may be due to the notion that safety and quality of care are influenced by similar operating and environmental conditions. This association also helps explain the overall poor safety environment characterized by previous studies (Bonner et al., 2008). Many nursing homes are known to be of generally poor quality (IOM, 2001); thus, the leap to a similar poor safety environment is likely given the close association of safety and quality.
A weaker association with safety and J, K, or L deficiency citations was identified. Some speculation is clearly needed for this finding, as it would seem counterintuitive that quality of care should be associated with safety, but the poorest quality of care (i.e., nursing homes with J, K, or L deficiency citations) is not strongly associated. This may be an artifact of the survey process; that once a severe deficiency citation is identified surveyors are less aggressive in identifying other deficiency citations. Alternatively, this may reflect the orthogonality of quality indicators mentioned previously.
Medicaid Factors
The analyses also show consistent and robust findings for the Medicaid factors examined. Facilities with a high average Medicaid census were more likely to receive a deficiency citation for resident safety; facilities operating in states with high Medicaid reimbursement rates were less likely to receive a deficiency citation for resident safety; and, the interaction (i.e., average Medicaid census X Medicaid reimbursement rate) was likewise significant in all three regression analyses.
These findings are consistent with other empirical investigations (Grabowski et al., 2004). That is, characteristics of the Medicaid system are associated with quality of care in nursing homes (Grabowski et al., 2004). We find low reimbursement rates seem to be jeopardizing resident safety (or at least deficiency citations for resident safety). Our findings (and those of prior investigations) are disconcerting because of the reliance nursing homes have on reimbursement from Medicaid.
As others have identified (Mor, Zinn, Angelelli, Teno, & Miller, 2004), findings such as ours for Medicaid are also of concern because of the two-tiered system of care that exists in the nursing home market. Facilities with a high Medicaid occupancy are known to provide care disproportionately to nonwhite populations living in poor communities (i.e., the disadvantaged (Mor et al., 2004)). Thus, our findings highlight a situation wherein, possibly the most vulnerable elders are also most likely to be residing in the least safe facilities.
Limitations and Suggestions for Future Research
The analyses represent one of the first nationally representative empirical characterizations of resident safety in nursing homes. This is significant, as little information exists in this area. However, one limitation of this approach is that we only examine deficiency citations for resident safety, which do not necessarily represent actual safety issues experienced by residents. As described above, some “actual” safety issues are part of the deficiency process – but these cannot be aggregated into an incidence rate of safety problems.
In addition, no single or aggregate measure of resident safety exists. This can limit the generalizability of the findings. We grouped together deficiency citations, but these groupings were not based on any empirical estimation. In some preliminary work, factor analyses were used to help identify more robust measures of resident safety. The factors identified were not stable across time, and multiple weak factors were identified. Thus, these analyses are not reported. However, not having a reliable scale (or index) of resident safety remains a limitation of this analysis.
The deficiency citations for resident safety and the categories used (i.e., environmental safety and care safety) were defined by the authors. The face validity of these measures was assessed (with positive findings) by consulting with 25 nursing home top managers. Nevertheless, further refinement of the deficiency citations used may be useful (for example, F253 for “housekeeping and maintenance services” could be included).
As we note above, 12 levels of scope and severity exist for deficiency citations. Information from these different levels was not used in specifying the dependent variables. A more detailed understanding of the relationship between resident safety and the independent variables may be achieved with this potential refinement. However, no well accepted metric exists for combining deficiency citations. Antonova (2008) has previously identified the difficulties involved in combining the 12 levels of scope and severity of deficiency citations.
The conceptual framework categorizes variables into external, organizational, and internal factors. Some fluidity in categorizing variables in this way exists. For example, Medicaid resident occupancy (an organizational factor) in some facilities may be a characteristic of the facility itself rather than an operating characteristic. Thus, Medicaid resident occupancy could be defined as an internal factor. Further refinement of this conceptual framework may be justified for future analyses.
Conclusions
These findings provide tentative evidence that resident safety may be a problem in nursing homes. Our findings are based on deficiency citations for resident safety, and as such should be viewed as providing a first blush examination in this area. Still, it is telling that almost ten years after considerable safety concerns surfaced in acute healthcare settings, we find that many nursing homes may also have safety issues. That is, nursing homes increasingly receive deficiency citations for resident safety issues.
Acknowledgments
Grant Support – P30 AG024827/AG/NIA NIH HHS/United States
Appendix 1. Detailed Specification of Deficiency Citations Used
Environmental Safety Issues = F-256 for “lighting levels”; F-323 for “environment free of accident hazards, and supervision to prevent accidents”; F-454 for “physical environment life safety from fire”; F-463 for “call system”; F-465 for “safe, functional, sanitary environment”; and, F-468 for “handrails.”
Care Safety Issues = F-332 for “medication error rates”; F-333 for “residents free from significant medication errors”; F-389 for “availability of physician for care”; F-431 for “labeling and storage of drugs and biologicals”; and, F-441 for “infection control and hand hygiene.”
Quality of care deficiency citations = F-tag 309 = Facility must provide the necessary care and services for each resident to attain or maintain the highest practicable well-being; F-tag 310 = A resident’s abilities in the activities of daily living (ADL) must not diminish unless clinical conditions make it unavoidable; F-tag 311 = Facility must provide appropriate treatment and services to maintain or improve residents’ abilities in the ADL; F-tag 312 = Residents who are unable to perform ADL must receive necessary services to maintain good nutrition, grooming, and hygiene; F-tag 314 = Facility must ensure residents entering facility without pressure sores do not develop sores and that residents with sores receive necessary treatment to promote healing, prevent infection, and prevent new sores; F-tag 316 = Incontinent residents must receive treatment and services to prevent urinary tract infections and restore as much normal function as possible; F-tag 317 = Residents who enter the facility without a limited range of motion must not experience a decline, unless clinical conditions make it unavoidable; F-tag 318 = Residents with a limited range of motion must receive appropriate treatment to increase range of motion or prevent further decline; F-tag 319 = Residents who display mental or psychosocial problems must receive appropriate treatment and services to correct assessed problems; F-tag 321 = Residents who have been able to eat alone or with assistance must not be fed by nasogastric tubes, unless clinical conditions make it unavoidable; F-tag 322 = Residents who are tube fed must receive appropriate treatment to prevent aspiration, vomiting, and other complications; if possible, restore normal eating skills; F-tag 323 = Facility must ensure resident environment is as free of accident hazards as is possible; F-tag 324 = Facility must ensure each resident receives adequate supervision and assistance devices to prevent accidents; F-tag 325 = Facility must ensure each resident maintains acceptable parameters of nutritional status, such as body weight; F-tag 328 = Facility must ensure residents receive necessary treatment and specialized services; F-tag 329 = Residents have the right to be free from unnecessary drugs; F-tag 330 = Residents must not be given antipsychotic drugs unless needed to treat a specific condition diagnosed and documented in the clinical record; F-tag 333 = Facility must ensure residents are free of any significant medication errors; and, F-tag 353 = facility must have sufficient nursing staff to provide services to attain or maintain the highest practicable well-being for each resident.
References
- Ai D, Norton EC. Interaction terms in logit and probit models. Economics Letters. 2003;80:123–129. [Google Scholar]
- AHRQ. Nursing Home Survey on Patient Safety Culture. 2008 http://www.ahrq.gov/ (accessed April 6, 2009)
- Antonova EN. How to measure nursing home health deficiencies: Development of a survey deficiency scope and severity score adjusted for state citation pattern. The University of Wisconsin; Madison: 2008. (AAT 3327770) [Google Scholar]
- Bonner A, Castle NG, Handler SM. Certified nursing assistants’ perceptions of nursing home patient safety culture: Is there a relationship to clinical outcomes? Journal of the American Medical Directors Association. 2009;10(1):11–20. doi: 10.1016/j.jamda.2008.06.004. [DOI] [PubMed] [Google Scholar]
- Bonner AF, Castle NG, Perera S, Handler SM. Patient safety culture: A review of the nursing home literature and recommendations for practice. Annals of Long-Term Care: Clinical Care and Aging. 2008;16(3):18–22. [PMC free article] [PubMed] [Google Scholar]
- Castle NG, Handler S, Engberg J, Sonon K. Nursing home administrators’ opinions of the resident safety culture in nursing homes. Health Care Management Review. 2007;32(1):66–76. doi: 10.1097/00004010-200701000-00009. [DOI] [PubMed] [Google Scholar]
- Castle NG. Nurse aides’ rating of the resident safety culture in nursing homes. Journal of Quality in Health Care. 2006;18(5):370–376. doi: 10.1093/intqhc/mzl038. [DOI] [PubMed] [Google Scholar]
- Castle NG. Nursing home caregiver staffing levels and quality of care: A literature review. Journal of Applied Gerontology. 2008;27(4):375–405. [Google Scholar]
- Castle NG, Engberg J, Lave J, Fisher A. Factors associated with increasing nursing home closures. Health Services Research. 2009;44(3):1088–1109. doi: 10.1111/j.1475-6773.2009.00954.x. [DOI] [PMC free article] [PubMed] [Google Scholar]
- Centers for Medicare and Medicaid Services. Fiscal Year 2009 Quality Measure Reporting For 2010 Payment Update. 2009 Available at (Accessed, June 8, 2010): www.cms.gov/HospitalQualityInits/downloads/HospitalRHQDAPU200808.pdf.
- Centers for Medicare and Medicaid Services. Use of Interpretive Guidance by Surveyors for Long Term Care Facilities. 2008 Ref: S&C-08-10. Accessed, June 8, 2010 www.cms.gov/SurveyCertificationGenInfo/downloads/SCLetter08-10.pdf.
- Department of Justice Herfindahl-Hirschman Index Accessed June 8, 2010 http://www.justice.gov/atr/public/testimony/hhi.htm
- Fitzmaurice GM, Laird NM, Ware JH. Applied Longitudinal Analysis. Wiley-Interscience Wiley & Sons; Hoboken, NJ: 2004. [Google Scholar]
- General Accounting Office. Nursing Homes: Quality of Care More Related to Staffing than Spending (GAO-02-431R) General Accounting Office; Washington, D.C: 2002. [Google Scholar]
- Grabowski DC, Huskamp HA, Stevenson DG, Keating NL. Ownership status and home health care performance. Journal of Aging & Social Policy. 2009;21(2):130–143. doi: 10.1080/08959420902728751. [DOI] [PMC free article] [PubMed] [Google Scholar]
- Grabowski DC. Does an increase in the Medicaid reimbursement rate improve nursing home quality? The Journals of Gerontology. 2001;56(2):S84–93. doi: 10.1093/geronb/56.2.s84. [DOI] [PubMed] [Google Scholar]
- Grabowski DC, Feng Z, Intrator O, Mor V. Recent trends in state nursing home payment policies. Health Affairs. 2004;W4:363–373. doi: 10.1377/hlthaff.w4.363. [DOI] [PubMed] [Google Scholar]
- Gruneir A, Mor V. Nursing home safety: Current issues and barriers to improvement. Annual Review of Public Health. 2008;29:369–382. doi: 10.1146/annurev.publhealth.29.020907.090912. [DOI] [PubMed] [Google Scholar]
- Gross J. Cleanliness is next to deficiency-free. Nursing Homes: Long Term Care Management. 2006;55(1):28–30. [Google Scholar]
- Harrington C, Zimmerman D, Karon SL, Robinson J, Beutel P. Nursing home staffing and its relationship to deficiencies. The Journals of Gerontology. Series B, Psychological Sciences and Social Sciences. 2000;55B(5):S278–S287. doi: 10.1093/geronb/55.5.s278. [DOI] [PubMed] [Google Scholar]
- Health Resources and Services Administration. Area Resource File (ARF) http://www.hrsa.gov/
- Hyer K, Temple A, Johnson CE. Florida’s efforts to improve quality of nursing home care through nurse staffing standards, regulations, and Medicaid reimbursement. Journal of Aging and Social Policy. 2009;21:318–337. doi: 10.1080/08959420903166910. [DOI] [PubMed] [Google Scholar]
- Institute of Medicine. Keeping Patients Safe: Transforming the Work Environment of Nurses. Washington, DC: National Academies Press; 2004a. [PubMed] [Google Scholar]
- Institute of Medicine. Patient Safety. Washington, DC: National Academy Press; 2004b. [Google Scholar]
- Institute of Medicine. Retooling for an Aging America: Building the Health Care Workforce. Washington, DC: The National Academies Press; 2008. [PubMed] [Google Scholar]
- Institute for Healthcare Improvement. Patient Safety. http://www.ihi.org/IHI/Topics/PatientSafety/
- Joint Commission. National Patient Safety Goals (NPSGs) 2010 Accessed, June 8, 2010 www.jointcommission.org/patientsafety/nationalpatientsafetygoals/ [PubMed]
- Kash BA, Hawes C, Phillips CD. Comparing staffing levels in the Online Survey Certification and Reporting (OSCAR) system with the Medicaid Cost Report data: Are differences systematic? The Gerontologist. 2007;47:480–489. doi: 10.1093/geront/47.4.480. [DOI] [PubMed] [Google Scholar]
- Kelly CM, Liebig PS, Edwards LJ. Nursing home deficiencies: An exploratory study of interstate variations in regulatory activity. Journal of Aging & Social Policy. 2008;20(4):398–413. doi: 10.1080/08959420802131817. [DOI] [PubMed] [Google Scholar]
- Kohn LT, Corrigan JM, Donaldson MS. To Err is Human: Building a Safer Health System. Washington, DC: National Academy Press; 1999. [PubMed] [Google Scholar]
- Mor V. Improving the quality of long-term care with better information. The Milbank Quarterly. 2005;83:1–20. doi: 10.1111/j.1468-0009.2005.00405.x. [DOI] [PMC free article] [PubMed] [Google Scholar]
- Mor V, Zinn J, Angelelli J, Teno JM, Miller SC. Driven to tiers: Socioeconomic and racial disparities in the quality of nursing home care. The Milbank Quarterly. 2004;82:1–18. doi: 10.1111/j.0887-378X.2004.00309.x. [DOI] [PMC free article] [PubMed] [Google Scholar]
- National Academy for State Health Policy. State Quality Improvement Partnership Toolbox. http://www.nashp.org/pst-welcome.
- National Center for Patient Safety. VA’s Approach to Patient Safety. Accessed June 8, 2010. www.patientsafety.gov/vision.html#approach.
- National Institute for Elopement Prevention and Resolution. Mission Statement. www.elopement.org.
- National Patient Safety Foundation. Join the Stand Up for Patient Safety™ Program and connect with other organizations leading the patient safety movement! http://www.npsf.org/hp/su/
- National Patient Safety Foundation. Agenda for Research and Development in Patient Safety. 2000 http://www.npsf.org/pdf/r/researchagenda.pdf. [PubMed]
- Scott-Cawiezell J, Volgelsmweier A. Nursing home safety: A review of the literature. Annual Review of Nursing Research. 2006;24:179–215. [PubMed] [Google Scholar]
- Slack K. A State Finds No Easy Fixes on Health Care. NY Times; 2007. Jul 10, [Google Scholar]
- Zeger SL, Liang KY. An overview of methods for the analysis of longitudinal data. Statistics in Medicine. 1992;11(14):1825–1839. doi: 10.1002/sim.4780111406. [DOI] [PubMed] [Google Scholar]