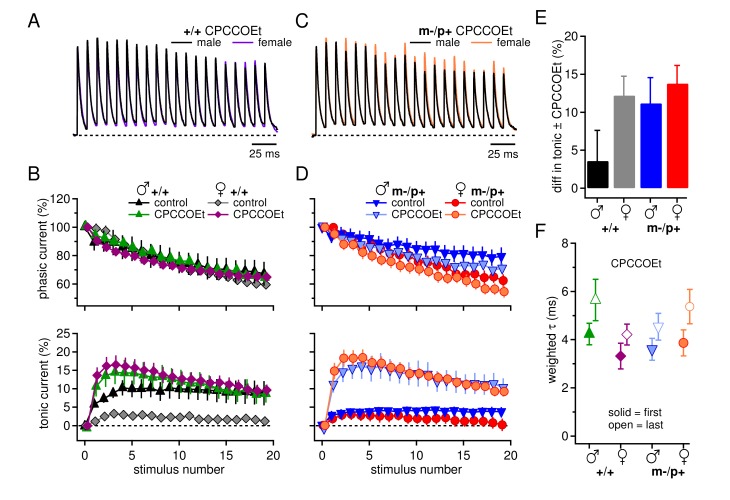
Figure 2. Group I mGluRs account for differences in synaptic currents and responses to the Gabrb3 m-/p+ mutation.
(A) Synaptic currents in the presence of CPCCOEt evoked in CbN cells from male and female wild-type mice. Dotted line, baseline holding current. (B) Mean amplitudes of phasic (upper panel) and tonic (lower panel) synaptic currents recorded in CPCCOEt as a percentage of the peak current evoked by the first stimulus in each train vs. stimulus number. Control data from Figure 1 are superimposed for comparison. Dotted line, 0% current. (C, D) As in B, but for cells from male and female m-/p+ mice. (E) Percent difference in tonic current ± CPCCOEt for each group, calculated from the difference between the mean tonic current for stimuli 5–10 in control and CPCCOEt solutions. (F) Solid symbols: weighted τdecay for each group in CPCCOEt. Open symbols: weighted τdecay from the last IPSC of the train, in CPCCOEt.

