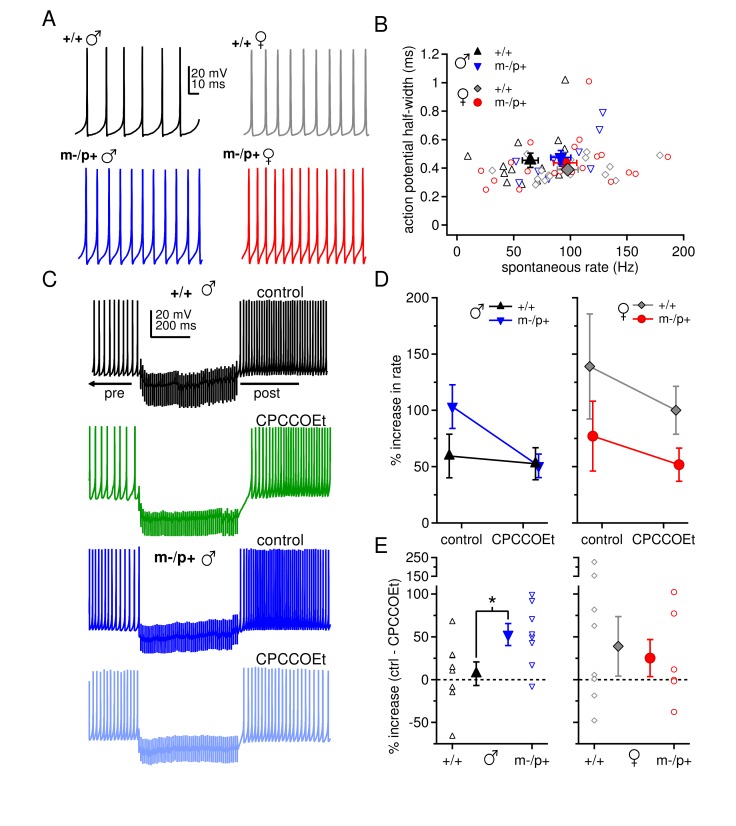
Figure 5. Sex differences in spontaneous firing rates and evoked rebound firing, and sex-specific responses to the Gabrb3 m-/p+ mutation.
(A) Sample traces of spontaneous action potentials in CbN cells. (B) Action potential half-width vs. spontaneous firing rate for all cells from all groups. Open symbols, individual cells; closed symbols, mean values. (C) Action potentials in a CbN cell, interrupted by a 500-ms, 100-Hz net inhibitory stimulus train, before and after application of CPCCOEt, for wild-type and m-/p+ CbN cells from males. To facilitate comparison, pre-stimulus firing was kept near 40 Hz (below the spontaneous rate) with constant holding current. (D) Difference between post- and pre-stimulus rates as a percentage of the pre-stimulus rate, before and after application of CPCCOEt for CbN cells from males (left) and females (right). (E) The percent increase in rate that depends on mGluR1/5, calculated from cell-by-cell differences between rate increases ± CPCCOEt in C, for males (left) and females (right). Dotted lines, 0%.

