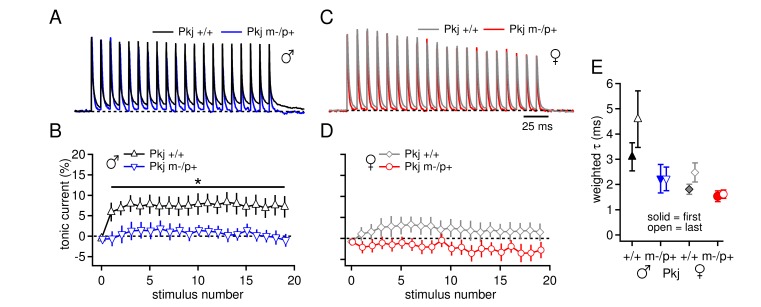
Figure 7. Differences in CbN cell tonic current depend on GABAAR β3 expression only in Purkinje cells.
(A) 100-Hz trains of synaptic currents evoked as in Figure 1 in CbN cells from Purkinje-specific Gabrb3 +/+ and m-/p+ male mice, normalized to the first peak. Dotted line, baseline holding current. (B) Mean amplitudes of tonic synaptic currents as a percentage of the first peak evoked current vs. stimulus number for cells from Pkj +/+ and Pkj m-/p+ male mice. Dotted line, 0% current. (C, D) As in A, B, but for cells from +/+ and m-/p+ female mice. (E) Solid symbols: weighted τdecay for IPSCs from a single stimulus for each group of CbN cells from Purkinje-specific Gabrb3 mice. Open symbols: weighted τdecay for the last IPSC in the train.

