

Abstract
The perirhinal cortex (PC), which is heavily connected with several epileptogenic regions of the limbic system such as the entorhinal cortex and amygdala, is involved in the generation and spread of seizures. However, the functional alterations occurring within an epileptic PC network are unknown. Here, we analyzed this issue by using in vitro electrophysiology and immunohistochemistry in brain tissue obtained from pilocarpine-treated epileptic rats and age-matched, nonepileptic controls (NECs). Neurons recorded intracellularly from the PC deep layers in the two experimental groups had similar intrinsic and firing properties and generated spontaneous depolarizing and hyperpolarizing postsynaptic potentials with comparable duration and amplitude. However, spontaneous and stimulus-induced epileptiform discharges were seen with field potential recordings in over one-fifth of pilocarpine-treated slices but never in NEC tissue. These network events were reduced in duration by antagonizing NMDA receptors and abolished by NMDA + non-NMDA glutamatergic receptor antagonists. Pharmacologically isolated isolated inhibitory postsynaptic potentials had reversal potentials for the early GABAA receptor-mediated component that were significantly more depolarized in pilocarpine-treated cells. Experiments with a potassium-chloride cotransporter 2 antibody identified, in pilocarpine-treated PC, a significant immunostaining decrease that could not be explained by neuronal loss. However, interneurons expressing parvalbumin and neuropeptide Y were found to be decreased throughout the PC, whereas cholecystokinin-positive cells were diminished in superficial layers. These findings demonstrate synaptic hyper-excitability that is contributed by attenuated inhibition in the PC of pilocarpine-treated epileptic rats and underscore the role of PC networks in temporal lobe epilepsy.
Keywords: amygdala, γ-aminobutyric acid, interneurons, perirhinal cortex, pilocarpine, potassium-chloride co-transporter 2, temporal lobe epilepsy
INTRODUCTION
The perirhinal cortex (PC) is composed of the agranular area 35 and of the dysgranular area 36, which are connected to several limbic regions including the amygdala, entorhinal cortex (EC), hippocampus, insular, and piriform cortices (Furtak et al., 2007). Anatomically, the PC is part of the parahippocampal region, in which it plays an important role in processing familiarity-based associative memory (Haskins et al., 2008). Memory disturbances, such as “dreamy state” symptoms consisting of déjàvu or vivid reminiscence of memories (Gloor, 1990), are frequently found in patients affected by temporal lobe epilepsy (TLE) and are associated with activation of the rhinal cortex (Bartolomei et al., 2004). For these reasons, the PC, along with other parahippocampal structures such as the amygdala, is receiving increasing attention for its role in TLE.
Major reciprocal projections are established among the PC and EC, piriform and insular cortices (Agster and Burwell, 2009), and with basal and lateral amygdala (LA) nuclei as well (Pikkarainen and Pitkänen, 2001). Most of these regions are epileptogenic, especially the amygdala, which is used both in kindling and status epilepticus (SE) models of TLE (Morimoto et al., 2004). Experimental evidence indicates that not only the amygdala, but also the PC is among the most easily kindled forebrain structure (McIntyre and Plant, 1989, 1993; McIntyre et al., 1993). In addition, the PC is also more likely to generate electrographic seizures in vitro than adjacent limbic structures (Klueva et al., 2003; de Guzman et al., 2004). A primary role for PC in seizure generalization has also been reported (Holmes et al., 1992; Kelly and McIntyre, 1996; McIntyre and Kelly, 2000).
Damage to parahippocampal regions was first documented in the EC of patients in which the temporal lobe was surgically operated to treat pharmacoresistant TLE (Du et al., 1993). These findings were then confirmed by magnetic resonance imaging studies that have shown volumetric reductions of the EC, but also of the PC in TLE patients (Bernasconi et al., 2000, 2003; Keller et al., 2004; Meade et al., 2008). Damage to the PC deep layers has also been documented in animal models of TLE, including pilocarpine-treated rodents, providing a SE duration of several hours (Covolan and Mello, 2000; Hamani and Mello, 2002; Harvey and Sloviter, 2005). It is however unknown whether these histopathological alterations are accompanied by changes in intrinsic and/or network-driven neuronal excitability. Interestingly, recent studies have reported epileptic hyperexcitability along with reduced inhibition in the EC of pilocarpine-treated rats (Kobayashi et al., 2003; Tolner et al., 2005; Wozny et al., 2005; Kumar and Buckmaster, 2006; de Guzman et al., 2008).
Despite the elaborate information obtained from kindling studies, electrophysiological assessment of the PC in chronically epileptic animals is still lacking. Therefore, this study was aimed at assessing the intrinsic and network characteristics of PC deep layers in epileptic rats by using the pilocarpine model of TLE (Curia et al., 2008).
METHODS
Procedures approved by the Canadian Council of Animal Care and the Italian Ministry of Public Health were used to induce SE in adult, male Sprague–Dawley rats weighing 150–200 g at the time of injection. All efforts were made to minimize the number of animals used and their suffering. Briefly, rats were injected with a single dose of pilocarpine hydrochloride (380–400 mg/kg, i.p). Methyl scopolamine (1 mg/kg i.p) was administered 30 min before pilocarpine to reduce discomfort caused by peripheral activation of muscarinic receptors. Animal behavior was monitored for ~4 h following pilocarpine and scored according to Racine’s classification (Racine et al., 1972). Only rats that experienced SE (stages 3–5) for 30–60 min were included in the pilocarpine group and used for in vitro electrophysiological analysis or to study the expression of potassium-chloride cotransporter 2 (KCC2) and neuronal cell damage 4.5–5 months (n = 21 and 6, respectively) later. The presence of spontaneous behavioral seizures was confirmed with video-monitoring in a subset of pilocarpine-treated rats (n = 20). Animals receiving a saline injection instead of pilocarpine were used as age-matched nonepileptic controls (NECs, n = 13 and 5, respectively, for electrophysiology and immunohistochemistry).
Pilocarpine-treated and NEC animals were decapitated under halothane anesthesia, and slices were obtained as described in previous studies (Benini et al., 2003; Benini and Avoli, 2006). Slices were transferred into a tissue chamber where they lay at the interface between artificial cerebrospinal fluid (ACSF) and humidified gas (95% O2 and 5% CO2) at a temperature of 34–35°C and a pH of 7.4. In this study, we focused on the most ventral slices corresponding to around −7.6 mm from the bregma (Paxinos and Watson, 2007) (cf., Fig. 1). The PC at this level corresponds to area 35. ACSF composition was (in mM): NaCl 124, KCl 2, KH2PO4 1.25, MgSO4 2, CaCl2 2, NaHCO3 26, and glucose 10. (2S)-3-[(1S)-1-(3,4-Dichlorophenyl)ethyl] amino-2-hydroxypropyl](phenylmethyl) phosphinic acid (CGP 55845A, 10 μM), 6-cyano-7-nitroquinoxaline-2,3-dione (CNQX, 10 μM), 3,3-(2-carboxypiperazin-4-yl)-propyl-1-phosphonate (CPP, 10 μM), and picrotoxin (PTX, 50 μM) were bath applied. Chemicals were acquired from Sigma (St. Louis, MO) with the exception of CGP 55845A, CNQX, and CPP that were obtained from Tocris Cookson (Ellisville, MO).
FIGURE 1.
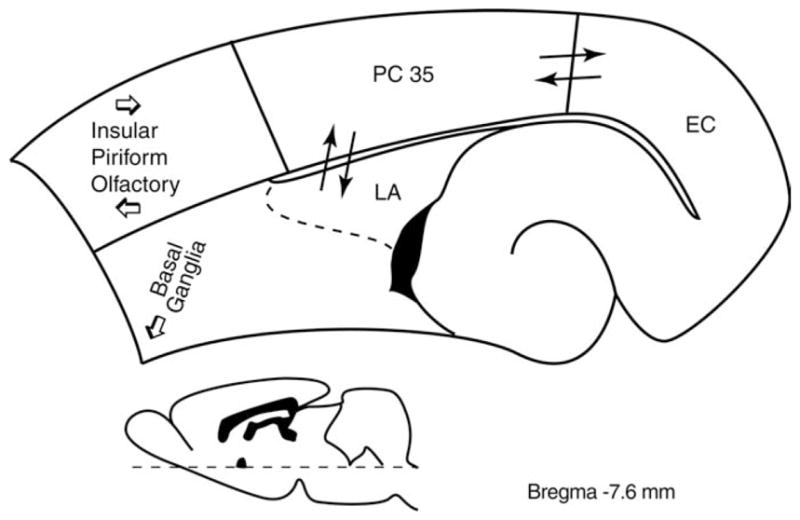
Scheme of the main afferent/efferent connections of the (PC) (area 35). The drawing corresponds to a section taken at −7.6 mm from the bregma according to the Paxinos and Watson (2007) atlas. Major afferent projections are from olfactory regions and lateral amygdala (LA), insular and piriform cortices, and claustrum; the most conspicuous efferent projection of PC is directed to the entorhinal cortex (EC), but insular, frontal, and parietal cortices are also targeted. Subcortical efferents terminate in a variety of regions, including basal ganglia and basomedial nuclei of the amygdala (cf. Furtak et al., 2007).
Field potential recordings were made from PC and lateral amygdala nucleus (LA) with ACSF-filled, glass pipettes (resistance = 2–10 MΩ), whereas sharp-electrode intracellular recordings were performed in PC deep layers with pipettes that were filled with 3 M K-acetate (resistance = 70–120 MΩ). Field and intracellular signals were fed to high-impedance amplifiers with internal bridge circuit for intracellular current injection. Resistance compensation was monitored throughout the experiment. PC cell membrane properties were measured as in Benini and Avoli (2006). Intrinsic firing patterns of these neurons were classified from responses to depolarizing current pulses (1–2.5 s in duration). PC synaptic responses were elicited by electrical stimuli (100 μs; <350 μA) that were delivered locally (e.g., Fig. 5) or in the LA (e.g., Fig. 6) through bipolar stainless steel electrodes. The dorsolateral and medial divisions of LA give origin to the major amygdaloid projection to area 35, which ends throughout layers I–VI, with the densest innervation in superficial layers (Pikkarainen and Pitkanen, 2001). Pharmacologically isolated inhibitory postsynaptic potentials (IPSPs) were studied in the presence of CPP + CNQX by using local electrical stimuli; reversal potential and peak conductance values for the early and late IPSP components were obtained from a series of responses evoked at membrane potentials set to different levels by intracellular current injection. Reversal potentials were computed from regression plots of amplitude of response versus membrane potential. Peak conductance values were estimated using the parallel conductance model (cf., Williams et al., 1993). Field and intracellular signals were acquired and analyzed as previously reported (Benini and Avoli, 2006). For time-delay measurements, the signal onset was determined as the time of the earliest deflection of the baseline recording (e.g., insert in Fig. 4Ca).
FIGURE 5.

Responses of PC neurons to local single-shock stimulation. A: Sub- and suprathreshold responses of PC neurons in (a) NEC, (b) pilocarpine (no field activity), and (c) pilocarpine (with field activity) recorded in “Control” conditions (i.e., ACSF only). Note the absence of an inhibitory response (insert) and the evoked epileptiform-like activity in (c) Pilocarpine (with field activity). B: Responses of PC neurons in (a) NEC, (b) pilocarpine (no field activity), and (c) pilocarpine (with field activity) in the presence of glutamatergic antagonists (+CPP + CNQX). Note the biphasic IPSP responses specifically at more depolarized membrane potentials (inserts). ▲ represent stimulation artifact.
FIGURE 6.

Responses of PC neurons to single-shock stimulation of LA networks. Comparison of the intracellular responses evoked by single-shock stimulation of LA networks in PC neurons recorded from NEC (A), pilocarpine (no field activity) (B), and pilocarpine (with field activity) (C) brain slices. In each cell, the responses were recorded at membrane potentials set to different levels by intracellular current injection. Note that in NEC, LA stimulation induces a “pure” IPSP sequence while EPSP–IPSP responses can be recorded in the pilocarpine (no field activity) tissue; also note that LA stimulation in pilocarpine (with field activity) results in robust discharges in PC cells which at more depolarized membrane levels (i.e., −54 mV) is preceded by a hyperpolarizing component (asterisk). ▲ represent stimulation artifact.
FIGURE 4.

Spontaneous synaptic activity in NEC and pilocarpine-treated tissue. A: (a) Simultaneous field [deep perirhinal cortex (PCf ) and lateral amygdala nucleus (LAf )] and intracellular recording (−68 mV, PC) in NEC tissue (i) reveals depolarizing PSPs indicated by arrows in insert and (ii) robust spontaneous hyperpolarizing IPSPs indicated by asterix. Expansion of these events is depicted in the right lower insert. (b) Response of PC neuron to intracellular current injection. B: Simultaneous field (PCf, LAf ) and intracellular activity (−68 mV, PC) recorded in the majority of pilocarpine-treated tissue. Note the absence of field activity (PCf, LAf ). PSPs are indicated by arrows in the intracellular trace and in the expansion in the right lower insert. (b) Response of PC neuron to intracellular current injection. C: (a) Simultaneous field (PCf, LAf ) and intracellular activity (−65 mV) recorded in a sub-set of pilocarpine-treated slices reveals robust network activity (PCf, LAf ). Expansion of an event demonstrates initiation in PC (arrow) and spread to LA (right lower insert). (b) Response of PC neuron to intracellular current injection.
Pilocarpine-treated (n = 6) and NEC (n = 5) animals were anesthetized (chloral-hydrate 450 mg/kg i.p.) and perfused via the ascending aorta with 100-ml saline followed by Zamboni fixative (pH 6.9). Brains were postfixed overnight in the same fixative at 4°C and, after cryoprotection by immersion in 15 and 30% sucrose-phosphate buffer solutions, they were frozen and cut horizontally from the ventral side with a freezing microtome (Biagini et al., 2008). Changes in KCC2 immuno-reactivity were assessed with a polyclonal antibody (product code no. 07–432, Upstate, NY), which was shown to be specific (Vale et al., 2003, 2005; Grob and Mouginot, 2005; Lohrke et al., 2005; de Guzman et al., 2006), used at 1:1,000 dilution on 50-μm-thick horizontal sections obtained, respectively, at levels −6.82 and −7.60 from Bregma (Paxinos and Watson, 2007). In close sections, we examined the presence of neuronal cell loss by using a monoclonal antibody against the specific neuronal cell nuclear antigen NeuN (1:100; no. MAB377B, Chemicon, Temecula, CA) or by staining different interneuron subpopulations with markers for parvalbumin (PV, 1:2,000, no. 235, Swant, Bellinzona, CH), neuropeptide Y (NPY, 1:800, no. IHC 7180, Peninsula, San Carlos, CA), and cholecystokinin octapeptide (CCK, 1:8,000, no. 20078, Immunostar Hudson, WI). Immunohistochemistry was performed with the avidin–biotin complex technique and diaminobenzidine as chromogen (cf. Biagini et al., 2008). Secondary antibodies and the avidin–peroxidase complex were purchased from Amersham Italia (Milan, Italy) and diluted 1:200 and 1:300, respectively. Stained sections were studied with the image analysis software KS300 (Zeiss Kontron, Munich, Germany) (cf. Biagini et al., 2005, 2006, 2008; de Guzman et al., 2006). Four sections for each animal were investigated and averaged for statistical analysis.
Measurements in the text are expressed as mean ± SEM, and n indicates the number of samples studied under each specific protocol. Normally, distributed data, assessed by the Kolgomorov–Smirnov test, were compared with the one-way analysis of variance (ANOVA) followed by Tukey’s test for multiple comparisons. The Mann–Whitney test was used to compare two groups only, in which data were non-normally distributed. The Kruskal–Wallis test was instead used for categorical data. Results were considered statistically significant if P < 0.05.
RESULTS
Neuronal Counting in NEC and Pilocarpine-Treated Rat PC
To assess the presence of neuronal cell loss in the PC of pilocarpine-treated rats, we examined the distribution of NeuN-positive neuronal nuclei in both groups of animals. No gross alterations in the distribution of NeuN immunoreactivity were observed in epileptic rats (Fig. 2, compare NEC in panel A with the pilocarpine-treated rat, in panel B). Evaluation of neuronal cell densities showed nonsignificant changes in pilocarpine-treated rats (Fig. 2C).
FIGURE 2.

Photomicrographs of NeuN distribution in the perirhinal cortex (PC) of NEC (A) and pilocarpine-treated (B) rats. Note that no clear cut difference is noticeable in PC of the two different sections. C: Analysis of neuronal cell densities did not reveal significant differences. The analyzed areas are indicated by the broken lines in (A) and (B). Abbreviations: ab, angular bundle; EC, entorhinal cortex; rs, rhinal sulcus; Sub, subiculum. Scale bar, 150 μm. [Color figure can be viewed in the online issue, which is available at wileyonlinelibrary.com.]
A different scenario emerged by analyzing immunoreactivity for the interneuron markers PV, NPY, and CCK. In NEC tissue, cells positive for PV were clearly prevalent (68% of cells stained with the three antibodies) when compared with the other putative interneurons (25% and 7% of all stained interneurons were, respectively, NPY- or CCK-positive) (Figs. 3A,C,E). Moreover, ~48% of all stained interneurons were localized in superficial layers: especially, CCK-positive neurons were more superficially (83%) than deeply (17%) located.
FIGURE 3.

Changes in interneuron subpopulations in the pilocarpine-treated, epileptic PC. Photomicrographs of interneurons identified with antibodies against parvalbumin (PV, panels A and B), neuropeptide Y (NPY, C and D), and cholecystokinin (CCK, E and F) in the PC of NEC (A, C, and E) and pilocarpine-treated epileptic (B, D, and F) rats. Note that all the different classes of interneurons are decreased in pilocarpine-treated epileptic rats, as shown in the plot histogram in G. Statistical analysis of neuronal counts was performed by using the Mann–Whitney test: **P < 0.01, *P < 0.05 versus NECs. Abbreviations: ab, angular bundle; EC, entorhinal cortex. Scale bar, 100 μm. [Color figure can be viewed in the online issue, which is available at wileyonlinelibrary.com.]
In pilocarpine-treated epileptic rats (Figs. 3B,D,F), interneurons were significantly decreased (P < 0.01 for PV and NPY, P < 0.05 for CCK; Fig. 3G) in the superficial layers. In deep layers, PV and NPY, but not CCK interneurons, were also decreased (P < 0.01; Fig. 3G). The relationship among the different interneuron types was also affected in pilocarpine-treated rats, because PV-positive cells decreased to 56% of all stained interneurons, whereas NPY- and CCK-positive cells increased to 32% and 12%, respectively (Fig. 3G). In superficial layers of pilocarpine-treated rats, we localized 53% of stained interneurons, thus more than in NECs.
Electrophysiological Recordings
Simultaneous field and intracellular recordings were carried out in the deep PC layers of brain slices obtained from NEC (n = 29 cells from 26 slices) and pilocarpine-treated rats (n = 63 cells from 47 slices). As previously reported (Faulkner and Brown, 1999; D’Antuono et al., 2001; Martina et al., 2001), these neurons could be characterized as either “intrinsically bursting” or “regular firing” depending on their responses to intracellular depolarizing pulses (Figs. 4Ab,Bb,Cb). Burst neurons exhibited a high-frequency burst of action potentials (APs) at the beginning of the pulse, whereas regular spiking cells on the other hand fired APs throughout the pulse at different spike adaptations (Figs. 4Ab,Bb,Cb). Both bursting and regular firing neurons could be observed in NEC and pilocarpine-treated groups (Table 1). Fast-spiking, presumptive interneurons were not included in this study. Resting membrane potential (RMP) after cell withdrawal, apparent input resistance, AP amplitude from the baseline, and AP duration at half-amplitude were not significantly different between the two types of tissue suggesting that PC cell-intrinsic properties were unchanged in epileptic rats (Table 1).
TABLE 1.
Intrinsic Membrane and Repetitive Firing Properties of PC Neurons Analyzed in Pilocarpine-Treated and NEC Slices
| Pilocarpine (with field activity) n = 14 | Pilocarpine (without field activity) n = 42 | NEC (n = 26) | |
|---|---|---|---|
| MP (mV) | 65.5 ± 1.9 | −65.7 ± 1.4 | −64.6 ± 1.5 |
| Ri (MΩ) | 47.8 ± 4.1 | 54.8 ± 1.8 | 58.5 ± 3.2 |
| APD (ms) | 1.2 ± 0.1 | 1.4 ± 0.1 | 1.4 ± 0.1 |
| APA (mV) | 86.2 ± 1.7 | 88.8 ± 1.2 | 88.7 ± 1.6 |
| Burst firinga | 1/14 (7%) | 8/42 (19%) | 7/26 (27%) |
| Regular firinga | 13/14 (93%) | 34/42 (81%) | 19/26 (73%) |
Ri, input resistance; RMP, resting membrane potential; APA, action potential amplitude; APD, action potential duration. n represents number of neurons recorded in each group. Data are provided as mean ± SEM. Comparison of the three groups revealed no statistical significance (P > 0.05).
Neurons were classified as “burst firing” or “regular firing” depending on their response to a depolarizing current pulse.
Simultaneous field potential recordings obtained from the PC and LA in the presence of normal medium demonstrated the absence of any spontaneous field activity in NEC slices (n = 18) (Fig. 4Aa, bottom field traces). When analyzed with intracellular recordings, NEC neurons exhibited at RMP depolarizing postsynaptic potentials (PSPs) with amplitude of 1.6 ± 0.1 mV and interval of occurrence of 2.4 ± 0.4 s (n = 19) (Fig. 4Aa, arrow in insert). In addition, spontaneous hyperpolarizing PSPs (termed thereafter sIPSPs) (amplitude = −2.9 ± 0.5 mV; interval of occurrence = 11.5 ± 1.8 s) were recorded from 11/19 PC neurons under these experimental conditions (Fig. 4Aa, asterisk). Steady hyper- or depolarization of the membrane potential altered the amplitude of these two types of spontaneous activities without influencing their rate of occurrence, thereby confirming their synaptic nature (not shown).
Based on the pattern of spontaneous field activity, pilocarpine-treated slices could be divided in two groups. In the majority of slices (n = 37/47), classified as “pilocarpine (no field activity),” spontaneous field events were not detected in either PC or LA (Fig. 4Ba). As in NEC tissue, neurons recorded intracellularly from these slices exhibited at RMP spontaneous depolarizing PSPs (amplitude = 1.8 ± 0.1 mV; interval of occurrence = 1.02 ± 0.07 s, n = 21 cells; Fig. 4Ba, arrow in insert) and, in 29% of neurons, sIPSPs (amplitude = −3.6 ± 0.6 mV; interval of occurrence = 28.6 ± 6.9 s; n = 6 cells; not illustrated). The amplitude and interval of occurrence of both depolarizing and hyperpolarizing PSPs were, however, not statistically different between NEC and pilocarpine-treated neurons (Table 2).
TABLE 2.
Spontaneous Synaptic Activity Recorded Intracellularly from PC Neurons in Slices Obtained from Pilocarpine-Treated and NEC Animals
| Pilocarpine (with field activity) n = 15 | Pilocarpine (without field activity) n = 21 | NEC n = 19 | |
|---|---|---|---|
| Spontaneous bursting activity | |||
| Duration (ms) | 1199 ± 315 | ND | ND |
| Interval of occurrence (s) | 39.2 ± 15.2 | ND | ND |
| Depolarizing PSPs | |||
| Amplitude (mV) | 2.0 ± 0.2 | 1.8 ± 0.1 | 1.6 ± 0.1 |
| Interval of occurrence (s) | 2.0 ± 0.8 | 2.4 ± 0.6 | 2.4 ± 0.4 |
| Hyperpolarizing PSPs | |||
| Amplitude (mV) | −3.2 ± 0.4 | −3.6 ± 0.6 | −2.9 ± 0.5 |
| Interval of occurrence (s) | 12.5 ± 2.0 | 28.6 ± 6.9 | 11.5 ± 1.8 |
Data are provided as mean ± SEM. ND, not detectable.
In the remaining pilocarpine-treated slices, classified as “pilocarpine (with field activity),” spontaneous field events were recorded in the PC (n = 10 slices, 15 cells) (Fig. 4Ca, bottom field traces). In five slices, we could document that these field events initiated in the deep PC layers and spread to the LA (Fig. 4Ca, arrow in insert) with time lags ranging between 12 and 24 ms; this range of time delays between the two limbic areas was also evident when analyzing successive events in the same experiment. Intracellularly, this network activity corresponded to robust neuronal firing of PC neurons recorded at RMP (duration = 1199 ± 315 ms; interval of occurrence = 39.2 ± 15.2 s; n = 15 cells) interspaced by depolarizing PSPs (amplitude = 2.0 ± 0.2 mV; interval of occurrence = 2.0 ± 0.2 s; n = 15 cells) (Table 2). Spontaneous IPSPs could also be recorded in seven of these cells.
NMDA and non-NMDA receptor antagonists (CPP and CNQX, respectively) were used to assess the contribution of glutamatergic transmission to the three types of spontaneous activity. Bath application of both CPP and CNQX abolished the spontaneous depolarizing PSPs in NEC (n = 6) and pilocarpine-treated neurons (n = 9) (not illustrated). In pilocarpine-treated slices with field activity, the spontaneous epilepti-form events were reduced in duration (from 926 ± 64 ms to 120 ± 39 ms, n = 4) by CPP and abolished with further application of CNQX (not shown).
PC neuron responses to single-shock stimulation were investigated with the help of a bipolar stimulating electrode placed within 500 μm from the recording electrode. In NEC slices, these responses consisted primarily of sequences of presumed excitatory postsynaptic potential (EPSP)-IPSP and at higher stimulation intensities they were characterized by single AP firing (Fig. 5Aa, NEC, n = 10/12). Application of CPP + CNQX abolished the stimulus-induced EPSP/AP response and gave rise to an IPSP (Fig. 5Ba). Similar responses were seen in pilocarpine-treated tissue with no field activity (n = 21, Figs. 5Ab,Bb). As in the case of NEC cells, both EPSP (n = 8/21) and EPSP-IPSP (13/21) sequences were seen in PC cells at sub-threshold stimulation intensities. In pilocarpine-treated slices (with field activity), however, stimuli elicited in PC cells only pure EPSP responses and at higher stimulation intensity robust AP discharges riding on depolarizing envelopes (Fig. 5A, pilocarpine (with field activity); n = 6). CPP reduced the duration of these after discharges, whilst further application of CNQX revealed an underlying IPSP (Fig. 5Bc, +CPP + CNQX; n = 3). Hence, stimulation of local PC networks demonstrates that pilocarpine-treated tissue can generate glutamatergic-dependent, epileptiformlike activity. In addition, the presence of an underlying IPSP during glutamatergic antagonism suggests that this is not due to the absence of inhibitory inputs.
Next, we assessed the intracellular responses evoked by single-shock stimulation of LA networks in PC neurons recorded from NEC, pilocarpine (no field activity), and pilocarpine (with field activity) brain slices. In each cell, the responses were recorded at membrane potentials set to different levels by intracellular current injection. As shown in Figure 6, LA stimulation induced in NEC slices a “pure” IPSP sequence (n = 8 neurons from five slices). Similar IPSPs were also recorded from 5 of 11 neurons in pilocarpine-treated (no field activity) slices (n = 7), whereas the remaining cells generated EPSP–IPSP sequences (n = 4) or pure EPSPs (n = 2). In contrast, LA stimulation in pilocarpine (with field activity) slices (n = 3) resulted in robust discharges of AP in PC cells (n = 5) (Fig. 6); these epilepti-form responses were preceded by a hyperpolarizing component (asterisk in Fig. 6) at more depolarized membrane levels (i.e., −54 mV).
Finally, we analyzed the intracellular responses of PC cells to local, single-shock stimulation during CPP and CNQX application. Under these experimental conditions, hyperpolarizing IPSPs were elicited in both NEC (n = 9) and pilocarpine-treated tissue (n = 12) (Fig. 7A). The early and late-IPSP components were greatly reduced by the GABAA receptor antagonist picrotoxin (n = 6) and the GABAB receptor antagonist CGP 88485A (n = 3), respectively (not shown). Comparison of these stimulus-induced IPSPs revealed that the reversal potential of the early GABAA-receptor-mediated component, but not of the late GABAB-receptor-mediated event, was more depolarized (P < 0.05, Mann–Whitney test) in pilocarpine-treated (−69.6 ± 1.0 mV, n = 12) than in NEC cells (−74.9 ± 1.7 mV, n = 9) (Fig. 7B and Table 3). Analysis of histograms of reversal potentials and the Kolgomorov–Smirnov test showed a non-normal distribution of the values measured in both groups. No differences in peak conductance of both early and late IPSP components were seen between the two groups (Table 3).
FIGURE 7.

GABAA-mediated component of evoked IPSP in the PC of pilocarpine-treated tissue exhibits a more depolarized reversal potential. A: Intracellular recordings of the “monosynaptic” IPSPs evoked in NEC and pilocarpine-treated tissue in the presence of CPP + CNQX; membrane potential was set to different levels by intracellular current injection. Note that the reversal potential of the IPSP early component is more depolarized in NEC (reversal potential = −74.7 mV) versus pilocarpine-treated tissue (reversal potential = −69.5 mV). B: Histogram of the distribution of the IPSP early component reversal potential values in NEC and pilocarpine-treated PC neurons. The statistical analysis is illustrated in Table 3. Skewness, that quantifies the asymmetry of the histogram distribution, suggests a tail to the right in pilocarpine-treated rats and a tail to the left in NECs. Kurtosis, which identifies the tendency to group values in the center, shows that pilocarpine-treated rats have more values in the center, whereas NECs are close to a Guassian distribution but have more values in the tail. In any case, the Kolgomorov–Smirnov test was significant (P < 0.01), suggesting a non-normal distribution of values when the two groups are considered all together.
TABLE 3.
Electrophysiological Characteristics of Stimulus-Induced IPSPs Recorded in PC Neurons from Pilocarpine-Treated and NEC Slices in the Presence of Ionotropic Glutamatergic Receptor Antagonists
| Pilocarpine (n = 12) | NEC (n = 9) | |
|---|---|---|
| Early component | ||
| Reversal potential (mV) | −69.6 ± 1.0a | −74.9 ± 1.7 |
| Skewness | +0.4 ± 0.6 | −0.1 ± 0.7 |
| Kurtosis | −1.1 ± 1.2 | +0.4 ± 1.4 |
| Peak conductance (nS) | 13.2 ± 1.9 | 12.5 ± 3.1 |
| Late component | ||
| Reversal potential (mV) | −92.5 ± 5.7 | −97.9 ± 2.9 |
| Peak conductance (nS) | 2.4 ± 0.7 | 4.7 ± 2.6 |
Data are provided as mean ± SEM.
Values are significantly different (P < 0.05) between pilocarpine-treated and NEC neurons, Mann–Whitney test.
Densitometric analysis of KCC2 immunohistochemistry
We used a commercially available specific antibody (Vale et al., 2003; Grob and Mouginot, 2005; Lohrke et al., 2005) to evaluate KCC2 expression in the PC. The distribution of KCC2 immunoreactivity in NEC tissue was as previously described in other cerebral regions such as the subiculum (de Guzman et al., 2006): immunostaining was localized in neuronal processes and on the surface of neuronal cell bodies, whereas the cytoplasm appeared completely devoid of any signal (arrows in Fig. 8A). This localization was also consistent with previous reports on KCC2 expression in other brain areas (Lohrke et al., 2005; Vale et al., 2005). No specific staining was evident in the angular bundle, which served as reference to evaluate nonspecific signal. Analysis of KCC2 expression in the PC of epileptic rats revealed a decrease in immunopositivity (Fig. 8B). These findings were quantified by measuring optical densities. As illustrated in the histogram in Figure 8, a significant (P < 0.01) decrease (−40%) in KCC2 optical densities was found in the epileptic PC (n = 6) when compared with NECs (n = 5), suggesting the existence of a dysfunction in the balance of intracellular chloride.
FIGURE 8.

Potassium-chloride cotransporter 2 (KCC2) immunoreactivity in the PC of nonepileptic control (NEC) rats (A) and pilocarpine-treated rats (B). Note that immunoreactivity is mainly localized on nerve fibers and cell surface, as easily appreciated in the CA1 hippocampal region [arrows in panel A; cf. de Guzman et al., 2006; Fig. 9C, for magnification of the cellular KCC2 staining]. The perirhinal cortex (PC) appears to be more intensely stained in the NEC than in the pilocarpine-treated rat. The densitometric analysis (histogram) demonstrated a significant (**P < 0.01, Mann–Whitney test) decrease in KCC2 optical densities in the PC of epileptic rats. Abbreviations: ab, angular bundle; EC, entorhinal cortex; rs, rhinal sulcus; Sub, subiculum. Scale bar, 200 μm.
DISCUSSION
Our findings demonstrate that deep PC neurons display intrinsic membrane properties and generate spontaneous PSPs that are similar in NEC and pilocarpine-treated, epileptic animals. However, in contrast to NEC, a subset of pilocarpine-treated slices could produce network-driven epileptiform discharges within the PC both spontaneously and in response to focal electrical stimuli; these epileptiform events were indeed abolished by ionotropic glutamatercic receptor antagonists and presumably contributed by alterations in GABAA-receptor mediated inhibition secondary to a decreased KCC2 expression.
In vitro investigations carried out in brain slices made epileptogenic by pharmacological treatment have shown that PC networks are more likely to initiate seizurelike discharges than adjacent structures such as the amygdala, piriform cortex, and EC (McIntyre and Plant, 1993; Klueva et al., 2003; de Guzman et al., 2004). This propensity of the PC to develop and sustain epileptiform activity is further corroborated by studies demonstrating that PC kindling occurs faster and results in an earlier generalization of seizures than kindling in the amygdala, hippocampus, and piriform cortex (McIntyre and Plant, 1989, 1993; McIntyre et al., 1993). In addition, a pivotal role for the PC in the generalization of seizures has also been presented by studies demonstrating that local application of an NMDA receptor antagonist to the PC/insular cortex can block amygdala-kindled seizures in rats (Holmes et al., 1992). Lesional studies have also indicated that the PC is required for the generation of hippocampal motor seizures (Kelly and McIntyre, 1996; McIntyre and Kelly, 2000). Altogether, these findings suggest that the PC plays an important role in the initiation and spread of seizures. In keeping with this evidence, we have demonstrated here the presence of glutamatergic, spontaneous epileptiform activity within the deep PC in a subset of brain slices obtained from chronically epileptic rats.
Recent evidence indicates that inhibitory networks within the PC and EC confer these structures with the ability to actively gate signal transmission between the neocortex and the hippocampus (Biella et al., 2002; de Curtis and Paré, 2004; Pelletier et al., 2004). Conceivably, this propensity of the rhinal cortices to control the propagation of neural activity is relevant for understanding the spread of epileptiform activity within the limbic system. Moreover, it raises the interesting question as to whether inhibition within the PC is reduced in epileptic animals. In this study, we were unable to identify any significant differences in the expression of either spontaneously occurring or stimulus-induced IPSPs in PC neurons analyzed in NEC and pilocarpine-treated slices. Even in pilocarpine-treated tissue that exhibited spontaneous field events, IPSP responses could still be evoked by single-shock stimulation of local networks although only in the presence of ionotropic glutamatergic antagonists. Although this evidence indicates that inhibitory inputs of local interneurons onto principal cells are not completely lost in epileptic rats, our histological evaluation of chronically epileptic tissue has shown a remarkable reduction in interneurons stained with PV, NPY, and CCK antibodies.
The only observable difference between the two experimental groups was a more depolarized GABAA receptor-mediated response in the pilocarpine-treated tissue. Such depolarizing shifts in GABA-mediated potentials have been demonstrated in the developing brain (Ben-Ari et al., 1989), in the adult brain following high-frequency stimulation (Voipio and Kaila, 2000; Lamsa and Taira, 2003) or 4-aminopyridine treatment (Perreault and Avoli, 1989) as well as in human and animal epileptic tissue (Cohen et al., 2002; Wozny et al., 2003; Benini and Avoli, 2006; de Guzman et al., 2006). This inhibitory-to-excitatory shift of GABA has been attributed to a number of factors including modification in chloride gradients due to a decreased expression of KCC2 (Rivera et al., 1999). Indeed, we have found that KCC2 immunoreactivity is consistently lower in epileptic rats, in the PC as well as in other parahippocampal regions (de Guzman et al., 2006). A transient decrease in KCC2 expression associated with increased excitability was also described in granule cells of the dentate gyrus, during the first 2 weeks after pilocarpine treatment (Pathak et al., 2007). Up-regulation of KCC2 in cultures of CA3 neuronal cells prevents the development of hyperexcitability, whereas the downregulation of KCC2 provokes seizure susceptibility (Zhu et al., 2008). Interestingly, KCC2 was undetectable in depolarized cells, but it was present in hyperpolarized subicular neurons of TLE patients (Huberfeld et al., 2007). In addition, neurons localized in the sclerotic area of the hippocampus and lacking immunopositivity for KCC2 were found to be hyperinnervated by parvalbumin-positive nerve terminals, suggesting increased exposure to GABA effects (Muñoz et al., 2007).
In conclusion, our results demonstrate that important changes in synaptic excitability occur in the PC of pilocarpine-treated rats at the time when spontaneous seizures occur. We have also obtained evidence suggesting that the presence of increased glutamatergic transfer within the epileptic PC networks are contributed by weakened GABAA receptor-mediated inhibition caused by decreased expression of KCC2 thus causing a shift of the IPSP reversal potential toward more positive values. In addition, the decrease in specific interneuron subpopulations can contribute to the increased excitability found in the PC of epileptic rats.
Acknowledgments
Grant sponsor: Canadian Institutes of Health Research; Grant number: MOP-8109; Grant sponsor: Mariani Foundation; Grant number: R-06-50; Grant sponsor: Savoy Foundation: Emilia-Romagna Region (Region-University Research Program 2007–2009); Grant number: 1232; Grant sponsor: Fonds de la Recherche en Santé Québec.
We thank Ms. T. Papadopoulos for secretarial assistance and Dr. Gabriella Panuccio for helpful discussion.
References
- Agster KL, Burwell RD. Cortical efferents of the perirhinal, postrhinal, and entorhinal cortices of the rat. Hippocampus. 2009;19:1159–1186. doi: 10.1002/hipo.20578. [DOI] [PMC free article] [PubMed] [Google Scholar]
- Bartolomei F, Barbeau E, Gavaret M, Guye M, McGonigal A, Régis J, Chauvel P. Cortical stimulation study of the role of rhinal cortex in déjà vu and reminiscence of memories. Neurology. 2004;63:858–864. doi: 10.1212/01.wnl.0000137037.56916.3f. [DOI] [PubMed] [Google Scholar]
- Ben-Ari Y, Cherubini E, Corradetti R, Gaiarsa JL. Giant synaptic potentials in immature rat CA3 hippocampal neurones. J Physiol (Lond) 1989;416:303–325. doi: 10.1113/jphysiol.1989.sp017762. [DOI] [PMC free article] [PubMed] [Google Scholar]
- Benini R, Avoli M. Altered inhibition in lateral amygdala networks in a rat model of temporal lobe epilepsy. J Neurophysiol. 2006;95:2143–2154. doi: 10.1152/jn.01217.2005. [DOI] [PubMed] [Google Scholar]
- Benini R, D’Antuono M, Pralong E, Avoli M. Involvement of amygdala networks in epileptiform synchronization in vitro. Neuroscience. 2003;120:75–84. doi: 10.1016/s0306-4522(03)00262-8. [DOI] [PubMed] [Google Scholar]
- Bernasconi N, Bernasconi A, Caramanos Z, Andermann F, Dubeau F, Arnold DL. Morphometric MRI analysis of the parahippocampal region in temporal lobe epilepsy. Ann NY Acad Sci. 2000;911:495–500. doi: 10.1111/j.1749-6632.2000.tb06752.x. [DOI] [PubMed] [Google Scholar]
- Bernasconi N, Bernasconi A, Caramanos Z, Antel SB, Andermann F, Arnold DL. Mesial temporal damage in temporal lobe epilepsy: A volumetric MRI study of the hippocampus, amygdala and parahippocampal region. Brain. 2003;126:462–469. doi: 10.1093/brain/awg034. [DOI] [PubMed] [Google Scholar]
- Biagini G, D’Arcangelo G, Baldelli E, D’Antuono M, Tancredi V, Avoli M. Impaired activation of CA3 pyramidal neurons in the epileptic hippocampus. Neuromol Med. 2005;7:325–342. doi: 10.1385/NMM:7:4:325. [DOI] [PubMed] [Google Scholar]
- Biagini G, Baldelli E, Longo D, Pradelli L, Zini I, Rogawski MA, Avoli M. Endogenous neurosteroids modulate epileptogenesis in a model of temporal lobe epilepsy. Exp Neurol. 2006;201:519–524. doi: 10.1016/j.expneurol.2006.04.029. [DOI] [PubMed] [Google Scholar]
- Biagini G, Baldelli E, Longo D, Contri MB, Guerrini U, Sironi L, Gelosa P, Zini I, Ragsdale DS, Avoli M. Proepileptic influence of a focal vascular lesion affecting entorhinal cortex-CA3 connections after status epilepticus. J Neuropathol Exp Neurol. 2008;67:687–701. doi: 10.1097/NEN.0b013e318181b8ae. [DOI] [PMC free article] [PubMed] [Google Scholar]
- Biella G, Uva L, de Curtis M. Propagation of neuronal activity along the neocortical-perirhinal-entorhinal pathway in the guinea pig. J Neurosci. 2002;22:9972–9979. doi: 10.1523/JNEUROSCI.22-22-09972.2002. [DOI] [PMC free article] [PubMed] [Google Scholar]
- Cohen I, Navarro V, Clemenceau S, Baulac M, Miles R. On the origin of interictal activity in human temporal lobe epilepsy in vitro. Science. 2002;298:1418–1421. doi: 10.1126/science.1076510. [DOI] [PubMed] [Google Scholar]
- Covolan L, Mello LE. Temporal profile of neuronal injury following pilocarpine or kainic acid-induced status epilepticus. Epilepsy Res. 2000;39:133–152. doi: 10.1016/s0920-1211(99)00119-9. [DOI] [PubMed] [Google Scholar]
- Curia G, Longo D, Biagini G, Jones RS, Avoli M. The pilocarpine model of temporal lobe epilepsy. J Neurosci Methods. 2008;172:143–157. doi: 10.1016/j.jneumeth.2008.04.019. [DOI] [PMC free article] [PubMed] [Google Scholar]
- D’Antuono M, Biagini G, Tancredi V, Avoli M. Electrophysiology and morphology of regular firing cells in the rat perirhinal cortex. Hippocampus. 2001;11:662–672. doi: 10.1002/hipo.1081. [DOI] [PubMed] [Google Scholar]
- de Curtis M, Paré D. The rhinal cortices: A wall of inhibition between the neocortex and the hippocampus. Prog Neurobiol. 2004;74:101–110. doi: 10.1016/j.pneurobio.2004.08.005. [DOI] [PubMed] [Google Scholar]
- de Guzman P, D’Antuono M, Avoli M. Initiation of electrographic seizures by neuronal networks in entorhinal and perirhinal cortices in vitro. Neuroscience. 2004;123:875–886. doi: 10.1016/j.neuroscience.2003.11.013. [DOI] [PubMed] [Google Scholar]
- de Guzman P, Inaba Y, Biagini G, Baldelli E, Mollinari C, Merlo D, Avoli M. Subiculum network excitability is increased in a rodent model of temporal lobe epilepsy. Hippocampus. 2006;16:843–860. doi: 10.1002/hipo.20215. [DOI] [PubMed] [Google Scholar]
- de Guzman P, Inaba Y, Baldelli E, de Curtis M, Biagini G, Avoli M. Network hyperexcitability within the deep layers of the pilocarpine-treated rat entorhinal cortex. J Physiol (Lond) 2008;586:1867–1883. doi: 10.1113/jphysiol.2007.146159. [DOI] [PMC free article] [PubMed] [Google Scholar]
- Du F, Whetsell WO, Jr, Abou-Khalil B, Blumenkopf B, Lothman EW, Schwarcz R. Preferential neuronal loss in layer III of the entorhinal cortex in patients with temporal lobe epilepsy. Epilepsy Res. 1993;16:223–233. doi: 10.1016/0920-1211(93)90083-j. [DOI] [PubMed] [Google Scholar]
- Faulkner B, Brown TH. Morphology and physiology of neurons in the rat perirhinal-lateral amygdala area. J Comp Neurol. 1999;411:613–642. [PubMed] [Google Scholar]
- Furtak SC, Wei SM, Agster KL, Burwell RD. Functional neuroanatomy of the parahippocampal region in the rat: The perirhinal and postrhinal cortices. Hippocampus. 2007;17:709–722. doi: 10.1002/hipo.20314. [DOI] [PubMed] [Google Scholar]
- Gloor P. Experiential phenomena of temporal lobe epilepsy. Facts and hypotheses. Brain. 1990;113:1673–1694. doi: 10.1093/brain/113.6.1673. [DOI] [PubMed] [Google Scholar]
- Grob M, Mouginot D. Heterogeneous chloride homeostasis and GABA responses in the median preoptic nucleus of the rat. J Physiol (Lond) 2005;569:885–901. doi: 10.1113/jphysiol.2005.095794. [DOI] [PMC free article] [PubMed] [Google Scholar]
- Hamani C, Mello LE. Spontaneous recurrent seizures and neuropathology in the chronic phase of the pilocarpine and picrotoxin model epilepsy. Neurol Res. 2002;24:199–209. doi: 10.1179/016164102101199611. [DOI] [PubMed] [Google Scholar]
- Harvey BD, Sloviter RS. Hippocampal granule cell activity and c-Fos expression during spontaneous seizures in awake, chronically epileptic, pilocarpine-treated rats: Implications for hippocampal epileptogenesis. J Comp Neurol. 2005;488:442–463. doi: 10.1002/cne.20594. [DOI] [PubMed] [Google Scholar]
- Haskins AL, Yonelinas AP, Quamme JR, Ranganath C. Perirhinal cortex supports encoding and familiarity-based recognition of novel associations. Neuron. 2008;59:554–560. doi: 10.1016/j.neuron.2008.07.035. [DOI] [PubMed] [Google Scholar]
- Holmes KH, Bilkey DK, Laverty R. The infusion of an NMDA antagonist into perirhinal cortex suppresses amygdala-kindled seizures. Brain Res. 1992;587:285–290. doi: 10.1016/0006-8993(92)91009-4. [DOI] [PubMed] [Google Scholar]
- Huberfeld G, Wittner L, Clemenceau S, Baulac M, Kaila K, Miles R, Rivera C. Perturbed chloride homeostasis and GABAergic signaling in human temporal lobe epilepsy. J Neurosci. 2007;27:9866–9873. doi: 10.1523/JNEUROSCI.2761-07.2007. [DOI] [PMC free article] [PubMed] [Google Scholar]
- Keller SS, Wilke M, Wieshmann UC, Sluming VA, Roberts N. Comparison of standard and optimized voxel-based morphometry for analysis of brain changes associated with temporal lobe epilepsy. Neuroimage. 2004;23:860–868. doi: 10.1016/j.neuroimage.2004.07.030. [DOI] [PubMed] [Google Scholar]
- Kelly ME, McIntyre DC. Perirhinal cortex involvement in limbic kindled seizures. Epilepsy Res. 1996;26:233–243. doi: 10.1016/s0920-1211(96)00056-3. [DOI] [PubMed] [Google Scholar]
- Klueva J, Munsch T, Albrecht D, Pape HC. Synaptic and non-synaptic mechanisms of amygdala recruitment into temporolimbic epileptiform activities. Eur J Neurosci. 2003;18:2779–2791. doi: 10.1111/j.1460-9568.2003.02984.x. [DOI] [PubMed] [Google Scholar]
- Kobayashi M, Wen X, Buckmaster PS. Reduced inhibition and increased output of layer II neurons in the medial entorhinal cortex in a model of temporal lobe epilepsy. J Neurosci. 2003;23:8471–8479. doi: 10.1523/JNEUROSCI.23-24-08471.2003. [DOI] [PMC free article] [PubMed] [Google Scholar]
- Kumar SS, Buckmaster PS. Hyperexcitability, interneurons, and loss of GABAergic synapses in entorhinal cortex in a model of temporal lobe epilepsy. J Neurosci. 2006;26:4613–4623. doi: 10.1523/JNEUROSCI.0064-06.2006. [DOI] [PMC free article] [PubMed] [Google Scholar]
- Lamsa K, Taira T. Use-dependent shift from inhibitory to excitatory GABAA receptor action in SP-O interneurons in the rat hippocampal CA3 area. J Neurophysiol. 2003;90:1983–1995. doi: 10.1152/jn.00060.2003. [DOI] [PubMed] [Google Scholar]
- Lohrke S, Srinivasan G, Oberhofer M, Doncheva E, Friauf E. Shift from depolarizing to hyperpolarizing glycine action occurs at different perinatal ages in superior olivary complex nuclei. Eur J Neurosci. 2005;22:2708–2722. doi: 10.1111/j.1460-9568.2005.04465.x. [DOI] [PubMed] [Google Scholar]
- Martina M, Royer S, Paré D. Cell-type-specific GABA responses and chloride homeostasis in the cortex and amygdala. J Neurophysiol. 2001;86:2887–2895. doi: 10.1152/jn.2001.86.6.2887. [DOI] [PubMed] [Google Scholar]
- McIntyre DC, Plant JR. Pyriform cortex involvement in kindling. Neurosci Biobehav Rev. 1989;13:277–280. [PubMed] [Google Scholar]
- McIntyre DC, Plant JR. Long-lasting changes in the origin of spontaneous discharges from amygdala-kindled rats: Piriform vs. perirhinal cortex in vitro. Brain Res. 1993;624:268–276. doi: 10.1016/0006-8993(93)90086-3. [DOI] [PubMed] [Google Scholar]
- McIntyre DC, Kelly ME. The parahippocampal cortices and kindling. Ann NY Acad Sci. 2000;911:343–354. doi: 10.1111/j.1749-6632.2000.tb06736.x. [DOI] [PubMed] [Google Scholar]
- McIntyre DC, Kelly ME, Armstrong JN. Kindling in the perirhinal cortex. Brain Res. 1993;615:1–6. doi: 10.1016/0006-8993(93)91108-5. [DOI] [PubMed] [Google Scholar]
- Meade CE, Bowden SC, Whelan G, Cook MJ. Rhinal cortex asymmetries in patients with mesial temporal sclerosis. Seizure. 2008;17:234–246. doi: 10.1016/j.seizure.2007.07.010. [DOI] [PubMed] [Google Scholar]
- Morimoto K, Fahnestock M, Racine RJ. Kindling and status epilepticus models of epilepsy: Rewiring the brain. Prog Neurobiol. 2004;73:1–60. doi: 10.1016/j.pneurobio.2004.03.009. [DOI] [PubMed] [Google Scholar]
- Muñoz A, Méndez P, DeFelipe J, Alvarez-Leefmans FJ. Cation-chloride cotransporters and GABA-ergic innervation in the human epileptic hippocampus. Epilepsia. 2007;48:663–673. doi: 10.1111/j.1528-1167.2007.00986.x. [DOI] [PubMed] [Google Scholar]
- Pathak HR, Weissinger F, Terunuma M, Carlson GC, Hsu FC, Moss SJ, Coulter DA. Disrupted dentate granule cell chloride regulation enhances synaptic excitability during development of temporal lobe epilepsy. J Neurosci. 2007;27:14012–14022. doi: 10.1523/JNEUROSCI.4390-07.2007. [DOI] [PMC free article] [PubMed] [Google Scholar]
- Paxinos G, Watson C. The rat brain in stereotaxic coordinates. 6. New York: Academic Press; 2007. p. 456. [Google Scholar]
- Pelletier JG, Apergis J, Paré D. Low-probability transmission of neocortical and entorhinal impulses through the perirhinal cortex. J Neurophysiol. 2004;91:2079–2089. doi: 10.1152/jn.01197.2003. [DOI] [PubMed] [Google Scholar]
- Perreault P, Avoli M. Effects of low concentrations of 4-amino-pyridine on CA1 pyramidal cells of the hippocampus. J Neurophysiol. 1989;61:953–970. doi: 10.1152/jn.1989.61.5.953. [DOI] [PubMed] [Google Scholar]
- Pikkarainen M, Pitkänen A. Projections from the lateral, basal and accessory basal nuclei of the amygdala to the perirhinal and postrhinal cortices in rat. Cereb Cortex. 2001;11:1064–1082. doi: 10.1093/cercor/11.11.1064. [DOI] [PubMed] [Google Scholar]
- Racine RJ. Modification of seizure activity by electrical stimulation. II. Motor seizure. Electroencephalogr Clin Neurophysiol. 1972;32:281–294. doi: 10.1016/0013-4694(72)90177-0. [DOI] [PubMed] [Google Scholar]
- Rivera C, Voipio J, Payne JA, Ruusuvuori E, Lahtinen H, Lamsa K, Pirvola U, Saarma M, Kaila K. The K+/C− co-transporter KCC2 renders GABA hyperpolarizing during neuronal maturation. Nature. 1999;397:251–255. doi: 10.1038/16697. [DOI] [PubMed] [Google Scholar]
- Tolner EA, Kloosterman F, van Vliet EA, Witter MP, Silva FH, Gorter JA. Presubiculum stimulation in vivo evokes distinct oscillations in superficial and deep entorhinal cortex layers in chronic epileptic rats. J Neurosci. 2005;25:8755–8765. doi: 10.1523/JNEUROSCI.1165-05.2005. [DOI] [PMC free article] [PubMed] [Google Scholar]
- Vale C, Schoorlemmer J, Sanes DH. Deafness disrupts chloride transporter function and inhibitory synaptic transmission. J Neurosci. 2003;23:7516–7524. doi: 10.1523/JNEUROSCI.23-20-07516.2003. [DOI] [PMC free article] [PubMed] [Google Scholar]
- Vale C, Caminos E, Martinez-Galan JR, Juiz JM. Expression and developmental regulation of the K+-Cl− cotransporter KCC2 in the cochlear nucleus. Hear Res. 2005;206:107–115. doi: 10.1016/j.heares.2005.03.012. [DOI] [PubMed] [Google Scholar]
- Voipio J, Kaila K. GABAergic excitation and K+-mediated volume transmission in the hippocampus. Prog Brain Res. 2000;125:329–338. doi: 10.1016/S0079-6123(00)25022-X. [DOI] [PubMed] [Google Scholar]
- Williams S, Vachon P, Lacaille JC. Monosynaptic GABA-mediated inhibitory postsynaptic potentials in CA1 pyramidal cells of hyperexcitable hippocampal slices from kainic acid-treated rats. Neuroscience. 1993;52:541–554. doi: 10.1016/0306-4522(93)90404-4. [DOI] [PubMed] [Google Scholar]
- Wozny C, Kivi A, Lehmann TN, Dehnicke C, Heinemann U, Behr J. Comment on “On the origin of interictal activity in human temporal lobe epilepsy in vitro”. Science. 2003;301:463. doi: 10.1126/science.1084237. [DOI] [PubMed] [Google Scholar]
- Wozny C, Gabriel S, Jandova K, Schulze K, Heinemann U, Behr J. Entorhinal cortex entrains epileptiform activity in CA1 in pilocarpine-treated rats. Neurobiol Dis. 2005;19:451–460. doi: 10.1016/j.nbd.2005.01.016. [DOI] [PubMed] [Google Scholar]
- Zhu L, Polley N, Mathews GC, Delpire E. NKCC1 and KCC2 prevent hyperexcitability in the mouse hippocampus. Epilepsy Res. 2008;79:201–212. doi: 10.1016/j.eplepsyres.2008.02.005. [DOI] [PMC free article] [PubMed] [Google Scholar]