

Abstract
We show that siRNA-mediated suppression of protein tyrosine phosphatase α (PTPα) reduces Src activity 2 to 4-fold in breast, colon and other human cancer cell lines. Src and PTPα RNAi induced apoptosis in estrogen receptor (ER)-negative breast cancer and colon cancer cells, but not in immortalized noncancerous breast cells, ER-positive breast cancer cells or other cancer cell types tested. RNAi of other Src family members (Fyn and Yes) or of PTP1B, a phosphatase previously suggested to be an activator of Src in breast cancer, had no effect. Although further tests with primary tumor tissues are required, the unexpected correlation between ER status and Src/PTPα dependence in breast cancer cell lines may be important for planning therapeutic strategies, and the insensitivity of normal breast cells to the RNAi highlights the potential of PTPα, which may be easier to target than Src, as a therapeutic target in ER-negative breast cancer.
Keywords: PTPα, Src, RNAi, breast cancer, colon cancer, estrogen receptor
A large fraction of human breast and colon cancers have increased Src protein tyrosine kinase activity.1,2 In contrast with oncogenes such as ras, which are frequently activated by mutation, src is only rarely mutated in human cancer. Its increased activity occasionally results from increased expression,3 but in most cases it results from activation of a normal amount of protein.4 Although many suggestions have been made, the mechanism accounting for its activation in these cancers is unknown.
One possibility is activation via members of the human epidermal growth factor receptor (EGFR/HER) family, which are over-expressed in a majority of human breast cancer tissues and cell lines.5 Src associates with HER1 and HER26 and can be activated by these proteins in human breast and colon cancer cells and in a mouse breast cancer model.4–7 High HER family expression is prognostic for more aggressive disease and poor clinical outcome.8 However, HER expression is strongly anticorrelated with that of the estrogen receptor (ER),9,10 a predictor of better clinical outcome, so it is difficult to distinguish the influences of these 2 receptors.
Whatever the upstream regulators, Src activation almost certainly involves disruption of the intramolecular association between its SH2 domain and phosphorylated Tyr530, which is near its COOH terminus.11 Phosphorylation of Tyr530 is controlled by the opposing effects of the c-Src kinase (CSK) protein tyrosine kinase12 and protein tyrosine phosphatase α (PTPα)13,14; thus, decreased CSK or increased PTPα activity would alone be sufficient to activate Src. There does not appear to be a deficit of CSK in most breast cancer carcinomas and cell lines,15 but PTPα overexpression has been reported in breast cancer16 and late stage colon carcinomas,17 suggesting that it may participate in Src activation. However, this suggestion has been called into question by a study reporting that PTP1B, and not PTPα, is required for activation of Src in an ER− cell line.18
Src is rarely mutated in human cancer, suggesting that it is involved in later stages of carcinogenesis and plays a supporting, rather than an initiating, role.2,19 Indeed, studies with inhibitors and antisense reagents indicate that Src activity is required for survival and proliferation of breast5,20–22 and colon22–24 cancer lines. Src is therefore regarded as a promising therapeutic target in breast and colon cancers.25
Unfortunately, anti-Src inhibitors frequently act on other kinases as well,26 so obtaining sufficient therapeutic specificity may pose a challenge. Studies showing that genetic knock-out of PTPα abrogates the mitotic activation of Src13 while having no apparent effect on mouse survival27,28 suggest that PTPα might be a useful surrogate target whose inhibition might block growth or survival of human breast and/or colon cancer cells. We have examined this possibility using double-stranded siRNAs to silence Src or PTPα expression in a variety of breast, colon and other cancer cell lines. We find that PTPα RNAi reduces Src specific activity in all the transformed lines. Moreover, we show that inhibiting expression of either protein induces apoptosis in ER− breast and colon cancer cells but not in ER+ breast or other cancer cell lines tested.
Material and methods
Reagents
All cell lines were purchased from ATCC (Manassas, VA) except for HB229 which was a gift from Dr. B. Pauli (Cornell University). All lines were grown in monolayer culture in DMEM (containing 4.5 g/l glucose and 2 mM glutamine) plus 10% fetal bovine serum (FBS), 3.7 g/l NaHCO3 and penicillin/streptomycin [(100 units/ml)/(100 μg/ml)], except that MCF-10A medium also contained EGF (10 ng/ml), insulin (5 μg/ml) and hydrocortisone (0.5 μg/ml). Cells were maintained at 37°C, 10% CO2, 90% humidity.
Anti-PTPα 7-091, anti-PTPα D2 (7-054)30 and anti-Src mAb32731 antibodies have been described. Anti-Fyn (SC-16) and anti-Yes (SC-14) rabbit polyclonal antibodies were from Santa Cruz Biotechnology (Santa Cruz, CA), anti-PTP1B (P18020) and anti-Fyn (F19720) monoclonal antibodies were from BD Bio-sciences (San Jose, CA) and anti-PTPε polyclonal antibody (AP8416a) was from Abgent (San Diego, CA). HRP-linked secondary antibodies for immunoblots were from Jackson ImmunoResearch (West Grove, PA). Protein A-sepharose beads (used with polyclonal antibodies) and GammaBind sepharose beads (used with monoclonal antibodies) were from Amersham Biosciences (Piscataway, NJ).
The siRNA sequences (Table I) were selected according to criteria suggested by Tuschl and coworkers,32 checked for lack of similarity to any other sequences in GenBank, and synthesized by Dharmacon Research (Lafayette, CO). Reversed (complementary strand) and mutated sequences were used as negative controls. In addition, Fyn and Yes siRNAs (proprietary sequences) were obtained from Upstate (Waltham, MA).
TABLE I.
siRNA SEQUENCES
| Sequence | |
|---|---|
| siRNA | |
| Src | 5′-GAA GCU GAG GCA UGA GAA G dTdT-3′ |
| PTPα | 5′-AAG CUG GGA GCC AUU CCA AUU dTdT-3′ |
| PTPα2 | 5′-GCU GGG AGC CAU UCC AAU U dTdT-3′ |
| PTPα3 | 5′-GGC CUG UAA CCC UCA GUA U dTdT-3′ |
| PTPα4 | 5′-AGC CCU UCU GGA GCA UUA U dTdT-3′ |
| PTP1B | 5′-AAU ACA GUG CGA CAG CUA GAA dTdT-3′ |
| Control siRNA | |
| Src mutant | 5′-GAA ACU GAG ACA UGA GGA G dTdT-3′ |
| Reverse PTPα | 5′-AAU UAA CCU UAC CGA GGG UCG dTdT-3′ |
| PTPα2 mutant | 5′-GCU AGG AGC UAU UCC GAU U dTdT-3′ |
| PTPα3 mutant | 5′-GGC UUG UAA UCC UCA AUA U dTdT-3′ |
The positions of the mutations are indicated by italics. The Src, PTPα, reverse PTPα (negative control) and PTP1B sequences were used in the experiments shown in Figures 2, 3a–3c and 4. PTPα2, PTPα3 and PTPα4 (positive controls) and the mutant sequences (negative controls) were used in additional experiments (Fig. 3d) to demonstrate that the PTPα and Src RNAi results were not due to off-target effects.
Lipofectamine (LFA), EGF, OptiMEM and FBS were from Invitrogen (Carlsbad, CA), insulin and hydrocortisone from EMD Biosciences (San Diego, CA), charcoal/dextran-treated FBS from Hyclone (Logan, UT) and 17-β-estradiol from Sigma-Aldrich (St. Louis, MO).
Transfection and siRNA knockout
Cells were plated in 100-mm dishes in growth medium without antibiotics at 25–30% confluence and after ~24 hr (50–60% confluence) were transfected essentially as described32 except that LFA was substituted for Oligofectamine. For each dish, 15 μl of siRNA (40 μM) was combined with 600 μl of OptiMEM and 30 μl of LFA was combined with 300 μl of OptiMEM, and each mixture was individually incubated for 15 min at room temperature. The 2 solutions were combined and incubated for an additional 20 min at room temperature to facilitate formation of the siRNA–LFA complex. Three milliliters of OptiMEM was added to each siRNA–LFA mixture, mixed gently and added to the cell monolayer that had been washed twice with 5 ml of OptiMEM. After incubation for 4 hr at 37°C/10% CO2, the transfection medium was removed and the cells were refed with 10 ml of fresh growth medium without antibiotics and incubated for an additional 24–96 hr as specified. In some cases, 60-mm dishes were used and the number of cells and the amount of each reagent was decreased proportionately to the smaller surface area. The extent of protein suppression was analyzed after 24–96 hr (as specified) by preparing cell lysates and immunoblotting as described.30
Protein expression level and Src activity assays
These were performed as described on dividing cells at 80–90% confluence.30 Linear response of the immunoblots to protein amount was verified by titering the amount of lysate used.
Generic phosphatase assay
Radioactive phospho-myelin basic protein (MBP) substrate was prepared by tyrosine phosphorylation by v-Src using [γ-32P ]ATP as described.30 Dividing cells (80–90% confluence) were washed with cold PBS, lysed in 0.5 ml HN lysis buffer without vanadate (50 mM Hepes pH 7.2, 150 mM NaCl, 2 mM EDTA, 50 mM NaF, 1% NP40, 10 μg/ml aprotinin, 10 μg/ml leupeptin and 1 mM PMSF) and assayed as described30 except for the following modification: Cell lysates containing 500 μg total protein were first pre-cleared by incubation with 2 μl anti-PTPα D2 preimmune serum for 1 hr at 4°C followed by incubation with 20 μl of a 50% suspension of protein A-sepharose beads for an additional 1 hr. The mixtures were centrifuged and the supernatants were incubated with 2 μl anti-PTPα D2 polyclonal antiserum for 2 hr at 4°C and immune complexes were incubated with 20 μl of a 50% suspension of protein A-sepharose beads for an additional 1 hr. The immunoprecipitate–bead complexes were washed once with HN buffer without vanadate supplemented to 0.5 M NaCl, twice with HN buffer without vanadate, once with 50 mM imidazole pH 7.2 and then resuspended in 150 μl imidazole pH 7.2 buffer. Aliquots (15 μl) were then supplemented to 5 mM DTT and incubated with 6 μg phospho-MBP substrate for 10 min at 30°C. Released radioactive phosphate was measured by scintillation counting.
Soft agarose assay
Cells were transfected with the specified siRNAs as described earlier, incubated for 24 hr, trypsinized, and 105 cells/plate (duplicate plates in each experiment) were assayed for colony formation after 14 days (except for MDA-MB-436 cells, ~30 days) growth in semisolid growth medium containing 0.2% agarose as described.30 The remaining trypsinized cells were replated in monolayer culture for an additional 48 hr and lysates were analyzed by immunoblotting to measure protein expression levels.
Apoptosis assays
Caspase activation
Cells were transfected with siRNAs as described earlier (except that cells were at 25–30% confluence at the time of transfection) and were allowed to grow for an additional 96 hr. The adherent cells were trypsinized, combined with the nonadherent cells, collected by low-speed centrifugation and caspase activation was determined using the CaspaTag kit (Chemicon International; Temecula, CA) as described by the manufacturer. Cells were fixed, stained with DAPI to visualize nuclear DNA, mounted on glass slides and analyzed by immunofluorescence microscopy. Corresponding lysates were analyzed for protein expression levels.
PARP cleavage
Cells were transfected with siRNAs as described earlier and allowed to grow for an additional 72 hr. Cells were lysed and protein was separated by SDS-PAGE (10%), transferred to Immobilon and incubated overnight at 4°C with anti-PARP1 antibody (Cell Signaling Technology; Danvers, MA; No. 9542). After incubation with a HRP-conjugated secondary antibody, full-length (116 kDa) and cleaved (89 kDa) poly(ADP ribose) polymerase1 (PARP1) proteins were visualized by enhanced chemiluminescence.
Quantitative analysis of RNAi data
Protein expression, kinase activity and colony formation in soft-agarose were normalized to their values in the reverse PTPα siRNA control. (Protein expression levels in the reverse PTPα siRNA-, mutant PTPα siRNA-, and no siRNA-treated control cells typically differed by 5–10%; Table II.) Protein suppression typically ranged from 70 to 95% in different experiments, except that only modest suppression of Src expression was achievable in SKBR3 (~50% suppression) and the colon cancer lines: HCT-15 (~50% suppression), HCT-116 (~70%) and HT-29 (~50%). Thus, while qualitative conclusions can be drawn from the Src RNAi experiments with these 3 lines, their quantitative results must be interpreted cautiously.
TABLE II.
RESIDUAL PROTEIN EXPRESSION FOLLOWING siRNA TREATMENT
| Cell line
|
|||
|---|---|---|---|
| MDA-MB-231 | MCF-7 | HCT-116 | |
| siRNA | |||
| Src | 0.12 | 0.14 | 0.27 |
| PTPα | 0.09 | 0.19 | 0.22 |
| PTPα2 | 0.09 | 0.20 | 0.19 |
| PTPα3 | 0.10 | 0.21 | 0.19 |
| PTPα4 | 0.12 | 0.19 | 0.17 |
| Control siRNA | |||
| Src mutant | 0.97 | 1.02 | 1.01 |
| Reverse PTPα | 0.99 | 1.06 | 1.00 |
| PTPα2 mutant | 0.89 | 0.94 | 1.04 |
| PTPα3 mutant | 0.90 | 1.07 | 1.16 |
Src (PTPα) protein expression levels were measured by immunoblotting 48 hr after transfection with Src (PTPα) or no siRNA. The average residual expression level relative to its level in mock-treated control cells is shown. Individual measurements typically varied by ~10% about the average values in repeated experiments.
Simple averaging of results after RNAi would not account for differences in protein suppression in different experiments and between different cell lines. To reduce this error, the dependence of activity (A) on protein expression level (P) was modeled by the simple linear relation A/A0 = (1 − b) + bP/P0, where A0 (P0) was the activity (protein expression level) measured with the reverse siRNA control and b is the coefficient of dependence. This gives greater statistical weight to the experiments having larger siRNA suppression of protein expression. The model provided a reasonable fit to the data in those cases where the number of experiments was sufficiently large (n ≥ 5) for meaningful examination. b and its standard error of estimate were determined by linear regression with fixed intercept using standard statistical methods.33 1−b, the estimated activity that would remain when P = 0, and the standard error are plotted in the bar charts in Figures 2b, 3b, 3c and 4b. The corrections affected only quantitative, not qualitative, results.
Figure 2.
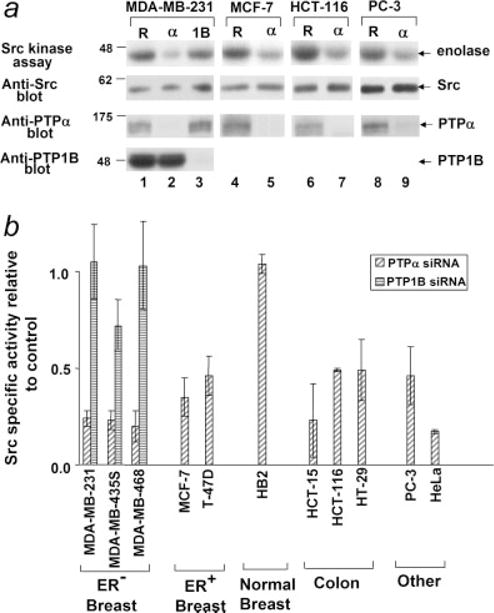
Effect of PTPα and PTP1B RNAi on Src kinase specific activity. Cells were transfected with PTPα (α), PTP1B (1B) or the reverse PTPα control (R) siRNAs and lysates were prepared after 48 hr. Protein expression was assayed by immunoblotting with anti-PTPα, -PTP1B and -Src antibodies and Src protein activity was measured in the immune complex kinase assay using enolase as substrate. (a) Examples of the effects of the siRNAs in ER− breast cancer (MDA-MB-231), ER+ breast (MCF-7), colon (HCT-116) and prostate (PC-3) cancer cell lines. Panels (top to bottom): autoradiographs of [32P]enolase after the Src kinase assay and immunoblots of Src, PTPα and PTP1B after the indicated siRNA treatments. (b) Src kinase specific activity was measured in experiments as shown in panel (a). Specific activity (relative to activity in the reverse PTPα siRNA-treated control cells) after suppression of PTPα or PTP1B expression by RNAi was calculated as described in Material and Methods. Standard errors from 3 to 5 (all breast cancer lines, HCT-15 and PC3) or 2 (other lines) independent experiments are indicated. Src activity was suppressed by PTPα RNAi in all lines except for HB2; the reductions were statistically significant at α = 0.05 except for HT-29. None of the PTP1B RNAi effects were statistically significant.
Figure 3.
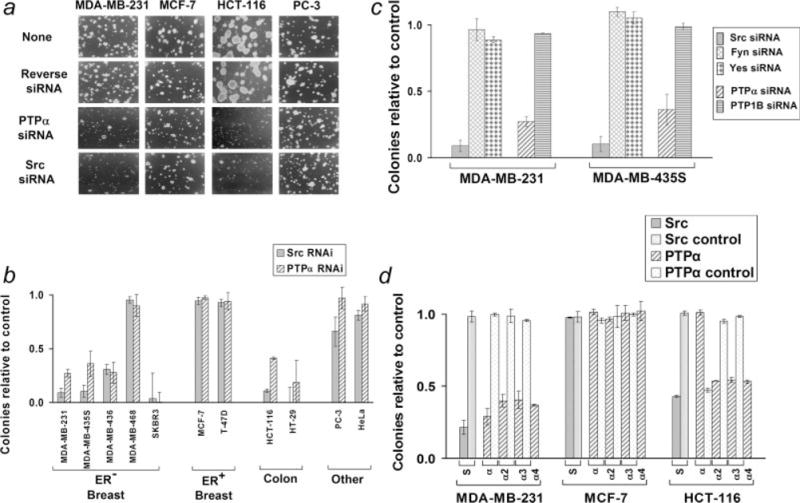
Effect of Src and PTPα RNAi on anchorage-independent growth. (a) Cells were transfected with no, reverse PTPα, PTPα or Src siRNAs as indicated, suspended in semisolid medium containing soft agarose, and monitored for colony formation. (b) Colony formation (relative to colony formation by reverse PTPα siRNA-treated cells) after suppression of Src or PTPα by RNAi was measured in experiments as shown in panel (a) and was analyzed by linear regression as described in Material and Methods. Standard errors are indicated. Three or more independent experiments were performed for all cell lines except SKBR3, HT-29, PC-3 and HeLa (Src) for which 2 experiments each were used. The values for SKBR3 and HT-29 are included for completeness but should be viewed with caution since they represent extrapolations from the observed ~50% reduction of colony formation observed at Src and PTPα suppression levels of ~50–60% to colony formation at complete suppression (see text). p-values for the null hypothesis that the RNAi had no effect on colony formation were: MDA-MB-231 (Src, <10−7; PTPα, <10−10), MDA-MB-435S (0.004; 0.01), MDA-MB-436 (0.04; 0.09), SKBR3 (0.15; 0.05), HCT-116 (<10−3; <10−9) and HT-29 (0.09; 0.16). (c) The colony-forming ratios from similar experiments using Fyn, Yes and PTP1B siRNAs are shown with the Src and PTPα RNAi results from panel (b) repeated for comparison. (d) Similar colony-forming experiments were performed in representative ER+ and ER− breast cancer and colon cancer lines with Src, PTPα and reverse PTPα siRNAs and the additional (positive control) PTPα2, PTPα3 and PTPα4, and (negative control) Src mutant, PTPα2 mutant and PTPα3 mutant siRNAs. Average colony formation (relative to no-siRNA control transfection) and standard error (calculated without correction by linear regression) from 2 or more experiments is shown. Average Src and PTPα protein suppressions by the siRNAs are shown in Table II. (S: Src and Src mutant, α: PTPα and reverse PTPα, α2: PTPα2 and PTPα2 mutant, α3: PTPα3 and PTPα3 mutant, α4: PTPα4 siRNAs).
Figure 4.
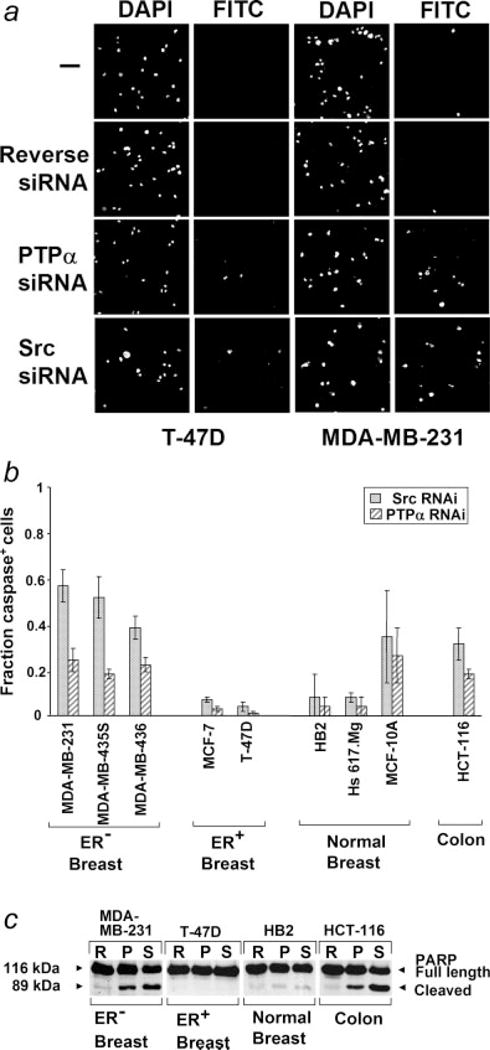
Induction of apoptosis by Src and PTPα RNAi. (a) Cells were transfected with reverse PTPα, PTPα or Src siRNAs and caspase activation was measured after 96 hr using a fluorescent caspase inhibitor binding assay. Cell nuclei or caspase-positive cells were visualized by DAPI or FITC staining, respectively. (b) The fraction of caspase activation-positive cells (after subtracting the ~1–2% of caspase-positive cells in the control siRNA-treated cells) is shown. Standard errors from 3 to 5 (MDA-MB-231, MDA-MB-435, MCF-7) or 2 (all others) experiments are indicated. The RNAi-induced increases observed with MDA-MB-231 and MDA-MB-435 were statistically significant at α = 0.05 and the increases observed with MDA-MB-436 and HCT-116 (PTPα only) were significant at α = 0.10. (c) Cells were transfected with reverse PTPα, PTPα or Src siRNAs and anti-PARP1 immunoblots were prepared after 72 hr from lysates adjusted to contain equal amounts of PARP1. Cleavage of PARP1 is an indicator of apoptosis.
p-values for b were computed using the t-distribution with n−1 degrees of freedom and 2 tails.33
Results
Studies were conducted with the following cell lines: Five ER− human breast cancer lines10 (MDA-MB-231, MDA-MB-435S, MDA-MB-436, MDA-MB-468 and SKBR3), 2 ER+ human breast cancer lines10 (MCF-7 and T47-D), 3 immortalized cell lines established from normal human breast tissue (HB2, Hs 617.Mg and MCF-10A), 3 colon cancer lines (HCT-15, HCT-116 and HT-29) and 2 lines established from other cancer types [PC-3 (prostate) and HeLa (cervix)]. (We note that expression array analysis of MDA-MB-435, the parent cell line of MDA-MB-435S, suggests that this cell line may have been established from an occult melanoma, rather than a metastatic breast adenocarcinoma.34 This possibility has been considered in interpreting the results.)
Src and PTPα expression and activity
Expression levels in dividing cells (80–90% confluence) were measured by immunoblotting, and activities were assessed from immune-complex assays with enolase (Src) or phosphorylated myelin basic protein (PTPα) as substrates. No significant differences were observed in expression of either Src or PTPα in the indicated cell lines (Fig. 1a). PTPα activities toward phospho-MBP were similar in the tested cell lines, with perhaps a modest increase in the cancer-derived lines (Fig. 1b). The ability of PTPα to dephosphorylate Src can differ significantly from its ability to dephosphorylate “generic” substrates such as phospho-MBP,13,30,35 but we have not been able to immunopurify sufficient PTPα from these cells for the Src-specific assay and available anti-PTPα antibodies block the ability of PTPα to dephosphorylate Src (unpublished results). In contrast, but consistent with prior results indicating activation of Src in breast cancers,1,2,4 Src specific activity was 5–10 times higher in the breast cancer lines than in the immortalized breast-derived lines (Fig. 1b). Src specific activity in the colon, prostate and cervical cancer lines were almost as high as in the breast cancer lines.
Figure 1.
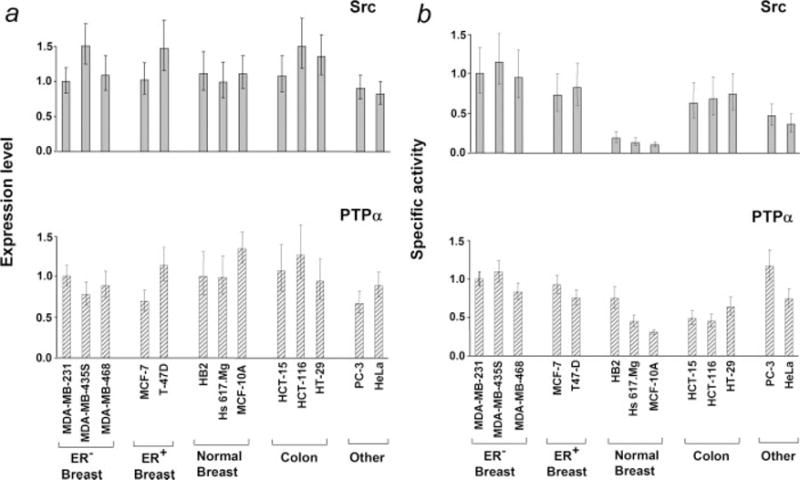
Src and PTPα expression levels and enzymatic activities. (a) Expression levels of Src or PTPα were measured by immunoblotting cell lysates containing equal amounts of total cell protein with monoclonal antibody MAb327 or anti-PTPα polyclonal antibody 7-091 respectively. (b) Src kinase or PTPα generic phosphatase activities were measured in immune complex assays using enolase or Src-phosphorylated MBP as substrates. Relative specific activities are displayed. All values are normalized to those of MDA-MB-231. In both panels, values are normalized to those of MDA-MB-231 and error bars indicate the standard error of the mean from 3 or more independent experiments.
siRNAs
In preparation for RNAi experiments, 2 Src and 5 PTPα siRNA sequences were tested for their ability to suppress cognate protein expression in MDA-MB-231, MCF-7 and HCT-116 cells. One of the Src and 4 of the PTPα sequences (Table I) suppressed protein expression by 80–95% in the breast cancer cell lines and by 60–80% in the colon cancer cell line [Table II and Fig. 2a; the somewhat reduced suppression observed with HCT-116 was also observed with the other colon cancer lines (data not shown)]. No additional suppression of PTPα expression was observed when PTPα2, PTPα3 and PTPα4 were pooled and transfected (data not shown). Maximal suppression of expression was observed by 48 hr after transfection and persisted for at least 96 hr.
A PTP1B siRNA sequence (Table I) was also tested and shown to reduce PTP1B expression by 80–95% in MDA-MB-231, MDA-MB-435S and MDA-MB-468 cells without affecting either Src or PTPα expression (Fig. 2a and data not shown).
Four control siRNAs—the reverse PTPα sequence and sequences containing 3 point mutations each relative to Src, PTPα2 and PTPα3 (Table I)—were tested and found to have no (±10%) effect on expression of their cognate protein (data not shown). Additional tests showed that the Src and Src mutant siRNAs had little or no effect on PTPα expression and no effect on Fyn or Yes expression, and that the PTPα and reverse PTPα siRNAs had no effect on Src, Fyn, Yes, PTPε or PTP1B expression (Fig. 2a and data not shown).
Subsequent experiments were conducted primarily with the Src and PTPα siRNAs using the reverse PTPα siRNA as control. Additional experiments (Fig. 3d) were performed using the Src mutant, PTPα2, PTPα3, PTPα2 mutant and PTPα3 mutant siRNAs to further exclude potential off-target effects.
PTPα suppression decreases Src activity in cancer cells
RNAi was used to investigate the role of PTPα in regulating Src kinase activity in cancer cells lines. Src activity was measured 48 hr after transfection with the PTPα siRNA and the fraction of activity remaining after complete suppression of PTPα expression was estimated by linear regression from multiple experiments. PTPα suppression reduced Src kinase activity by at least 2-fold in all the cancer lines but not in the immortalized HB2 line (Fig. 2). [The effect of PTPα RNAi on the other immortalized noncancerous lines Hs617.Mg and MCF-10A could not be accurately measured because of their very low basal levels of Src activity (Fig. 1b).]
The observed reductions were statistically significant at α = 0.05 except for that of HT-29. (Statistical significance was reduced for HT-29 because only a ~70% suppression of PTPα expression could be achieved. Nonetheless, this suppression reduced Src specific activity by ~40%, consistent with moderate regulation by PTPα of Src activity to the same extent as that observed with the other colon cancer lines.)
It has been suggested that PTP1B regulates Src activity in MDA-MB-435S cells,18 so we also examined the effect of PTP1B RNAi on Src kinase activity in 3 ER− lines. Transfection with a PTP1B siRNA reduced PTP1B expression by 80–95% (Fig. 2a) but had no effect on Src activity in MDA-MB-231 and MDA-MM-468 and only a small, statistically insignificant effect in MDA-MB-435S (Fig. 2b). We conclude that PTPα but not PTP1B activates Src in these breast cancer cells.
Effect of Src or PTPα silencing on anchorage-independent growth
We tested the requirement for PTPα and Src for colony formation in semisolid medium using the PTPα and Src siRNAs with the reverse PTPα siRNA as a negative control. The cancer cell lines used in Figures 1 and 2 were used, and some experiments were performed with the additional ER− lines MDA-MB-436 and SKBR3, which were added once it became evident that ER status correlated with the effect of the siRNAs on anchorage-independent growth. All the transformed cell lines formed colonies in soft agarose with 50–90% efficiency (data not shown). Cells were transfected with indicated siRNAs and aliquots were removed to measure protein expression and colony formation (Figs. 3a and 3b). Src and PTPα RNAi strongly reduced colony formation by 4 of the 5 ER− breast cancer lines and both colon cancer lines, but did not significantly affect colony formation by MDA-468 or by the ER1 breast cancer lines, PC3 and HeLa. These reductions were statistically significant at α = 0.05 except those for MDA-MB-436 (PTPα) and HT29 (Src), which were significant at α = 0.10, and SKBR3 (Src) and HT-29 (PTPα), which did not achieve statistical significance. Except for MDA-MB-468, all the results were qualitatively consistent with the conclusion that Src and PTPα RNAi suppressed anchorage-independent growth in the ER− breast cancer and colon cancer cell lines, but not in the ER+ breast cancer or other cancer cell lines.
[The results with SKBR3 and HT-29, even though consistent with those of the other ER− breast cancer and colon cancer lines, respectively, must be treated with some caution because we were only able to achieve ~50–60% protein suppression of both Src and PTPα in these 2 cell lines (rather than the ~80–90% suppression typical of the other lines). Thus, in these cases the extrapolation to complete suppression provided by the linear regression analysis (to facilitate cell line comparison) is not trustworthy and is included only for completeness. Nonetheless, in both cases the associated reduction of colony formation was ~50%, making it evident that anchorage-independent growth in these cell lines also depends on Src and PTPα expression.]
The reverse PTPα siRNA had <5% effect on colony formation, even in the ER− breast cancer cells. To further exclude the possibility that off-target effect were involved in the suppression of anchorage-independent growth, additional colony forming experiments were performed using the PTPα2, PTPα3, PTPα4, Src mutant, PTPα2 mutant and PTPα3 mutant siRNA sequences in representatives of the ER− and ER+ breast cancer and colon cancer lines: MDA-MB-231, MCF-7 and HCT-116, respectively. Although the PTPα2, PTPα3 and PTPα4 siRNAs suppressed anchorage-independent growth to the same extent as the PTPα siRNA, the mutant siRNAs had no effect (Fig. 3d). Thus, off-target effects are unlikely.
To test if the lack of effect of the Src and PTPα siRNAs on the ER+ breast cancer cells depended on the presence of estrogen, the cells were suspended in soft agarose containing phenol red-free DMEM and 10% charcoal/dextran-treated (estrogen-depleted) FBS either with or without 4 nM 17-β-estradiol. This did not affect the results: neither Src nor PTPα siRNA affected anchorage-independent growth of MCF-7 or T-47D cells under these conditions (data not shown).
To test if other Src family members could also inhibit anchorage-independent growth, we transfected MDA-MB-231 and MDA-MB-435S cells with commercial Fyn and Yes siRNAs that suppressed expression by 70–90%. Neither siRNA affected anchorage-independent growth (Fig. 3c). Moreover, in contrast with PTPα, PTP1B RNAi did not affect anchorage-independent growth (Fig. 3c).
Effect of Src or PTPα silencing on apoptosis
To test if the suppression of anchorage-independent growth by Src and PTPα RNAi resulted from induction of apoptosis, representative breast and colon cell lines were transfected with indicated siRNAs and caspase activation was measured after 4 days using a cell-based fluorescence assay (Figs. 4a and 4b). Three of the 4 ER− lines that underwent inhibition of soft agar growth were tested; all 3 displayed pronounced apoptosis in response to Src siRNA (40–60% cells caspase-positive), accounting at least in part for the suppression of anchorage-independent growth. The HCT116 colon cancer line and one of the 3 immortalized breast lines (MCF-10A) also underwent apoptosis. The other 2 immortalized breast lines and, as expected, the ER+ breast cancer lines showed no detectable apoptotic response. The different cell lines responded in the same manner to the PTPα siRNA, though the percentage of caspase-positive cells was lower in each case.
The induction of apoptosis by Src and PTPα siRNAs in ER− breast cancer and colon cancer cells, but not in ER+ breast cancer or an immortalized breast line was confirmed by testing 1 representative of each cell type for cleavage of PARP1, another indicator of apoptosis.36 Consistent with the caspase study, PARP1 cleavage was observed after treatment with either the Src or PTPα siRNA in the colon and ER− breast cancer lines, but not in the immortalized breast or ER+ breast cancer lines (Fig. 4c).
Discussion
We have shown that suppressing PTPα expression by RNAi in ER− breast cancer and colon cancer cells can downregulate Src kinase activity and that this, or Src RNAi itself, can suppress anchorage-independent growth and induce apoptosis. Although PTPα RNAi also suppressed Src kinase activity in ER+ breast cancer cells and 2 other tested cancer cell types (prostate and cervix), it did not inhibit their growth or survival. Moreover, neither PTPα nor Src RNAi induced apoptosis in 2 of 3 untransformed breast cell lines tested. Neither Fyn nor Yes siRNAs inhibited anchorage-independent growth of the ER− breast cancer lines, so we conclude that the requirement is specific for Src.
Off-target RNAi effects seem unlikely since similar suppression of anchorage-independent growth was observed with 4 different PTPα siRNAs of completely different sequence. Moreover, reverse and point mutant siRNA control sequences had no effect. Immunoblotting was used to confirm the specificity of the RNAi inhibitions: the Src RNAi did not affect PTPα, Fyn or Yes expression and the PTPα siRNA did not affect Src, PTP1B or PTPε expression.
Our Src results are consistent with previous inhibitor and antisense studies that have shown that suppressing Src family activity inhibits growth and/or survival of the HT-29 colon cancer cell line.22–24 However, they are inconsistent with other studies showing that individual Src inhibitors can suppress the growth of the ER+ cell lines MCF-7 and T47-D.20,21 It may be that the suppression observed in these prior studies was due to off-target effects or to greater inhibition of Src activity than was achieved by the more specific, but possibly less complete, RNAi inhibition. Alternatively, it is possible that inhibition of Src’s kinase function but not its adaptor function (i.e., by an enzymatic inhibitor) might suppress growth while simultaneous inhibition of both functions by RNAi might not. Another report described Src siRNA-mediated inhibition of proliferation and cell spreading of MCF7 cells37; however, effects on anchorage-independent growth and apoptosis were not directly assessed in that study. We do not exclude the possibility that ER+ breast cancer cells require some level of Src activity for survival, but conclude that their requirement is lower than that of the tested ER− cells.
PTPα RNAi reduced Src’s specific kinase activity by 50–80% in all of the transformed lines but not in an immortalized non-cancer cell line. Src activity was reduced even in those transformed lines whose growth was not suppressed, implying that the reduction was not a secondary effect of apoptosis. This dependence of Src activity on PTPα is consistent with the observation that PTPα is specifically required for the normal mitotic activation of Src.13
It is likely that the antiproliferative and proapoptotic effects of PTPα RNAi were consequences of this deactivation of Src. Consistent with this, the abilities of PTPα RNAi to inhibit anchorage-independent growth and induce apoptosis were completely correlated with those of Src RNAi, with the PTPα effects being somewhat weaker (Figs. 3 and 4). PTPα RNAi induced apoptosis even though the residual Src activities remaining (20–50%; Fig. 2b) were commensurate with its activity in the untransformed breast cells. This suggests that the high Src specific activity observed in the transformed cells is required for the transformed phenotype. Even though PTPα can regulate Fyn as well as Src,27,28 the Fyn and Yes siRNA experiments (Fig. 3c) indicate that potential suppression of these targets is not important for the inhibition of anchorage-independent growth by PTPα RNAi.
Although PTPα is required to support the high specific activity of Src in the cancer cell lines, we do not know if increased PTPα activity causes this high activity. The specific activity of PTPα tended to be lower in the untransformed than in the transformed breast cell lines when measured using phospho-MBP as substrate, but the significance of the modest 2-fold difference observed is unclear. However, we have previously shown that PTPα’s Src-directed activity can be regulated independently of its activity on such generic substrates13,30 and it is possible that this activity is increased in the transformed cells. Unfortunately, technical limitations have precluded a direct test of this hypothesis so far.
Our results differ from Bjorge et al.18 who concluded that PTP1B, not PTPα, is the major PTP responsible for regulating Src in MDA-MB-435S cells: We found that PTP1B siRNA did not inhibit Src activity or anchorage-independent growth of MDA-MB-435S or the other ER− lines (Figs. 3b and 3c). Bjorge et al. based their conclusion on the observation that PTP1B (and not PTPα) was present in the column fractions from MDA-MB-435S cell lysates that had maximal PTP activity against Src in an in vitro assay. However, this assay may not accurately reflect the in vivo situation, particularly since no controls were performed to ensure that it was capable of measuring Src-directed PTPα activity: PTPα must be phosphorylated at Tyr 789 near its COOH terminus for it to be able to dephosphorylate Src,30 and it may have been dephosphorylated during the course of the Bjorge et al. purification procedure. In addition, the dephosphorylation buffer used contained 1 mM tetramisole, which is a serine/threonine phosphatase inhibitor but one which can also inhibit PTPs38,39 and therefore possibly PTPα.
In control experiments, we showed that the PTPα siRNA did not affect its close relative PTPε. However, we do not exclude the possibility that PTPε may act in parallel with PTPα and also activate Src to some extent in these cells; it may account for the residual specific activity remaining after PTPα RNAi. Supporting this possibility, Gil-Henn and Elson40 have shown that cells from mammary tumors induced by HER2 overexpression in PTPε-deficient mice have reduced Src activity and proliferation relative to those from tumors induced in wild-type mice. It will be interesting to determine if PTPε RNAi induces apoptosis or suppresses cell growth in a similar cancer-type specific manner.
The correlation between ER status and sensitivity to Src or PTPα silencing suggests that a role for PTPα-Src signaling in ER− cells is supplanted by ER-dependent survival signaling in ER+ cancer cells. While there is evidence that Src may be involved in nongenomic actions of ER,41 our results suggest that ER-mediated survival/proliferative signals in ER+ cells are Src independent (and thus are most likely transcriptional). In contrast to the other ER− cell lines, MDA-MB-468 colony-forming activity was not inhibited by Src or PTPα knockdown. While we do not know the reason for this, we have determined that the PTPα gene in this cell line differs from that in the other cell lines used by a single nucleotide polymorphism (data not shown). The possibility that this polymorphism might play a role in the cell line’s refractoriness to Src or PTPα siRNA-mediated apoptosis is being investigated.
The dependence on ER status might be related to the inverse correlation of the levels of ER and HER1 expression: most ER+ cells have relatively low HER1 expression.9 For instance, there is approximately one-eighth as much HER1 in ER+ MCF-7 cells as in ER− MDA-MB-231 cells (data not shown and Ref.42). Therefore, the apparent specificity for ER status may actually reflect specificity for HER1 expression. In accord with this hypothesis, in a study of 14 breast cancer cell lines HER1-Src complexes and potentiation of EGF-induced tyrosyl phosphorylation and transformation was observed primarily in ER− cell lines. In particular, no Src-HER1 association was observed in MCF-7 cells.42 This suggests that ER− breast cancer cells are more likely than ER+ breast cancer cells to rely on HER1-Src cooperation for survival. The report of Ardini et al.,16 who found in a study of 50 breast tumors that PTPα overexpression significantly correlated with positive ER status, might be relevant in this context.
To assess the possibility that the requirement for Src/PTPα for survival reflects HER1 status, we independently measured expression of HER1 (and HER2) by immunoblotting in all the cell lines used in the current study (data not shown). From this analysis, we conclude that a simple, direct relationship between Src/PTPα dependence and HER1 status is unlikely. For instance, the 1 ER− cell line that did not respond to Src/PTPα siRNAs, MDA-MB-468, expresses very high levels of HER1, whereas 1 ER− line that was responsive to RNAi, MDA-MB-435S, did not express detectable HER1 protein. Moreover, of the noncancer immortalized breast cell lines, the nonresponsive HB2 line expressed HER1 levels similar to those of MDA-MB-231, whereas the responsive MCF-10A cells did not express detectable HER1. Immunoblot analysis of HER2 expression also argues against a direct relationship between HER2 expression level and Src/PTPα dependence. Nonetheless, confounding factors may be responsible for these apparent exceptions (e.g., the very high level of HER1 in MDA-MB-468 cells may make potentiation by Src unnecessary and MDA-MB-435S may be an occult melanoma34). Thus, we do not exclude the possibility that disruption of HER, or other receptor, signaling in siRNA-sensitive cells contributes to the induction of apoptosis by Src/PTPα siRNAs.
Integrin-mediated pathways may also be involved: some experiments suggest that Src suppresses apoptosis in some cancer cell types via its role in integrin-mediated attachment and signaling, probably via Akt-mediated pathways.43 In particular, inhibiting Src increases the susceptibility of HT-29 colon cancer cells to anoikis,24 and this effect is synergistic with suppression of FAK, a component of the integrin-mediated attachment structure.44 Moreover, PTPα has been shown to modulate FAK phosphorylation, to colocalize with certain integrin-mediated cell–matrix connections and to modulate integrin signaling and function, presumably via its activation of Src family kinases.45,46 An alternative hypothesis is that Src and PTPα RNAi induce apoptosis via suppression of VEGF expression. In addition to its role in angiogenesis, VEGF appears to be an autocrine factor required for survival of MDA-MB-231 and MDA-MB-435 breast cancer cells47 and to require Src activity for its induction, at least under hypoxic conditions.48 It will be important to determine whether downstream signaling pathways, for instance Akt-dependent signaling, are selectively disrupted after Src/PTPα silencing in siRNA-sensitive versus insensitive cell lines.
Whatever the mechanism underlying Src or PTPα siRNA-mediated induction of apoptosis, our results suggest that both Src and PTPα may be useful therapeutic targets in specific cancer types. Src has long been considered as a potential target,25 but the potential for using PTPα as a synergistic or independent target using either siRNAs or appropriately designed small-molecule inhibitors is largely unexplored. PTPα may have a number of advantages relative to Src as a target: genetic knockout of PTPα in mice has few apparent deleterious effects27,28 suggesting that collateral effects of PTPα-inhibition in humans may be minimal. And, since it has an extracellular domain, it may be easier to target than Src with humanized antibodies. On the other hand, because the Src-directed activity of PTPα critically depends on phosphorylation-dependent noncatalytic interactions between Src and PTPα,30,35 it may be possible to use intracellular inhibitors to specifically target PTPα-mediated activation of Src while sparing most of its other activities.
Broader studies with clinical samples (i.e., primary cancer cells) will be needed to validate the cancer type specificities for Src and PTPα RNAi that we have observed. Knowing these specificities will be of great importance since, in contrast with their activity in ER− breast and colon cancer cells, Src and/or PTPα inhibition may have the opposite effect in other cancer cell types. For example, the growth of (ER+) MCF-7 cells can be suppressed by over-expression of PTPα16 and expression of activated Src can suppress taxane-induced apoptosis in other cell types.49 The sensitivity of ER− breast cancer cells to Src and PTPα RNAi is propitious since this class of breast cancer is the most refractory to current treatments.50
Acknowledgments
The authors are grateful to Dr. S.J. Taylor for expert editorial assistance, Dr. B. Pauli for providing the HB2 cell line and Dr. A. Elson for providing anti-PTPε antibody.
Grant sponsor: NIH; Grant number: CA32317.
References
- 1.Irby RB, Yeatman TJ. Role of Src expression and activation in human cancer. Oncogene. 2000;19:5636–42. doi: 10.1038/sj.onc.1203912. [DOI] [PubMed] [Google Scholar]
- 2.Ishizawar R, Parsons SJ. c-Src and cooperating partners in human cancer. Cancer Cell. 2004;6:209–14. doi: 10.1016/j.ccr.2004.09.001. [DOI] [PubMed] [Google Scholar]
- 3.Verbeek BS, Vroom TM, Adriaansen-Slot SS, Ottenhoff-Kalff AE, Geertzema JG, Hennipman A, Rijksen G. c-Src protein expression is increased in human breast cancer. An immunohistochemical and biochemical analysis. J Pathol. 1996;180:383–8. doi: 10.1002/(SICI)1096-9896(199612)180:4<383::AID-PATH686>3.0.CO;2-N. [DOI] [PubMed] [Google Scholar]
- 4.Muthuswamy SK, Siegel PM, Dankort DL, Webster MA, Muller WJ. Mammary tumors expressing the neu proto-oncogene possess elevated c-Src tyrosine kinase activity. Mol Cell Biol. 1994;14:735–43. doi: 10.1128/mcb.14.1.735. [DOI] [PMC free article] [PubMed] [Google Scholar]
- 5.Belsches-Jablonski AP, Biscardi JS, Peavy DR, Tice DA, Romney DA, Parsons SJ. Src family kinases and HER2 interactions in human breast cancer cell growth and survival. Oncogene. 2001;20:1465–75. doi: 10.1038/sj.onc.1204205. [DOI] [PubMed] [Google Scholar]
- 6.Luttrell DK, Lee A, Lansing TJ, Crosby RM, Jung KD, Willard D, Luther M, Rodriguez M, Berman J, Gilmer TM. Involvement of pp60c-src with two major signaling pathways in human breast cancer. Proc Natl Acad Sci USA. 1994;91:83–7. doi: 10.1073/pnas.91.1.83. [DOI] [PMC free article] [PubMed] [Google Scholar]
- 7.Mao W, Irby R, Coppola D, Fu L, Wloch M, Turner J, Yu H, Garcia R, Jove R, Yeatman TJ. Activation of c-Src by receptor tyrosine kinases in human colon cancer cells with high metastatic potential. Oncogene. 1997;15:3083–90. doi: 10.1038/sj.onc.1201496. [DOI] [PubMed] [Google Scholar]
- 8.Sainsbury JR, Farndon JR, Needham GK, Malcolm AJ, Harris AL. Epidermal-growth-factor receptor status as predictor of early recurrence of and death from breast cancer. Lancet. 1987;1:1398–402. doi: 10.1016/s0140-6736(87)90593-9. [DOI] [PubMed] [Google Scholar]
- 9.Koenders PG, Beex LV, Geurts-Moespot A, Heuvel JJ, Kienhuis CB, Benraad TJ. Epidermal growth factor receptor-negative tumors are predominantly confined to the subgroup of estradiol receptor-positive human primary breast cancers. Cancer Res. 1991;51:4544–8. [PubMed] [Google Scholar]
- 10.deFazio A, Chiew YE, Sini RL, Janes PW, Sutherland RL. Expression of c-erbB receptors, heregulin and oestrogen receptor in human breast cell lines. Int J Cancer. 2000;87:487–98. [PubMed] [Google Scholar]
- 11.Roskoski R., Jr Src protein-tyrosine kinase structure and regulation. Biochem Biophys Res Commun. 2004;324:1155–64. doi: 10.1016/j.bbrc.2004.09.171. [DOI] [PubMed] [Google Scholar]
- 12.Okada M, Nakagawa H. A protein tyrosine kinase involved in regulation of pp60c-src function. J Biol Chem. 1989;264:20886–93. [PubMed] [Google Scholar]
- 13.Zheng XM, Shalloway D. Two mechanisms activate PTPα during mitosis. EMBO J. 2001;20:6037–49. doi: 10.1093/emboj/20.21.6037. [DOI] [PMC free article] [PubMed] [Google Scholar]
- 14.Zheng XM, Wang Y, Pallen CJ. Cell transformation and activation of pp60c-src by overexpression of a protein tyrosine phosphatase. Nature. 1992;359:336–9. doi: 10.1038/359336a0. [DOI] [PubMed] [Google Scholar]
- 15.Bougeret C, Jiang S, Keydar I, Avraham H. Functional analysis of Csk and CHK kinases in breast cancer cells. J Biol Chem. 2001;276:33711–20. doi: 10.1074/jbc.M104209200. [DOI] [PubMed] [Google Scholar]
- 16.Ardini E, Agresti R, Tagliabue E, Greco M, Aiello P, Yang LT, Menard S, Sap J. Expression of protein tyrosine phosphatase α (RPTPα) in human breast cancer correlates with low tumor grade, and inhibits tumor cell growth in vitro and in vivo. Oncogene. 2000;19:4979–87. doi: 10.1038/sj.onc.1203869. [DOI] [PubMed] [Google Scholar]
- 17.Tabiti K, Smith DR, Goh HS, Pallen CJ. Increased mRNA expression of the receptor-like protein tyrosine phosphatase α in late stage colon carcinomas. Cancer Lett. 1995;93:239–48. doi: 10.1016/0304-3835(95)03816-f. [DOI] [PubMed] [Google Scholar]
- 18.Bjorge JD, Pang A, Fujita DJ. Identification of protein-tyrosine phosphatase 1B as the major tyrosine phosphatase activity capable of dephosphorylating and activating c-Src in several human breast cancer cell lines. J Biol Chem. 2000;275:41439–46. doi: 10.1074/jbc.M004852200. [DOI] [PubMed] [Google Scholar]
- 19.Brunton VG, Ozanne BW, Paraskeva C, Frame MC. A role for epidermal growth factor receptor, c-Src and focal adhesion kinase in an in vitro model for the progression of colon cancer. Oncogene. 1997;14:283–93. doi: 10.1038/sj.onc.1200827. [DOI] [PubMed] [Google Scholar]
- 20.Acosta JJ, Munoz RM, Gonzalez L, Subtil-Rodriguez A, Dominguez-Caceres MA, Garcia-Martinez JM, Calcabrini A, Lazaro-Trueba I, Martin-Perez J. Src mediates prolactin-dependent proliferation of T47D and MCF7 cells via the activation of focal adhesion kinase/Erk1/2 and phosphatidylinositol 3-kinase pathways. Mol Endocrinol. 2003;17:2268–82. doi: 10.1210/me.2002-0422. [DOI] [PubMed] [Google Scholar]
- 21.Moasser MM, Srethapakdi M, Sachar KS, Kraker AJ, Rosen N. Inhibition of Src kinases by a selective tyrosine kinase inhibitor causes mitotic arrest. Cancer Res. 1999;59:6145–52. [PubMed] [Google Scholar]
- 22.Laird AD, Li G, Moss KG, Blake RA, Broome MA, Cherrington JM, Mendel DB. Src family kinase activity is required for signal tranducer and activator of transcription 3 and focal adhesion kinase phosphorylation and vascular endothelial growth factor signaling In Vivo and for anchorage-dependent and -independent growth of human tumor cells. Mol Cancer Ther. 2003;2:461–9. [PubMed] [Google Scholar]
- 23.Kraker AJ, Hartl BG, Amar AM, Barvian MR, Showalter HD, Moore CW. Biochemical and cellular effects of c-Src kinase-selective pyrido[2,3-d]pyrimidine tyrosine kinase inhibitors. Biochem Pharmacol. 2000;60:885–98. doi: 10.1016/s0006-2952(00)00405-6. [DOI] [PubMed] [Google Scholar]
- 24.Windham TC, Parikh NU, Siwak DR, Summy JM, McConkey DJ, Kraker AJ, Gallick GE. Src activation regulates anoikis in human colon tumor cell lines. Oncogene. 2002;21:7797–807. doi: 10.1038/sj.onc.1205989. [DOI] [PubMed] [Google Scholar]
- 25.Yeatman TJ. A renaissance for SRC. Nat Rev Cancer. 2004;4:470–80. doi: 10.1038/nrc1366. [DOI] [PubMed] [Google Scholar]
- 26.Bain J, McLauchlan H, Elliott M, Cohen P. The specificities of protein kinase inhibitors: an update. Biochem J. 2003;371:199–204. doi: 10.1042/BJ20021535. [DOI] [PMC free article] [PubMed] [Google Scholar]
- 27.Ponniah S, Wang DZ, Lim KL, Pallen CJ. Targeted disruption of the tyrosine phosphatase PTPα leads to constitutive downregulation of the kinases Src and Fyn. Curr Biol. 1999;9:535–8. doi: 10.1016/s0960-9822(99)80238-3. [DOI] [PubMed] [Google Scholar]
- 28.Su J, Muranjan M, Sap J. Receptor protein tyrosine phosphatase α activates Src-family kinases and controls integrin-mediated responses in fibroblasts. Curr Biol. 1999;9:505–11. doi: 10.1016/s0960-9822(99)80234-6. [DOI] [PubMed] [Google Scholar]
- 29.Bartek J, Bartkova J, Kyprianou N, Lalani EN, Staskova Z, Shearer M, Chang S, Taylor-Papadimitriou J. Efficient immortalization of luminal epithelial cells from human mammary gland by introduction of simian virus 40 large tumor antigen with a recombinant retrovirus. Proc Natl Acad Sci USA. 1991;88:3520–4. doi: 10.1073/pnas.88.9.3520. [DOI] [PMC free article] [PubMed] [Google Scholar]
- 30.Zheng XM, Resnick RJ, Shalloway D. A phosphotyrosine displacement mechanism for activation of Src by PTPα. EMBO J. 2000;19:964–78. doi: 10.1093/emboj/19.5.964. [DOI] [PMC free article] [PubMed] [Google Scholar]
- 31.Lipsich LA, Lewis AJ, Brugge JS. Isolation of monoclonal antibodies that recognize the transforming proteins of avian sarcoma viruses. J Virol. 1983;48:352–60. doi: 10.1128/jvi.48.2.352-360.1983. [DOI] [PMC free article] [PubMed] [Google Scholar]
- 32.Elbashir SM, Harborth J, Lendeckel W, Yalcin A, Weber K, Tuschl T. Duplexes of 21-nucleotide RNAs mediate RNA interference in cultured mammalian cells. Nature. 2001;411:494–8. doi: 10.1038/35078107. [DOI] [PubMed] [Google Scholar]
- 33.Snedecor GW, Cochran WG. Statistical methods. 8th. Ames, Iowa: Iowa State University Press; 1989. pp. 174–6. [Google Scholar]
- 34.Ross DT, Scherf U, Eisen MB, Perou CM, Rees C, Spellman P, Iyer V, Jeffrey SS, Van de Rijn M, Waltham M, Pergamenschikov A, Lee JC, et al. Systematic variation in gene expression patterns in human cancer cell lines. Nat Genet. 2000;24:227–35. doi: 10.1038/73432. [DOI] [PubMed] [Google Scholar]
- 35.Zheng XM, Resnick RJ, Shalloway D. Mitotic activation of protein-tyrosine phosphatase α and regulation of its Src-mediated transforming activity by its sites of protein kinase C phosphorylation. J Biol Chem. 2002;277:21922–9. doi: 10.1074/jbc.M201394200. [DOI] [PMC free article] [PubMed] [Google Scholar]
- 36.Burkle A. Poly(ADP-ribose). The most elaborate metabolite of NAD+ FEBS J. 2005;272:4576–89. doi: 10.1111/j.1742-4658.2005.04864.x. [DOI] [PubMed] [Google Scholar]
- 37.Gonzalez L, Agullo-Ortuno MT, Garcia-Martinez JM, Calcabrini A, Gamallo C, Palacios J, Aranda A, Martin-Perez J. Role of c-Src in human MCF7 breast cancer cell tumorigenesis. J Biol Chem. 2006;281:20851–64. doi: 10.1074/jbc.M601570200. [DOI] [PubMed] [Google Scholar]
- 38.Kovach JS, Svingen PA, Schaid DJ. Levamisole potentiation of fluorouracil antiproliferative activity mimicked by orthovanadate, an inhibitor of tyrosine phosphatase. J Natl Cancer Inst. 1992;84:515–19. doi: 10.1093/jnci/84.7.515. [DOI] [PubMed] [Google Scholar]
- 39.Burch WM, Hamner G, Wuthier RE. Phosphotyrosine and phospho-protein phosphatase activity of alkaline phosphatase in mineralizing cartilage. Metabolism. 1985;34:169–75. doi: 10.1016/0026-0495(85)90128-3. [DOI] [PubMed] [Google Scholar]
- 40.Gil-Henn H, Elson A. Tyrosine phosphatase-epsilon activates Src and supports the transformed phenotype of Neu-induced mammary tumor cells. J Biol Chem. 2003;278:15579–86. doi: 10.1074/jbc.M210273200. [DOI] [PubMed] [Google Scholar]
- 41.Wong CW, McNally C, Nickbarg E, Komm BS, Cheskis BJ. Estrogen receptor-interacting protein that modulates its nongenomic activity-crosstalk with Src/Erk phosphorylation cascade. Proc Natl Acad Sci USA. 2002;99:14783–8. doi: 10.1073/pnas.192569699. [DOI] [PMC free article] [PubMed] [Google Scholar] [Retracted]
- 42.Biscardi JS, Belsches AP, Parsons SJ. Characterization of human epidermal growth factor receptor and c-Src interactions in human breast tumor cells. Mol Carcinog. 1998;21:261–72. doi: 10.1002/(sici)1098-2744(199804)21:4<261::aid-mc5>3.0.co;2-n. [DOI] [PubMed] [Google Scholar]
- 43.Playford MP, Schaller MD. The interplay between Src and integrins in normal and tumor biology. Oncogene. 2004;23:7928–46. doi: 10.1038/sj.onc.1208080. [DOI] [PubMed] [Google Scholar]
- 44.Golubovskaya VM, Gross S, Kaur AS, Wilson RI, Xu LH, Yang XH, Cance WG. Simultaneous inhibition of focal adhesion kinase and SRC enhances detachment and apoptosis in colon cancer cell lines. Mol Cancer Res. 2003;1:755–64. [PubMed] [Google Scholar]
- 45.von Wichert G, Jiang G, Kostic A, De Vos K, Sap J, Sheetz MP. RPTPα acts as a transducer of mechanical force on αv/β3-integrin-cytoskeleton linkages. J Cell Biol. 2003;161:143–53. doi: 10.1083/jcb.200211061. [DOI] [PMC free article] [PubMed] [Google Scholar]
- 46.Zeng L, Si X, Yu WP, Le HT, Ng KP, Teng RM, Ryan K, Wang DZ, Ponniah S, Pallen CJ. PTPα regulates integrin-stimulated FAK auto-phosphorylation and cytoskeletal rearrangement in cell spreading and migration. J Cell Biol. 2003;160:137–46. doi: 10.1083/jcb.200206049. [DOI] [PMC free article] [PubMed] [Google Scholar]
- 47.Bachelder RE, Crago A, Chung J, Wendt MA, Shaw LM, Robinson G, Mercurio AM. Vascular endothelial growth factor is an autocrine survival factor for neuropilin-expressing breast carcinoma cells. Cancer Res. 2001;61:5736–40. [PubMed] [Google Scholar]
- 48.Mukhopadhyay D, Tsiokas L, Zhou XM, Foster D, Brugge JS, Sukhatme VP. Hypoxic induction of human vascular endothelial growth factor expression through c-Src activation. Nature. 1995;375:577–81. doi: 10.1038/375577a0. [DOI] [PubMed] [Google Scholar]
- 49.Boudny V, Nakano S. Src tyrosine kinase but not activated Ras augments sensitivity to taxanes through apoptosis in human adenocarcinoma cells. Anticancer Res. 2003;23:7–12. [PubMed] [Google Scholar]
- 50.Clark G. Prognostic and predictive factors. In: Harris J, Lippman M, Morrow M, editors. Osborne C Diseases of the breast. 2nd. Philadelphia: Lippincott, Williams and Wilkins; 2000. pp. 489–514. [Google Scholar]