

Abstract
Triple negative breast cancer (TNBC) is a subtype with heterogeneous patient outcomes. Approximately forty percent of patients experience rapid relapse, while the remaining patients have long-term disease-free survival. To determine if there are molecular differences between primary tumors that predict prognosis we performed RNA-seq on 47 macro-dissected tumors from newly diagnosed patients with TNBC (n = 47; 22 relapse, 25 no relapse; follow-up median 8 years, range 2–11 years). We discovered that expression of the MHC class II (MHC II) antigen presentation pathway in tumor tissue was the most significant pathway associated with progression-free survival (hazard ratio (HR) = 0.36, log-rank P = 0.0098). The association between MHC II pathway expression and good prognosis was confirmed in a public gene expression database of 199 TNBC cases (HR = 0.28, log-rank P = 4.5 × 10⁻⁸). Further analysis of immunohistochemistry, laser-capture micro-dissected tumors, and TNBC cell lines demonstrated that tumor cells, in addition to immune cells, aberrantly express the MHC II pathway. MHC II pathway expression was also associated with B cell and T cell infiltration in the tumor. Together these data support the model that aberrant expression of the MHC II pathway in TNBC tumor cells may trigger an antitumor immune response that reduces the rate of relapse and enhances progression-free survival.
Keywords: Breast cancer, Gene expression profiling, Molecular diagnosis and prognosis, Tumor Immunobiology
Introduction
Triple negative breast cancer (TNBC) describes a clinical subtype of invasive breast cancer tumors that lack expression of estrogen receptor (ER−), progesterone receptor (PR−), or overexpression of HER2. They represent a breast cancer entity in which tumors behave aggressively and are not candidates for ER or HER2/Neu targeted therapy. Most patients are treated with surgery and receive adjuvant or neoadjuvant chemotherapy with or without local radiation treatment. Patient outcome is heterogeneous with 42% of patients having rapid relapses with a peak at three years from diagnosis while relapse rate is low from years 5–10 (1). TNBC tumor types vary in their genomic makeup with the majority categorized as basal-like (BL) subtype. In general, BL and non-BL subtypes share similar aggressive biology (2).
Over the last 15 years, a major research effort has been directed at using genomic techniques to analyze the biology of breast cancer and to establish genomic signatures to assess prognosis (3). These data have been primarily prognostic gene expression signatures derived from microarray genomic platforms (Affymetrix, Illumina, etc.) with more recent studies using RNA-sequence (seq) technology (4). This has been most notably successful in ER+ breast cancer. Some of these genomic assays have received FDA approval and are used widely to assist therapy decision making in ER+ disease (5). Prognostic gene expression signatures are not as well developed for TNBC and are not used in clinical practice. Several large multigene signatures have performed well in multivariate analysis, which indicates that gene expression differences between tumors are associated with different clinical outcomes (6–9).
The presence of tumor-infiltrating lymphocytes (TILs) can be detected by morphology, immunohistology, and genomic methodologies. The presence of TILs in TNBC has been associated with good prognosis in several studies (9–12). The conclusions from many of these TIL studies are that the patient’s immune response has a positive effect on progression-free survival (PFS), therapy response, and overall survival, especially in TNBC (13, 14). It is unclear what differences between TNBC tumors leads to differences in lymphocyte infiltration.
In this study we utilized RNA-seq technology to examine gene expression in TNBC, which has multiple advantages over microarray genomic platforms (15, 16). We designed this study to determine which genes had significantly different expression between patients who relapsed compared to those who did not experience relapse during a follow-up period (median 8 years, range 2–11 years). Whole transcriptome analysis of macro-dissected tumor tissue revealed that expression of the MHC class II antigen presentation pathway (MHC II) in TNBC tumors was the most significant pathway associated with good clinical outcomes in our dataset. We confirmed the association between MHC II pathway expression and good prognosis in a public gene expression database. We performed further analysis of tumor immunohistochemistry, laser capture micro-dissected tumors, and TNBC cell lines to demonstrate that tumor cells, in addition to immune cells, aberrantly express the MHC II pathway. We found that expression of the MHC II pathway is correlated with the presence of a TIL gene expression signature in the same tumors. This study provides a means to assess prognosis in TNBC and may also provide a coherent mechanism for the generation of endogenous antitumor immunity in patients with good clinical outcomes.
Materials Methods
Patient Material
The Tumor Procurement Shared Facility of the UAB Comprehensive Cancer Center has an IRB-approved protocol for collection of tumor and normal tissue samples for research purposes using de-identified clinical data and laboratory analysis. TNBC breast cancer tissues (n = 47) were selected for analysis on the basis that the tumors were ER and PR negative, HER2/Neu not over-expressed, snap frozen tissue available, adequate patient follow-up (> 24 months), and the patient had received no anticancer therapy prior to tissue collection.
Tissue Processing
The frozen tumor tissue underwent macro-dissection by a board certified pathologist (WEG) (see Supplementary Data). This process included taking serial frozen sections, staining them with H&E, and estimating tumor cell content. Areas of the specimen that contained uninvolved breast and/or leukocytic infiltration were removed to enrich for the malignant cells in the specimen. The de-identified tumor specimens had >50% tumor nuclei and were shipped on dry ice to HudsonAlpha Institute for Biotechnology (Huntsville, AL). More details are provided in the Supplementary Methods.
RNA-seq
The 47 tumor specimens were weighed and underwent RNA extraction (see Supplementary Data). RNA-seq libraries were constructed (17), and were quantified using the Qubit dsDNA High Sensitivity Assay Kit and the Qubit 2.0 fluorometer (Invitrogen). Three barcoded libraries were pooled in equimolar quantities per sequencing lane on an Illumina HiSeq 2000 sequencing machine. They were sequenced using paired-end 50 bp reads and a 6 bp index read to a depth of at least 50 million read pairs per library. The RNA-seq data are publicly available through GEO Accession GSE58135 (http://www.ncbi.nlm.nih.gov/geo/query/acc.cgi?acc=GSE58135).
RNA-seq Data Analysis
Gene expression values (fragments per kilobase of transcript per million, FPKMs) were calculated using TopHat v 1.4.1 (18), GENCODE version 9 (19), BEDtools (20), and Cufflinks 1.3.0 with −u option (21)(see Supplementary Data). We performed unsupervised clustering on normalized gene read counts to identify subclusters of samples within our dataset using the ConsensusClusterPlus R package (22). TNBC subtype of each sample was determined using TNBCType (23). The SAMseq function was used to peform supervised analysis to identify genes differentially expressed between tumors from patients who did or did not relapse with q values of < 5% (24). Kaplan-Meier curves and survival analysis were performed using RNA-seq FPKM values and an R script (25). The Supplementary Data contains more details of these bioinformatics analyses.
Public microarray data analysis
Kaplan-Meier and survival analysis was performed on public microarray data using the Kaplan-Meier Plotter tool (http://kmplot.com) (26). Patients were censored at the follow-up threshold (8–10 years). Only JetSet best probe sets were used for each gene in the microarray data analysis (27). Analysis was restricted to the 199 patients whose tumors were ER−, PR−, and were classified as basal intrinsic breast cancer subtype (25). Basal TNBC tumors were identified based on the St. Gallen criteria (28) using the procedure described by the authors of the Kaplan-Meier Plotter tool (29).
Tumor versus Stroma Gene Expression
Five archived de-identified TNBC tumor specimens underwent standard immunohistochemical analysis with anti-CD74 (Leika/Novocastra) and anti HLA-DPB1 (Sigma-Aldrich). An anatomic pathologist estimated the fraction of antibody positive tumor cells and the localization of the staining (see Supplementary Data). To examine gene expression by epithelial tumor cells versus stroma, we utilized a public laser capture micro-dissection dataset (GEO-GSE5847) (30). The raw dataset (.cel and matrix files) was uploaded to Partek Genomic Suite (PGS, St. Louis, MO) for data background subtraction, quality control, and RMA-normalization. Of the 31 patients in this database, we selected the 14 patients that had invasive TNBC to measure the gene expression in their epithelial tumor cells.
Cell Line Interferon Gamma Treatment and RNA-seq
The TNBC cell lines MDA-MB-468 (ATCC HTB-132) and MDA-MB-436 (ATCC HTB-130) were purchased from ATCC and RNA-seq was performed 3 months after purchase (21 passages). Due to the short interval between the purchase and the RNA-seq experiment no additional authentication was performed. MD-MB-468 was cultured in DMEM, 10% FBS, 1 mM sodium pyruvate, and 1x non-essential amino acids. MDA-MB-436 was cultured in DMEM, 10% FBS, 10 μg/mL insulin, and 16 μg/mL glutathione. Cells were treated with 10U/mL Recombinant Human Interferon-γ (Thermo Fisher product # PHC4031) in duplicate for 24 hours. Cells were lysed with 350uL RLT (Qiagen) plus 1% BME, RNA was extracted from the lysate using the Norgen Animal Tissue RNA Purification Kit, and RNA-seq libraries were constructed using the KAPA Stranded mRNA-seq Kit. Libraries were sequenced on the illumina HiSeq 2500 with 10 samples per lane. Data was aligned to the UCSC hg19 transcriptome using HISAT(31). HTSEQ was used to calculate gene counts(32). DESEQ2(33) was used to calculate fold changes between 2 replicates of Interferon-γ treated cells and the 2 replicates of untreated cells for both cell lines.
Statistical analysis
Descriptive analysis was provided for patients’ characteristics including student t test and chi-square statistics. The individual MHC II gene expression values were transformed to best fit a normal distribution using log 2 base (34, 35). High or low expression levels of individual genes were assessed around median value, tertiles, or quartiles. PFS is defined as the time from diagnosis to the first documented disease progression or death due to any cause, whichever occurs first. Subjects without relapse were considered censored. The Kaplan-Meier method and log-rank test was used to assess the expression difference. The hazard ratio and its 95% confidence interval from the Cox model (36) with Efron’s method were reported. Pearson correlation coefficient was estimated to examine the correlation among individual genes. The association between MHC II gene expression and good prognosis was independently significant in multivariate analysis by Cox regression analysis using the variables of age, race, stage, tumor size, node status, adjunct therapy, and breast cancer subtype. In addition, high levels of MHC II gene expression correlated with hazard ratio for relapse even when controlling for the effects of stage (which includes the variables of tumor size and node status).
Results
Patients
A case series of 47 women with TNBC were selected for this study with a median follow up time of 8 years (range 2–11 years) (Table 1). As expected, the 22 patients who had disease relapse had significantly higher stage (P = 0.0295), tumor size (P = 0.0029), and node involvement (P = 0.0394) compared to patients that did not experience disease relapse. Both groups received similar adjuvant therapy. Anthracycline combinations were used in the majority of patients. Five relapse and two non-relapse patients received no adjuvant treatment. Similar numbers of patients had conservative surgical management and radiotherapy. Median time to relapse was 18.5 months (8 to 97 months), and the follow-up of non-relapse patients had a median of 96 months (25 to 137 months). Racial makeup of the two groups was similar, and overall 81% of the tumors were basal-like using the St. Gallen criteria (28) and similar in both groups. This case series generally represents the diverse presentation and outcomes that are seen in TNBC patients in clinical practice.
Table 1.
Patient Demographics
| No Relapse (25) | Relapse (22) | Significance | |
|---|---|---|---|
|
| |||
| Age (Years) (median) | 54 (37–67) | 53 (22–76) | NS |
|
| |||
| Stage | 0.0295 | ||
| I | 8 (32%) | 2 (9%) | |
| II | 15 (60%) | 12 (55%) | |
| III | 2 (8%) | 8 (36%) | |
|
| |||
| Tumor Size | 0.0029 | ||
| T1 | 11 (44%) | 3 (14%) | |
| T2 | 12 (48%) | 10 (45%) | |
| T3 | 1 (4%) | 3 (14%) | |
| T4 | 1 (4%) | 5 (23%) | |
| TX | 0 | 1 (4%) | |
|
| |||
| Nodes | 0.0394 | ||
| Yes | 10 (40%) (N1:4, N2:2, N3:4) | 16 (73%) (N1:11, N2:3, N3:2) | |
| No | 15 (60%) | 6 (27%) | |
|
| |||
| Grade | NS | ||
| 2 | 5 (20%) | 5 (23%) | |
| 3 | 20 (80%) | 17 (77%) | |
|
| |||
| Adjuvant Chemotherapy | NS | ||
| Anthracycline Based Chemotherapy | 19 (76%) | 13 (59%) | |
| Other Chemotherapy | 4 (16%) (2 CBP based) | 4 (18%) (1 CBP based) | |
| No Adjuvant Chemotherapy | 2 (8%) | 5 (23%) | |
|
| |||
| Surgery | NS | ||
| Conservative | 13 (52%) | 7 (32%) | |
| Mastectomy | 12 (48%) | 15 (68%) | |
|
| |||
| Radiotherapy | NS | ||
| Yes | 13 (52%) | 11 (50%) | |
| No | 12 (48%) | 11 (50%) | |
|
| |||
| Time to Relapse (Months) (Median) | N/A | 18.5 months (8 to 97) | |
|
| |||
| Disease Free Survival (Months) (Median) | 96 months (25 to 137) | N/A | |
|
| |||
| Race | NS | ||
| White | 14 (56%) | 15 (68%) | |
| African American | 10 (40%) | 6 (28%) | |
| Unknown | 1 (4%) | 1 (4%) | |
|
| |||
| Breast Cancer Subtype | NS | ||
| Basal Like | 19 (76%) | 19 (86%) | |
| Others | 6 (24%) | 3 (14%) | |
Unsupervised Consensus Clustering Analysis
RNA-seq was performed on macro-dissected flash frozen tumor specimens that were surgically resected from the women in this study before they began chemotherapy or radiation. To determine if there were molecular differences between patient’s tumors that are associated with clinical outcomes we first performed unsupervised consensus clustering analysis on whole-transcriptome data. The analysis identified three main clusters (1, 2, and 3) composed of 20, 17, and 10 patient tumors respectively (Fig. 1A). The cluster analysis did not simply reflect previously defined seven TNBC subtypes (23, 37); each cluster we identified contained multiple TNBC subtypes and the TNBC subtypes were represented in multiple clusters (Supplementary Fig. S1). Figures 1B and 1C provide the PFS for the three cluster groups. Cluster 2 had improved PFS for the groups as a whole (P = 0.023) and when subdivided based on lymph node involvement (P = 0.013). Patient tumors in Cluster 2 have higher expression of immunomodulatory genes than tumors in the other clusters (Supplementary Table 1). The rate of relapse in cluster 2 (3/17; 18%) is significantly lower than in Clusters 1 (12/20; 60%) and Cluster 3 (7/10; 70%); P =.0067. This analysis is consistent with previous reports that a subset of tumors have increased expression of many different immune-related pathways, which is associated with better clinical outcomes (14, 37, 38).
Figure 1.

Consensus clustering of gene expression values across all genes identified 3 main groups of TNBC tumors. (A) The heatmap shows the relative similarity of gene expression values in each sample compared to all other samples (darker blue indicates higher similarity). The dendogram at the top of the heatmap shows the pairwise similarity between samples and their assignment into three consensus clusters (Cluster 1 is a black bar, Cluster 2 is red, and Cluster 3 is green). (B) Kaplan-Meier PFS curves for patients in Clusters 1–3. Cluster 1 (C-1, black line), 2 (C-2, red line) and 3 (C-3, green line); log-rank P = 0.023. (C) Same as B except patients with lymph node tumor involvement (+) are dashed lines and lymph node negative (−) are solid lines; log-rank P = 0.013.
Gene Expression Analysis
We next performed an analysis to determine which genes in the transcriptome had the most significant expression differences between tumors from patients who relapsed compared to tumors from patients who did not relapse. Table 2 provides the list of 24 genes identified with a false discovery rate (FDR) of 5% (q-value < 0.05). A heatmap of the 24 genes (Supplementary Fig. S2) illustrated that each of the 24 genes exhibited higher average expression across the tumors from patients who did not relapse. Eleven of these genes are major components of the MHC II antigen presentation pathway including CIITA, CD74, HLA-DPA1, HLA-DPB1, HLA-DPB2, HLA-DQA1, HLA-DRB1, HLA-DRB5, HLA-DRB6, CTSH, NCOA1 (Supplementary Fig. S3, Table 2). The expression of these MHC II pathway genes is highly correlated across patient samples (P < 0.0001), which suggests that they undergo coordinated expression regulation in these tumors (Supplementary Table S2). To our knowledge this is the first time that the coordinated expression of the MHC II pathway genes has been reported as the most significant independent predictor of good prognosis in TNBC.
Table 2.
Genes with Significantly Higher Expression in No Relapse Patients
|
The 11 MHC class II genes that we identified as significantly associated with good prognosis include each step in the MHC II antigen presentation process from the master transcriptional transactivator, CIITA, to the antigen presenting complex components, HLA-DP, DQ, and DR. HLA-DM is another crucial pathway member that allows HLA binding of peptides prior to display on the antigen presenting cell surface. While the HLA-DMA and HLA-DMB genes did not reach the strict statistical threshold for genome-wide significance that the other 11 genes attained, they were highly correlated with CD74 and other significant genes in the pathway (r = 0.84 and 0.89 respectively (P < 0.001 for both)). This suggests that HLA-DM is also coordinately regulated with other MHC II pathway members in TNBC tumors.
To further characterize the relationship between the 13 gene MHC II pathway signature and prognosis we determined the statistical association between gene expression and PFS. The average expression value of the 13 MHC II genes in our 47 patients was used to generate Kaplan Meier curves which demonstrated a significant association between MHC II pathway expression and PFS (Fig. 2A, log-rank P = 0.0098, HR of 0.36).
Figure 2.

Kaplan-Meier PFS curves of patients with high or low MHC II gene expression. (A) The patients with high expression of the MHC II genes is depicted in red while those in the lowest quartile of expression are depicted in black; HR = 0.36 (0.16–0.81); log-rank P = 0.0098. (B) The high expression (above the median) of CIITA is depicted in red and low expression (below the median) is depicted in black; log-rank P = 0.0002. (C) The high expression (above the median) of CD74 is depicted in red and low expression (below the median) is depicted in black; log-rank P = 0.0164.
Given the strong correlation among overexpressed MHC II pathway genes, we examined the association between PFS and expression on a single gene basis. A summary of HR values for ten of the MHC II differentially expressed genes is provided in Supplementary Table S2. High expression of CIITA or CD74 alone was independently significantly associated with PFS (CIITA log-rank P = 0.0002, HR = 0.167, Fig. 2B) (CD74 log-rank P = 0.0164, HR = 0.349, Fig. 2C). When CIITA gene expression is classified as either above or below the median it is an independent predictor for PFS (P = 0.008) by multivariable Cox regression analysis. When controlling for tumor stage, the HR for high versus low CIITA is 0.147 (CI 0.048 – 0.450). Similarly, CD74 is an independent predictor for PFS (P = 0.0322) with a HR of 0.362 (0.143 – 0.917) after adjusting for tumor stage. When gene expression values are divided into tertiles (high, intermediate, and low values) the samples with the highest CIITA only had 2/16 relapses including one with relapse at > 90 months. The lowest third expression values for CD74 were associated with 12/16 relapses, all of which occur within 25 months (Supplementary Fig. S4A and B). Together these statistical analyses demonstrate that expression of the MHC II pathway genes is strongly associated with PFS.
Confirmation that MHC II Expression Associates with a Good Prognosis
To determine if the association between MHC II expression and prognosis was specific to our patient case series or RNA-seq methods we sought to confirm this result in another dataset. We examined a large meta-analysis of Affymetrix microarray data that was assembled to encompass gene expression profiles from all available breast cancer studies that had adequate clinical follow-up (25). This database conglomerates the gene expression data and clinical follow-up from samples that were collected for many different studies. We analyzed 199 patients in this meta-analysis data set with ER−, PR−, basal intrinsic subtype tumors and examined the expression levels of our 13 MHC II genes. One of the MHC II genes was not represented in this database (HLA-DPB2). The average expression value of the remaining 12 MHC II gene expression levels had a striking association with PFS with a log-rank of P = 4.5 × 10⁻⁸ and a HR of 0.28 (0.17–0.45) as depicted in Figure 3A. Similar to the results in our patient data, individual MHC II gene expression were significantly correlated with PFS (prognosis) as depicted for CD74 in Figure 3B (log-rank P = 1.9 × 10⁻⁶; HR = 0.31 (0.18–0.51). Despite the differences in gene expression measurement technology and the multiple institutions and studies included in the public meta-dataset, MHC II expression was confirmed to be strongly associated with TNBC prognosis.
Figure 3.

Kaplan-Meier PFS curves of patients in the public microarray data set. (A) High mean expression of the MHC II genes (red) versus the lowest tertile expression (black); HR = 0.28 (0.17–0.45); log-rank P = 4.5 × 10⁻⁸. (B) High expression of CD74 (red) versus the lowest tertile expression (black); HR = 0.31 (0.18–0.51); log-rank P = 1.9 × 10⁻⁶.
Tumor Cell Expression of MHC II Genes
Classically, MHC II antigen processing and presentation are attributed to dendritic cells, B cells, and macrophages which are found in tumor stroma, lymph nodes, and spleen. To determine whether the prognostic MHC II gene expression signature was derived from tumor cells or surrounding cells in the tumor sample, we performed immunohistochemistry on five randomly selected TNBC specimens. We assessed staining for CD74 and HLA-DPB1 in the malignant epithelium, recording the percentage of tumor cells stained, pattern of staining (cytoplasmic, membranous or both) and scored the staining intensity as weak, moderate or strong with respect to background lymphocytes which served as an internal control. We found that all five TNBC tumor specimens had CD74 protein expression in tumor cells. This staining was cytoplasmic, membranous or both, with 5%–90% of tumor cells showing immunoreactivity that was weak to moderate in intensity (Fig. 4A). HLA-DPB1 protein expression was noted in 2 of 5 TNBC tumors, with weak to moderate cytoplasmic and membranous staining in 20% and 40% of tumor cells, respectively (Fig. 4B). These results are consistent with previous observations that MHC II proteins can be detected in TNBC tumor cells (39–43).
Figure 4.

Immunohistochemistry detection of CD74 and HLA-DPB1 protein expression in TNBC tumor tissue. (A) IHC detection of CD74 protein in TNBC tumor tissue shows staining in 20% of invasive tumor cells. Localization is primarily membranous (90%) with some granular cytoplasmic staining (large image is 10x magnification, inset is 20x magnification). (B) IHC detection of HLA-DPB1 protein in TNBC tumor tissue shows staining in 20% of invasive tumor cells. Localization is primarily membranous (90%) with some granular cytoplasmic staining (large image is 10x magnification, inset is 20x magnification).
In addition, we examined the expression of MHC II genes in laser capture micro-dissected breast tumor tissues using a publicly available Affymetrix microarray dataset ((30), GSE5847). In 14 patients with TNBC, the range of values in the tumor cells for HLA-DPA1 was 6.70 – 11.48 RMA units and for HLA-DRB1 was 11.35 – 13.12 RMA units. T test and paired T analysis were not significant between stroma and epithelial expression of MHC II genes. These analyses further support the conclusion that TNBC epithelial tumor cells can express MHC II genes.
In professional antigen presenting cells (APCs) interferon gamma (IFNG) is the signal that induces CIITA to transcriptionally activate the MHC II antigen presentation pathway. We analyzed breast cancer cell line RNA-seq data from a previous study (44) and identified two TNBC cell lines that had little or no expression (FPKM < 0.5) of the prognostic MHC II pathway genes in standard media conditions. We then treated these cell lines with IFNG and performed RNA-seq. We found that the majority of the 13 prognostic MHC II pathway genes were highly expressed after IFNG induction in both TNBC cell lines (Fig. 5). This result confirms previous reports(41, 45, 46) that TNBC tumor cells can express components of the MHC class II antigen presentation pathway and demonstrates that induction of this pathway can occur through the same signaling pathway that activates APCs.
Figure 5.
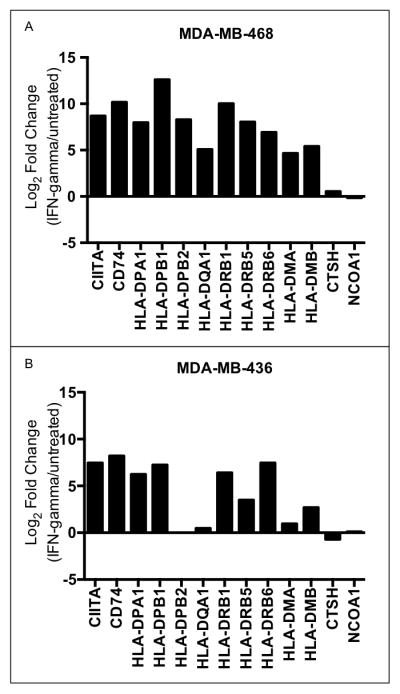
Interferon-γ treatment of TNBC cell lines induces the expression of good prognosis MHC II pathway genes. Log 2 fold changes in expression of MHC II genes between IFNγ-treated cells and untreated cells are shown for two TNBC cell lines: (A) MDA-MB-468 and (B) MDA-MB-436.
Tumor MHC II Gene Expression Correlation with Infiltrating Lymphocytes
The strong association between tumor cell MHC II pathway expression and PFS suggests that antitumor immunity is involved in conferring the good prognosis. To test if an antitumor immune response was associated with the MHC II positive tumors, we assessed the correlation of representative MHC II genes with the B- and T-cell gene signatures used by West, et al, (12) to identify TILs. As can be seen in our dataset (Table 3A) and the public database (Table 3B), there is a substantial correlation of MHC II gene expression with B-cell and T-cell genes in both datasets. In general, the MHC II gene correlations were higher with the T-cell genes than the B-cell genes (CD19 and CD20). This observation is consistent with MHC II antigen presentation inducing activation of T cells.
Table 3.
Correlation Coefficients* of MHC II and TILs
| A. UAB Patients (n = 47) | ||||||||
|---|---|---|---|---|---|---|---|---|
| LCK | CD48 | GZMB | CD3D | PRF1 | SELL | CD19 | CD20 | |
| CD74 | 0.82 | 0.80 | 0.64 | 0.65 | 0.67 | 0.64 | 0.46 | 0.41 |
| HLA-DM | 0.76 | 0.73 | 0.73 | 0.64 | 0.57 | 0.54 | 0.40 | 0.39 |
| B. Public Database (n = 199) | ||||||||
| LCK | CD48 | GZMB | CD3D | PRF1 | SELL | CD19 | CD20 | |
| CD74 | 0.76 | 0.58 | 0.63 | 0.69 | 0.70 | 0.69 | 0.56 | 0.57 |
| HLA-DM | 0.72 | 0.73 | 0.67 | 0.78 | 0.70 | 0.63 | 0.59 | 0.59 |
All P < 0.001
Discussion
We demonstrated that coordinated expression of the MHC class II antigen presentation pathway occurs in a subset of TNBC patients’ tumors and is associated with tumor infiltrating leukocytes and long-term progression-free survival. Previous studies have reported individual components of these result including the correlation between TILs and good prognosis (10–12, 14), the presence of an immunomodulatory gene expression signature in TNBC (7, 9, 37), and expression of various individual HLA proteins in tumor cells (39, 40, 42, 43, 46). However, this time we have linked these observations through a specific coherent model that suggests a mechanism for why a subset of TNBC patients have long term progression free survival. Based upon the data collected in this study we propose that a subset of TNBC patients have aberrant expression of the MHC II pathway in their tumor cells that results in the presentation of tumor specific neo-antigens to CD4+ T cells, which become activated and induce the recruitment of other TILs. This TIL invasion may reflect the induction of an antitumor immune response that reduces the rate of relapse in patients after treatment of their primary tumor. This model suggests that endogenous antitumor immunity plays an important role in TNBC prognosis.
Although we associated this mode of endogenous antitumor immunity with prognosis in TNBC patients, the principle behind this concept had already been demonstrated in animal models. Elegant studies have demonstrated that ectopic expression of the MHC II pathway in tumors cells from mouse models of breast cancer can induce Th1-mediated antitumor immunity and antitumor memory in the syngeneic host mouse (47–50).
Our results indicate that a biomarker test that measures MHC class II expression could be a powerful way to predict risk of relapse in TNBC patients. Further studies are warranted to overcome the limitations of our approach and develop a clinical-scale assay to specifically measure expression of the MHC II pathway signature genes in clinical specimens. A qPCR assay or a Nanostring assay that is compatible with the fragmented RNA derived from FFPE clinical specimens could be a promising approach to determine if this discovery has clinical utility as a prognostic biomarker in a larger case series of TNBC patients. We are also excited by the possibility that therapies that induce MHC class II expression in tumor cells may be a particularly valuable strategy for converting MHC II–negative poor prognosis TNBC tumors into MHC-positive tumors that present tumor-specific neoantigens (45, 51, 52) and induce antitumor immunity.
Supplementary Material
Acknowledgments
Financial Support: Funding for the work has been provided by the UAB SPORE in Breast Cancer (NCI P50 CA089019), the Breast Cancer Research Foundation of Alabama, the Cancer Center Core Support Grant (P30 CA013148), and the Susan G. Komen for the Cure Foundation (KG090969).
Footnotes
Conflict of Interest: The authors have no conflicts to disclose.
References
- 1.Dent R, Trudeau M, Pritchard KI, Hanna WM, Kahn HK, Sawka CA, et al. Triple-negative breast cancer: clinical features and patterns of recurrence. Clinical cancer research: an official journal of the American Association for Cancer Research. 2007 Aug 1;13(15 Pt 1):4429–34. doi: 10.1158/1078-0432.CCR-06-3045. [DOI] [PubMed] [Google Scholar]
- 2.Blows FM, Driver KE, Schmidt MK, Broeks A, van Leeuwen FE, Wesseling J, et al. Subtyping of breast cancer by immunohistochemistry to investigate a relationship between subtype and short and long term survival: a collaborative analysis of data for 10,159 cases from 12 studies. PLoS Med. 2010 May;7(5):e1000279. doi: 10.1371/journal.pmed.1000279. [DOI] [PMC free article] [PubMed] [Google Scholar]
- 3.Criscitiello C, Azim HA, Jr, Schouten PC, Linn SC, Sotiriou C. Understanding the biology of triple-negative breast cancer. Ann Oncol. 2012 Aug;23(Suppl 6):vi13–8. doi: 10.1093/annonc/mds188. [DOI] [PubMed] [Google Scholar]
- 4.Desmedt C, Haibe-Kains B, Wirapati P, Buyse M, Larsimont D, Bontempi G, et al. Biological processes associated with breast cancer clinical outcome depend on the molecular subtypes. Clinical cancer research: an official journal of the American Association for Cancer Research. 2008 Aug 15;14(16):5158–65. doi: 10.1158/1078-0432.CCR-07-4756. [DOI] [PubMed] [Google Scholar]
- 5.Kelly CM, Bernard PS, Krishnamurthy S, Wang B, Ebbert MT, Bastien RR, et al. Agreement in risk prediction between the 21-gene recurrence score assay (Oncotype DX(R)) and the PAM50 breast cancer intrinsic Classifier in early-stage estrogen receptor-positive breast cancer. Oncologist. 2012;17(4):492–8. doi: 10.1634/theoncologist.2012-0007. [DOI] [PMC free article] [PubMed] [Google Scholar]
- 6.Sabatier R, Finetti P, Cervera N, Lambaudie E, Esterni B, Mamessier E, et al. A gene expression signature identifies two prognostic subgroups of basal breast cancer. Breast cancer research and treatment. 2011 Apr;126(2):407–20. doi: 10.1007/s10549-010-0897-9. [DOI] [PubMed] [Google Scholar]
- 7.Teschendorff AE, Miremadi A, Pinder SE, Ellis IO, Caldas C. An immune response gene expression module identifies a good prognosis subtype in estrogen receptor negative breast cancer. Genome Biol. 2007;8(8):R157. doi: 10.1186/gb-2007-8-8-r157. [DOI] [PMC free article] [PubMed] [Google Scholar]
- 8.Yau C, Esserman L, Moore DH, Waldman F, Sninsky J, Benz CC. A multigene predictor of metastatic outcome in early stage hormone receptor-negative and triple-negative breast cancer. Breast Cancer Res. 2010;12(5):R85. doi: 10.1186/bcr2753. [DOI] [PMC free article] [PubMed] [Google Scholar]
- 9.Iglesia MD, Vincent BG, Parker JS, Hoadley KA, Carey LA, Perou CM, et al. Prognostic B-cell signatures using mRNA-seq in patients with subtype-specific breast and ovarian cancer. Clinical cancer research: an official journal of the American Association for Cancer Research. 2014 Jul 15;20(14):3818–29. doi: 10.1158/1078-0432.CCR-13-3368. [DOI] [PMC free article] [PubMed] [Google Scholar]
- 10.Adams S, Gray RJ, Demaria S, Goldstein L, Perez EA, Shulman LN, et al. Prognostic value of tumor-infiltrating lymphocytes in triple-negative breast cancers from two phase III randomized adjuvant breast cancer trials: ECOG 2197 and ECOG 1199. J Clin Oncol. 2014 Sep 20;32(27):2959–66. doi: 10.1200/JCO.2013.55.0491. [DOI] [PMC free article] [PubMed] [Google Scholar]
- 11.Denkert C, Loibl S, Noske A, Roller M, Muller BM, Komor M, et al. Tumor-associated lymphocytes as an independent predictor of response to neoadjuvant chemotherapy in breast cancer. J Clin Oncol. 2010 Jan 1;28(1):105–13. doi: 10.1200/JCO.2009.23.7370. [DOI] [PubMed] [Google Scholar]
- 12.West NR, Milne K, Truong PT, Macpherson N, Nelson BH, Watson PH. Tumor-infiltrating lymphocytes predict response to anthracycline-based chemotherapy in estrogen receptor-negative breast cancer. Breast Cancer Res. 2011;13(6):R126. doi: 10.1186/bcr3072. [DOI] [PMC free article] [PubMed] [Google Scholar]
- 13.Loi S. Host antitumor immunity plays a role in the survival of patients with newly diagnosed triple-negative breast cancer. J Clin Oncol. 2014 Sep 20;32(27):2935–7. doi: 10.1200/JCO.2014.56.7677. [DOI] [PubMed] [Google Scholar]
- 14.Matsumoto H, Koo SL, Dent R, Tan PH, Iqbal J. Role of inflammatory infiltrates in triple negative breast cancer. J Clin Pathol. 2015 Jul;68(7):506–10. doi: 10.1136/jclinpath-2015-202944. [DOI] [PubMed] [Google Scholar]
- 15.Guo Y, Sheng Q, Li J, Ye F, Samuels DC, Shyr Y. Large scale comparison of gene expression levels by microarrays and RNAseq using TCGA data. PLoS One. 2013;8(8):e71462. doi: 10.1371/journal.pone.0071462. [DOI] [PMC free article] [PubMed] [Google Scholar]
- 16.Xu X, Zhang Y, Williams J, Antoniou E, McCombie WR, Wu S, et al. Parallel comparison of Illumina RNA-Seq and Affymetrix microarray platforms on transcriptomic profiles generated from 5-aza-deoxy-cytidine treated HT-29 colon cancer cells and simulated datasets. BMC bioinformatics. 2013;14(Suppl 9):S1. doi: 10.1186/1471-2105-14-S9-S1. [DOI] [PMC free article] [PubMed] [Google Scholar]
- 17.Gertz J, Varley KE, Davis NS, Baas BJ, Goryshin IY, Vaidyanathan R, et al. Transposase mediated construction of RNA-seq libraries. Genome research. 2012 Jan;22(1):134–41. doi: 10.1101/gr.127373.111. [DOI] [PMC free article] [PubMed] [Google Scholar]
- 18.Trapnell C, Pachter L, Salzberg SL. TopHat: discovering splice junctions with RNA-Seq. Bioinformatics. 2009 May 1;25(9):1105–11. doi: 10.1093/bioinformatics/btp120. [DOI] [PMC free article] [PubMed] [Google Scholar]
- 19.Harrow J, Denoeud F, Frankish A, Reymond A, Chen CK, Chrast J, et al. GENCODE: producing a reference annotation for ENCODE. Genome Biol. 2006;7(Suppl 1):S41–9. doi: 10.1186/gb-2006-7-s1-s4. [DOI] [PMC free article] [PubMed] [Google Scholar]
- 20.Quinlan AR, Hall IM. BEDTools: a flexible suite of utilities for comparing genomic features. Bioinformatics. 2010 Mar 15;26(6):841–2. doi: 10.1093/bioinformatics/btq033. [DOI] [PMC free article] [PubMed] [Google Scholar]
- 21.Trapnell C, Williams BA, Pertea G, Mortazavi A, Kwan G, van Baren MJ, et al. Transcript assembly and quantification by RNA-Seq reveals unannotated transcripts and isoform switching during cell differentiation. Nat Biotechnol. 2010 May;28(5):511–5. doi: 10.1038/nbt.1621. [DOI] [PMC free article] [PubMed] [Google Scholar]
- 22.Wilkerson MD, Hayes DN. ConsensusClusterPlus: a class discovery tool with confidence assessments and item tracking. Bioinformatics. 2010 Jun 15;26(12):1572–3. doi: 10.1093/bioinformatics/btq170. [DOI] [PMC free article] [PubMed] [Google Scholar]
- 23.Chen X, Li J, Gray WH, Lehmann BD, Bauer JA, Shyr Y, et al. TNBCtype: A Subtyping Tool for Triple-Negative Breast Cancer. Cancer informatics. 2012;11:147–56. doi: 10.4137/CIN.S9983. [DOI] [PMC free article] [PubMed] [Google Scholar]
- 24.Li J, Tibshirani R. Finding consistent patterns: a nonparametric approach for identifying differential expression in RNA-Seq data. Statistical methods in medical research. 2013 Oct;22(5):519–36. doi: 10.1177/0962280211428386. [DOI] [PMC free article] [PubMed] [Google Scholar]
- 25.Mihaly Z, Kormos M, Lanczky A, Dank M, Budczies J, Szasz MA, et al. A meta-analysis of gene expression-based biomarkers predicting outcome after tamoxifen treatment in breast cancer. Breast cancer research and treatment. 2013 Jul;140(2):219–32. doi: 10.1007/s10549-013-2622-y. [DOI] [PubMed] [Google Scholar]
- 26.Gyorffy B, Lanczky A, Eklund AC, Denkert C, Budczies J, Li Q, et al. An online survival analysis tool to rapidly assess the effect of 22,277 genes on breast cancer prognosis using microarray data of 1,809 patients. Breast cancer research and treatment. 2010 Oct;123(3):725–31. doi: 10.1007/s10549-009-0674-9. [DOI] [PubMed] [Google Scholar]
- 27.Li Q, Birkbak NJ, Gyorffy B, Szallasi Z, Eklund AC. Jetset: selecting the optimal microarray probe set to represent a gene. BMC bioinformatics. 2011;12:474. doi: 10.1186/1471-2105-12-474. [DOI] [PMC free article] [PubMed] [Google Scholar]
- 28.Maisonneuve P, Disalvatore D, Rotmensz N, Curigliano G, Colleoni M, Dellapasqua S, et al. Proposed new clinicopathological surrogate definitions of luminal A and luminal B (HER2-negative) intrinsic breast cancer subtypes. Breast Cancer Res. 2014;16(3):R65. doi: 10.1186/bcr3679. [DOI] [PMC free article] [PubMed] [Google Scholar]
- 29.Mihály Z, Győrffy B. Improving Pathological Assessment of Breast Cancer by Employing Array-Based Transcriptome Analysis. Microarrays. 2013;2(3):228–42. doi: 10.3390/microarrays2030228. [DOI] [PMC free article] [PubMed] [Google Scholar]
- 30.Boersma BJ, Reimers M, Yi M, Ludwig JA, Luke BT, Stephens RM, et al. A stromal gene signature associated with inflammatory breast cancer. Int J Cancer. 2008 Mar 15;122(6):1324–32. doi: 10.1002/ijc.23237. [DOI] [PubMed] [Google Scholar]
- 31.Kim D, Langmead B, Salzberg SL. HISAT: a fast spliced aligner with low memory requirements. Nat Methods. 2015 Apr;12(4):357–60. doi: 10.1038/nmeth.3317. [DOI] [PMC free article] [PubMed] [Google Scholar]
- 32.Anders S, Pyl PT, Huber W. HTSeq--a Python framework to work with high-throughput sequencing data. Bioinformatics. 2015 Jan 15;31(2):166–9. doi: 10.1093/bioinformatics/btu638. [DOI] [PMC free article] [PubMed] [Google Scholar]
- 33.Love MI, Huber W, Anders S. Moderated estimation of fold change and dispersion for RNA-seq data with DESeq2. Genome Biol. 2014;15(12):550. doi: 10.1186/s13059-014-0550-8. [DOI] [PMC free article] [PubMed] [Google Scholar]
- 34.Auer PL, Doerge RW. Statistical design and analysis of RNA sequencing data. Genetics. 2010 Jun;185(2):405–16. doi: 10.1534/genetics.110.114983. [DOI] [PMC free article] [PubMed] [Google Scholar]
- 35.Zwiener I, Frisch B, Binder H. Transforming RNA-Seq data to improve the performance of prognostic gene signatures. PLoS One. 2014;9(1):e85150. doi: 10.1371/journal.pone.0085150. [DOI] [PMC free article] [PubMed] [Google Scholar]
- 36.Cox DR, Oakes D. Analysis of survival data. London; New York: Chapman and Hall; 1984. p. viii.p. 201. [Google Scholar]
- 37.Lehmann BD, Bauer JA, Chen X, Sanders ME, Chakravarthy AB, Shyr Y, et al. Identification of human triple-negative breast cancer subtypes and preclinical models for selection of targeted therapies. The Journal of clinical investigation. 2011 Jul;121(7):2750–67. doi: 10.1172/JCI45014. [DOI] [PMC free article] [PubMed] [Google Scholar]
- 38.Stagg J, Allard B. Immunotherapeutic approaches in triple-negative breast cancer: latest research and clinical prospects. Ther Adv Med Oncol. 2013 May;5(3):169–81. doi: 10.1177/1758834012475152. [DOI] [PMC free article] [PubMed] [Google Scholar]
- 39.McDermott RS, Beuvon F, Pauly M, Pallud C, Vincent-Salomon A, Mosseri V, et al. Tumor antigens and antigen-presenting capacity in breast cancer. Pathobiology. 2002;70(6):324–32. doi: 10.1159/000071272. [DOI] [PubMed] [Google Scholar]
- 40.Moller P, Mattfeldt T, Gross C, Schlosshauer P, Koch A, Koretz K, et al. Expression of HLA-A, -B, -C, -DR, -DP, -DQ, and of HLA-D-associated invariant chain (Ii) in non-neoplastic mammary epithelium, fibroadenoma, adenoma, and carcinoma of the breast. Am J Pathol. 1989 Jul;135(1):73–83. [PMC free article] [PubMed] [Google Scholar]
- 41.Mostafa AA, Codner D, Hirasawa K, Komatsu Y, Young MN, Steimle V, et al. Activation of ERalpha signaling differentially modulates IFN-gamma induced HLA-class II expression in breast cancer cells. PLoS One. 2014;9(1):e87377. doi: 10.1371/journal.pone.0087377. [DOI] [PMC free article] [PubMed] [Google Scholar]
- 42.Oldford SA, Robb JD, Codner D, Gadag V, Watson PH, Drover S. Tumor cell expression of HLA-DM associates with a Th1 profile and predicts improved survival in breast carcinoma patients. Int Immunol. 2006 Nov;18(11):1591–602. doi: 10.1093/intimm/dxl092. [DOI] [PubMed] [Google Scholar]
- 43.Ruiz-Cabello F, Klein E, Garrido F. MHC antigens on human tumors. Immunol Lett. 1991 Aug;29(3):181–9. doi: 10.1016/0165-2478(91)90168-a. [DOI] [PubMed] [Google Scholar]
- 44.Varley KE, Gertz J, Roberts BS, Davis NS, Bowling KM, Kirby MK, et al. Recurrent read-through fusion transcripts in breast cancer. Breast cancer research and treatment. 2014 Jul;146(2):287–97. doi: 10.1007/s10549-014-3019-2. [DOI] [PMC free article] [PubMed] [Google Scholar]
- 45.Armstrong TD, Clements VK, Martin BK, Ting JP, Ostrand-Rosenberg S. Major histocompatibility complex class II-transfected tumor cells present endogenous antigen and are potent inducers of tumor-specific immunity. Proc Natl Acad Sci U S A. 1997 Jun 24;94(13):6886–91. doi: 10.1073/pnas.94.13.6886. [DOI] [PMC free article] [PubMed] [Google Scholar]
- 46.Gastl G, Marth C, Leiter E, Gattringer C, Mayer I, Daxenbichler G, et al. Effects of human recombinant alpha 2 arg-interferon and gamma-interferon on human breast cancer cell lines: dissociation of antiproliferative activity and induction of HLA-DR antigen expression. Cancer Res. 1985 Jul;45(7):2957–61. [PubMed] [Google Scholar]
- 47.Jabrane-Ferrat N, Campbell MJ, Esserman LJ, Peterlin BM. Challenge with mammary tumor cells expressing MHC class II and CD80 prevents the development of spontaneously arising tumors in MMTV-neu transgenic mice. Cancer Gene Ther. 2006 Nov;13(11):1002–10. doi: 10.1038/sj.cgt.7700974. [DOI] [PubMed] [Google Scholar]
- 48.Meazza R, Comes A, Orengo AM, Ferrini S, Accolla RS. Tumor rejection by gene transfer of the MHC class II transactivator in murine mammary adenocarcinoma cells. Eur J Immunol. 2003 May;33(5):1183–92. doi: 10.1002/eji.200323712. [DOI] [PubMed] [Google Scholar]
- 49.Mortara L, Castellani P, Meazza R, Tosi G, De Lerma Barbaro A, Procopio FA, et al. CIITA-induced MHC class II expression in mammary adenocarcinoma leads to a Th1 polarization of the tumor microenvironment, tumor rejection, and specific antitumor memory. Clinical cancer research: an official journal of the American Association for Cancer Research. 2006 Jun 1;12(11 Pt 1):3435–43. doi: 10.1158/1078-0432.CCR-06-0165. [DOI] [PubMed] [Google Scholar]
- 50.Pulaski BA, Ostrand-Rosenberg S. Reduction of established spontaneous mammary carcinoma metastases following immunotherapy with major histocompatibility complex class II and B7.1 cell-based tumor vaccines. Cancer Res. 1998 Apr 1;58(7):1486–93. [PubMed] [Google Scholar]
- 51.Brown SD, Warren RL, Gibb EA, Martin SD, Spinelli JJ, Nelson BH, et al. Neo-antigens predicted by tumor genome meta-analysis correlate with increased patient survival. Genome research. 2014 May;24(5):743–50. doi: 10.1101/gr.165985.113. [DOI] [PMC free article] [PubMed] [Google Scholar]
- 52.Kreiter S, Vormehr M, van de Roemer N, Diken M, Lower M, Diekmann J, et al. Mutant MHC class II epitopes drive therapeutic immune responses to cancer. Nature. 2015 Apr 30;520(7549):692–6. doi: 10.1038/nature14426. [DOI] [PMC free article] [PubMed] [Google Scholar]
Associated Data
This section collects any data citations, data availability statements, or supplementary materials included in this article.