Abstract
Information technology systems within health care, such as picture archiving and communication system (PACS) in radiology, can have a positive impact on production but can also risk compromising quality. The widespread use of PACS has removed the previous feedback loop between radiologists and technologists. Instead of direct communication of quality discrepancies found for an examination, the radiologist submitted a paper-based quality-control report. A web-based issue-reporting tool can help restore some of the feedback loop and also provide possibilities for more detailed analysis of submitted errors. The purpose of this study was to evaluate the hypothesis that data from use of an online error reporting software for quality control can focus our efforts within our department. For the 372,258 radiologic examinations conducted during the 6-month period study, 930 errors (390 exam protocol, 390 exam validation, and 150 exam technique) were submitted, corresponding to an error rate of 0.25 %. Within the category exam protocol, technologist documentation had the highest number of submitted errors in ultrasonography (77 errors [44 %]), while imaging protocol errors were the highest subtype error for computed tomography modality (35 errors [18 %]). Positioning and incorrect accession had the highest errors in the exam technique and exam validation error category, respectively, for nearly all of the modalities. An error rate less than 1 % could signify a system with a very high quality; however, a more likely explanation is that not all errors were detected or reported. Furthermore, staff reception of the error reporting system could also affect the reporting rate.
Keywords: PACS, Quality assurance, Web technology
Introduction
Many aspects of healthcare have an ongoing opportunity for quality review that can benefit from regular measurement and continuous improvement. While much of the discussion about quality focuses on primary clinical medicine, an increasing literature is also scrutinizing the quality of radiology services [1, 2]. Hillman et al. [3] define quality as: “The extent to which the right procedure is done in the right way at the right time, and the correct interpretation is accurately and quickly communicated to the patient and referring physician.” As aligned with this statement, the key components of quality may include appropriateness of the examination and the procedure protocol, accuracy of interpretation, communication of results, and measuring and monitoring performance improvement in quality, safety, and efficiency. Many of these aspects of quality are currently being addressed in hospitals in a variety of focused quality improvement programs, in which common problems in work flow or care processes are systematically identified and changed to improve practice. However, some components of quality are difficult to address by purely operational or administrative measures because they are information-intensive and may even challenge typical human capability [4].
The first task many radiology practices face when they “go digital” is incorporating the quality-control practices that were used in the film environment. When a technologist no longer comes into the reading room to hang films, something is lost in the relationship between radiologist and technologist. When referring physicians no longer engage the radiologist in face-to-face consultations, something is lost in that relationship too. These changes may contribute to compromised quality [5]. In the past, radiologists could note on the film if the images were poorly collimated or were substandard in some other way. But, in an electronic environment, there is less opportunity for direct feedback between radiologists and technologists potentially resulting in a downward spiral in quality. Moreover, when radiologists do submit quality-control reports, they may be using the same paper-based forms developed years ago. As practice widely engaged picture archiving and communication systems (PACS), users may have continued recording issues encountered with a heterogeneous set of limited paper-based forms. New electronic tools make the recorded issues easy to aggregate or audit and prevent frequently misplaced or lost reports entirely [5, 6]. A web-based issue-reporting tool can help bridge the quality assessment (QA) process in modern radiology [6] notably in the gap between paper and fully interfaced QA software available directly in PACS that provides a system for reporting errors with minimal supporting staff effort and significantly less time investment by radiologists in [6–8]. Lowering the barriers for radiologists’ access to QA problem reporting can dramatically increase the submission of QA issues [9]. This automated feedback can provide a vital link in improving diagnostic accuracy and technologists’ performance in an environment of increasing workloads. Strong feedback loops ensure good communication between radiologists and technologists and can lead to increased productivity, smoother work flows, decreased waste, and ultimately, enhanced patient outcomes [10].
In 2013, the Radiology Department at University Hospitals Cleveland implemented PeerVue Qualitative Intelligence Communication System (QICS), an automated tool for tracking imaging procedure QA issues. During the first month of implementation, the radiologists who were members of the department’s informatics committee trained with the software and tested it as a pilot. Following small adjustments from that initial use, QICS was deployed throughout the department academic sections and then to the community hospitals. Now, a year after implementing this new online system, we evaluate this system under the hypothesis that data from it can focus our efforts in managing quality control within our radiology department.
Materials and Methods
This work met criteria for exemption from our institutional review board review as no protected health information and patient identified data were used.
QA Reporting System
PeerVue QICS is a web-based software integrated into the PACS that allows radiologists to submit issues or errors encountered in the context of the patient study while continuing to view images and dictate reports [11]. PeerVue QICS consists of a web application running on the hospital intranet which for the convenience of radiologists can be accessed from the departmental PACS, or healthcare providers support personnel and managers can access the web application directly from a web browser. The software provides an automated follow-up section for supervisors and managers to respond and to assure feedback. Formatted reports, generated monthly from PeerVue QICS, are sent to supervisors and modality directors, and contain information relevant to their areas to provide analysis and support response to any trends.
Data
For the purpose of assessing the initial effect of implementing the web-based software, manual QC forms submitted within 2 months prior to the software installation were compared to the subsequent PeerVue customized reports 2 months after fully deployment of the software.
One year after full adaptation of the web-based software, errors submitted by PACS users through PeerVue QICS during a 6-month period (January 2014 to June 2014) were collected. The errors were submitted from 26 medical and health centers affiliated with University Hospitals Cleveland. Due to the differences between imaging workloads, a number of radiologists on-site, experience levels, applications (e.g., clinical only, educational and clinical, etc.) and practice settings, and the medical and health centers were categorized into four different groups: academic medical centers (n = 2), regional medical centers (n = 6), ambulatory health centers (n = 14), and offices with a single modality (n = 4).
The software is configured to accept and categorize submitted errors into any kind of categories and subcategories. Our department used a configuration of three major categories and several subcategories per major category. The categories and subcategories which have been used by our department were produced by a survey conducted among the radiologists and PACS specialists, and a consensus between the heads of the department consisting of chairman, vice-chairman, chief medical information officer, and PACS administrator. The three major categories were as follows:
Exam protocol: errors that refer to the imaging protocol not being followed. We have system-wide protocols for all modalities that incorporate the types and numbers of views on computed radiographs, appropriate sequences on MRI, etc.
Exam technique: errors that refer to improper acquisition methods, e.g., the patient was not centered correctly, the field of view was not appropriate, the contrast bolus was not appropriately given, the dose was too high, etc.
Exam validation: errors that refer to issues with attributes of distribution such as exam completion, transfer to PACS, and administrative labels
Statistical Analysis
For descriptive analysis, data are presented as frequencies and percentages. Differences in reported error subtypes for different subgroups were analyzed with Pearson’s chi-squared test. Statistical significance was defined as p < 0.05. Analyses were performed using SPSS Statistics for Windows Version 20 (IBM Corp; Armonk, New York, USA).
Results
Initial Effect
Data from 2 months before and 2 months after introducing the software showed an increase in the number of reports by a factor of more than two (166 errors vs. 364 errors) for nearly the same exam volumes across the period.
After Full Adaptation
Number of Submissions
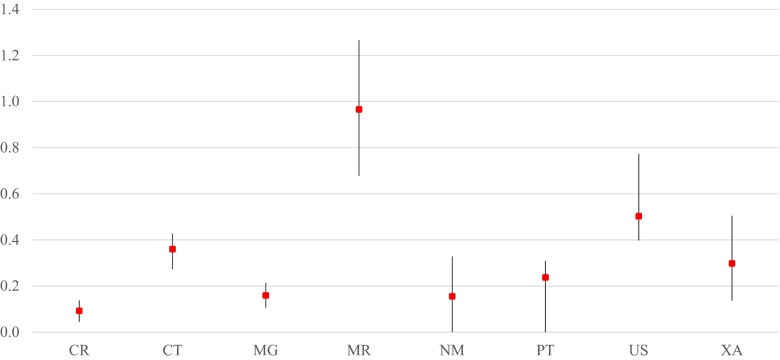
For the 372,258 radiologic examinations that were conducted during the 6-month period, 930 errors (corresponding to an error submission rate of 0.25 %) were received in aggregate, with differing reported error rates (i.e., number of errors reported to number of exams performed) for each modality ranging from 0.1 % to just under 1.0 % (Fig. 1). As shown in Table 1, exam protocol and exam validation errors were the most frequently reported, with 390 errors (42 %) submitted for each respective category, and exam technique errors were the least reported with 150 submitted errors (16 %).
Fig. 1.
Percent of exams with submitted quality report, per modality (mean and range from 6 months of data). CR computed radiography, CT computed tomography, MG mammography, MR magnetic resonance imaging, NM nuclear medicine, PT physical therapy, US ultrasonography, XA X-ray angiography
Table 1.
Error categories and subtypes
| Category | Subtype | Number (%) |
|---|---|---|
| Exam protocol n = 390 (41.94 %) |
Contrast utilization | 17 (1.83) |
| Dose levels not reconstructed | 0 | |
| Images scroll in wrong direction | 12 (1.30) | |
| Imaging protocol | 98 (10.54) | |
| Incorrect size-specific protocol | 2 (0.21) | |
| Labeling | 37 (3.98) | |
| Standard views/series | 30 (3.22) | |
| Technologist documentation | 113 (12.15) | |
| Others | 81 (8.71) | |
| Exam technique n = 150 (16.12 %) |
Artifacts | 8 (0.86) |
| Collimation | 3 (0.32) | |
| Contrast bolus | 8 (0.86) | |
| Dose | 0 | |
| Field of view (FOV) | 18 (1.94) | |
| Image quality | 27 (2.90) | |
| Motion | 7 (0.75) | |
| Positioning | 47 (5.05) | |
| Series interleaved | 2 (0.21) | |
| Others | 30 (3.23) | |
| Exam validation n = 390 (41.94 %) |
Exam completion | 86 (9.25) |
| Images not sent to PACS | 41 (4.41) | |
| Incorrect accession | 121 (13.01) | |
| Incorrect modifier | 55 (5.91) | |
| PACS hanging | 58 (6.24) | |
| Others | 29 (3.12) |
PACS picture archiving and communication system
Submissions by Modality
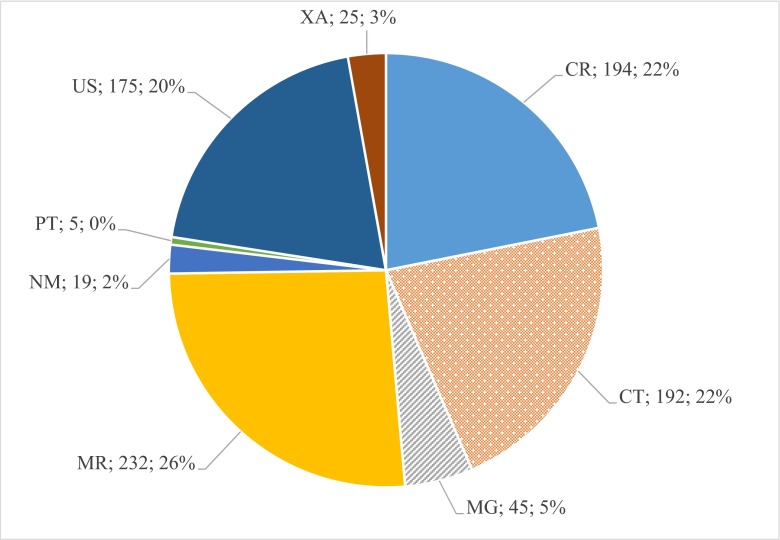
The greatest number of error submissions involved magnetic resonance (MR) imaging (232 errors [26 % of total submissions]), followed by computed radiography (CR) (194 errors [22 %]) and computed tomography (CT) (192 errors [22 %]). See Fig. 2 for complete detail on the number and distribution of errors reported without respect to ratio of numbers performed. Although once normalized to the total exams per modality, CR had the least percentage of errors reported.
Fig. 2.
Distribution of errors by modality. CR computed radiography, CT computed tomography, MG mammography, MR magnetic resonance imaging, NM nuclear medicine, PT physical therapy, US ultrasonography, XA X-ray angiography
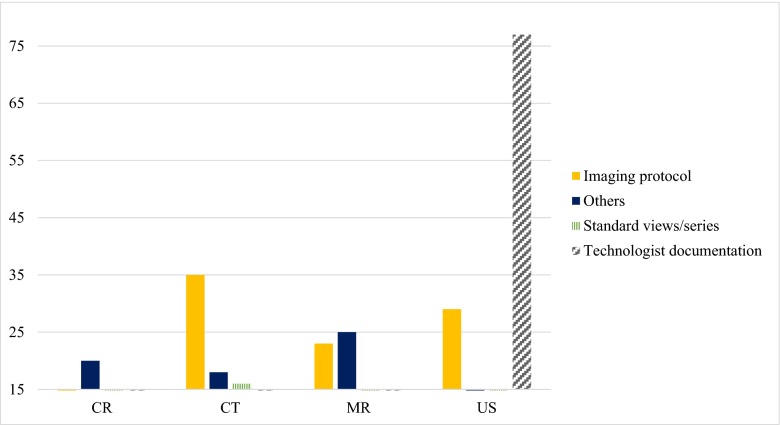
Amongst the exam protocol error subtypes, there was a significant difference in the errors reported for the different modalities (p < 0.0001). Technologist documentation error had the highest number of submissions in ultrasonography (US) (77 errors [44 % of exam protocol errors]), while imaging protocol errors were the highest subtype in CT (35 errors [18 %]). The distribution of exam protocol error subtypes for those with 15 or more submissions is shown in Fig. 3.
Fig. 3.
Number of exam protocol subtype errors per modality (threshold = 15). CR computed radiography, CT computed tomography, MR magnetic resonance imaging, US ultrasonography
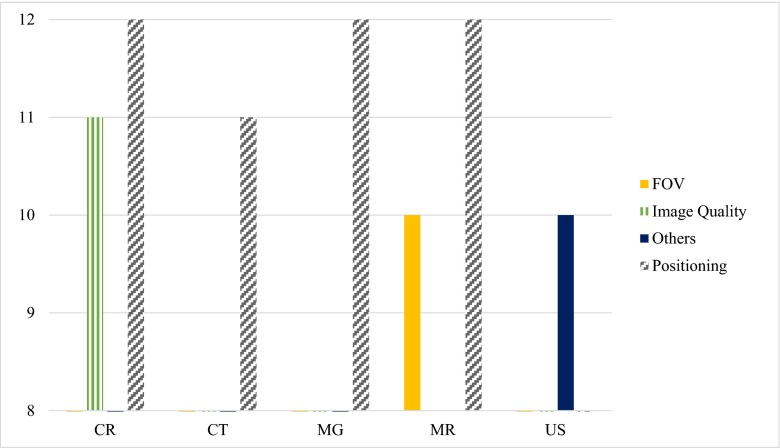
A significant difference in exam technique error subtypes was also observed between different modalities (p < 0.011), though more consistent across modalities than for protocol type errors. By far, positioning had the highest number of errors among the technique subtypes reported for many modalities (Fig. 4).
Fig. 4.
Number of exam technique subtype errors per modality (threshold = 8). CR computed radiography, CT computed tomography, MG mammography, MR magnetic resonance imaging, US ultrasonography, FOV field of view
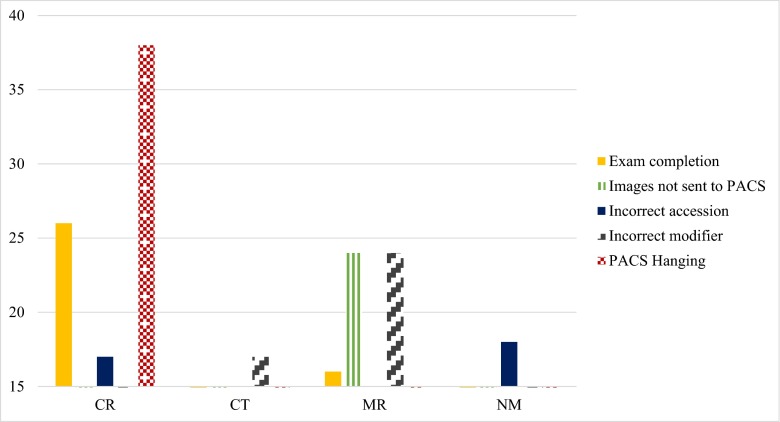
Differences in the reported exam validation subtypes between the modalities were also significant (p < 0.0001). While PACS hanging was considered the most problematic validation issue in CR (38 errors [20 % of exam validation errors]), incorrect modifier errors were highest in MR (24 errors [10 %]) and CT (17 errors [9 %]) (Fig. 5).
Fig. 5.
Number of exam validation subtype errors per modality (threshold = 15). CR computed radiography, CT computed tomography, MR magnetic resonance imaging, NM nuclear medicine
Submissions by Center Category
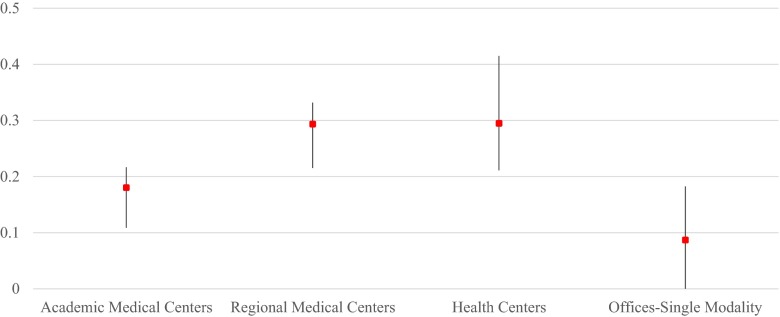
Regional medical centers had the most absolute number of errors submitted (409 errors [44 %]), followed by academic medical centers (262 errors [27 %]) and ambulatory health centers (248 errors [27 %]). Offices with single modality had the least errors submitted (11 errors [1 %]). However, after adjusting by the total exam volumes per center, health centers and regional medical centers had the highest nearly identical percentage of errors (Fig. 6).
Fig. 6.
Percent of exams with submitted quality report, per center type (mean and range from 6 months of data)
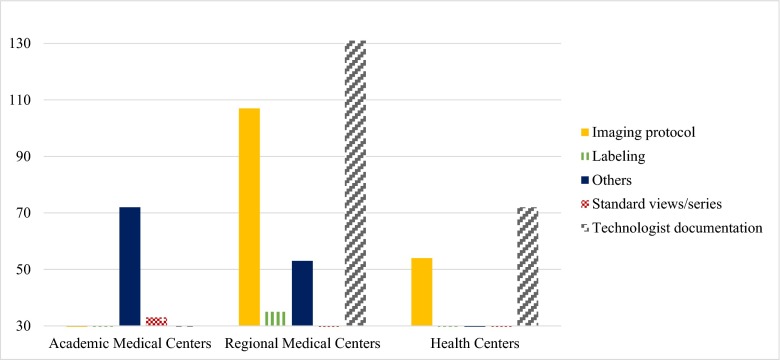
There was a significant difference between the exam protocol error subtypes submitted for the different centers (p < 0.0001). Although technologist documentation was the highest exam protocol error submitted from regional medical centers (131 errors [32 %]), it was nearly the lowest in academic medical centers (six errors [0.02 %]). Figure 7 shows this distribution.
Fig. 7.
Number of exam protocol subtype errors per center (threshold = 30)
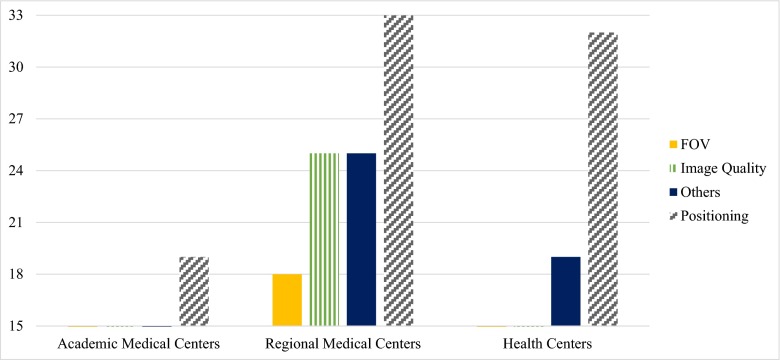
Although errors regarding positioning had the highest amount amongst exam technique errors in all centers, this difference was not statistically significant (p = 0.39) (Fig. 8).
Fig. 8.
Number of exam technique subtype errors per center (threshold = 15). FOV field of view
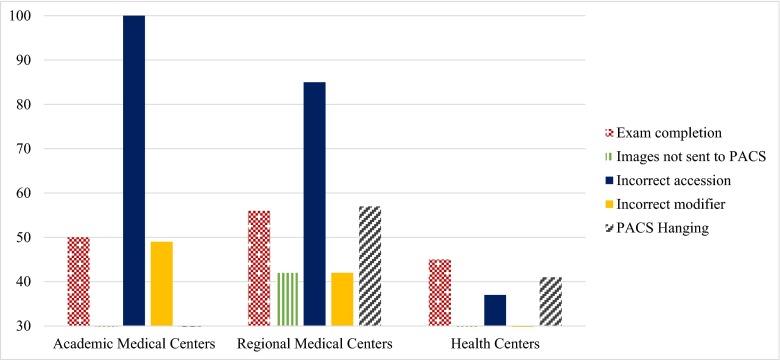
Reported exam validation subtype errors were also statistically different between the centers (p < 0.0001), while incorrect accession had the highest errors reported in academic medical centers (101 errors [38 %]) and in regional medical centers (85 errors [21 %]) and exam completion errors were highest in the other two types of centers (Fig. 9).
Fig. 9.
Number of exam validation subtype errors per center (threshold = 30)
Discussion
Quality in radiology may be defined in many ways. One of these may be “a timely access to and delivery of integrated and appropriate radiological studies and interventions in a safe and responsive facility and a prompt delivery of accurately interpreted reports by capable personnel in an efficient, effective, and sustainable manner” [12]. The ultimate goal of quality assessment programs is to assess performance and to introduce feedback mechanisms that will allow the introduction of change, which in turn should lead to an improvement in the quality of care [13]. We have used an online QA reporting system that permits us to continuously assess quality metrics, which helps us identify and implement performance improvement tasks, and to provide feedback for specified areas of highest reported errors. This confirms our hypothesis that use of such PACS integrated online error reporting system can enable focus on particular processes for improvement. Previous studies have shown that the conversion to an online-based issue-reporting system from a traditionally paper-based system increases the number of events submitted [10, 14]. We also observed a twofold increase in the issues submitted after implementing the PeerVue QICS issue-reporting system which may represent an increase in the reporting of events, documentation of things previously dealt with in other ways (e.g., oral communication), or a true increase in the incidence of such events.
Number of Submission
Previous studies investigating the utility of quality control within radiology departments have reported a range of issue rates. Kruskal et al. [14] reported an adjusted error rate of 0.2 % (605 issues in nearly 300,000 procedures over 9 months). Nagy et al. [10] who used a web-based system called RadTracker reported an issue rate of 0.85 % (2472 issues in 292,360 procedures) of annual volume. Our results show that 930 errors were submitted in a 6-month period time, resulting in an issue rate of 0.25 %, which puts us in the lower end of this range. An error rate less than 1 % could signify a system with a very high quality; however, that holds if and only if substantially all errors are detected and reported. Therefore, surrounding influences such as how well the error reporting system is received by the staff could also affect the reporting rate. Based on a survey conducted on physicians, White reported that 80 % of them did not trust their employing hospital to run an error-reporting system [15]. Besides the trust issue, not having an incentive to submit errors and not knowing how to access the system were other major reasons mentioned for the lack of usage of an online QA reporting system [13]. Radiologists also reported that they still tried to provide feedback on QA issues on a personal basis when they could and submitted formal issues through the system only when these were emergent or time was short [10]. Thus, educating the staff, explaining the benefits of thorough use of online reporting systems and reassurance for quality needs to trust the reporting system can help increase usage.
Type of Errors
Our results showed that the most frequent errors submitted were exam validation and exam protocol (42 % each), in which incorrect accession (13 %) and technologist documentation (12 %) had the highest rates, respectively. Although positioning (5 %) and image quality (2 %) had the highest rates of errors in the exam technique category, they were still much lower. These results, although they differ in the ranking of the subtype errors, are still in line with the overall conclusions of the previous study conducted by Nagy et al. [10], in which patient data problems consistently outnumbered image quality problems. As those authors explain, one partial explanation may lie in the efforts to decrease turnaround times, with speed sometimes causing errors. For example, an error occurs when a technologist does not complete a study in the radiology information system before a radiologist attempts to finalize it. In these cases, the study becomes “stuck,” an issue is submitted, and the technologist or supervisor must complete the study. This is an area in which technologist training and issue-tracking feedback will be especially useful in changing behavior and improving outcomes. The results of this implementation also provided a reminder that although imaging technologists are trained to take excellent images, their training should also emphasize the importance of data quality and its effect on the ability of the department to deliver care in a timely manner.
Errors per Modality
Analyzing the differences of the errors from the various modalities shows that technologist documentation errors were much higher in ultrasound (US) in comparison with the other modalities, signifying the importance of reinforcement with the US technologists the different aspects of proper documentation. While a high number of errors regarding positioning of the patient can be seen in nearly all of the modalities and should be taken into consideration, a high rate of poor image quality in CR provides additional opportunity for our quality improvement program. CR had also the highest number of exam validation errors, specifically issues regarding image hanging in the PACS.
Errors per Center Category
Excluding the single modality offices, the rate of errors increases as we go from more equipped academic centers to less specialized regional medical and ambulatory health centers showing a need for more attention in satellite and non-academic centers especially regarding technologist documentation and patient positioning.
Limitations
Staff resistance to participation or incompletely reinforced education could have led to an underestimation of errors as discussed more fully earlier. Potential underreporting could be in part from concern for data security, privacy, risks associated with external review, discovery, or self-implication. As Fitzgerald [16] mentions, a previous or residual current culture of blame in the health care industry inhibits reporting of error and near misses. We have established a blameless culture at the system risk level and continue to reinforce this in the department.
As another limitation, different perceptions of the error subtypes by different users of the system could have occurred resulting in an interobserver variability in reported errors. Intra-observer variability could also occur leading to decreased reproducibility. Additionally, a decrease in radiologist utilization may have occurred over time, as Meenan [9] concluded in his study that the usage of their online QC Management tool had atrophied over time, resulting in an inaccurate picture of ongoing quality issues in the department. When categorized properly, we expect that different types of QC issues can become more prevalent under different circumstances in proportion to external forces such as system upgrades and workflow changes. Conducting short educational courses for staff to coordinate the perceptions of the error subtypes can decrease variability. Moreover, adding definitions and information about different error categories and subtypes to the software, and even equipping workstations with an educational reference on the error subtype definitions may also help.
Future Plans
We have started meetings to brief our department managers and supervisors in order for them to understand and consider the results of this study for quality improvement in their areas of control. Conducting a posttest study will show how effective the efforts for improvement were.
We may conduct a survey in order to understand whether the error rates were underreported or not, and if so, what reasons are cited for lower usage of this online QA system by radiology staff.
Conclusion
In summary, in continuing to digitalize our radiology department, we have implemented an online imaging Quality Assurance reporting system integrated into our PACS. Exam validation error subtypes such as incorrect accession and exam protocol error subtypes such as technologist documentation and imaging protocol were the most frequent errors reported by the users. We will take these into consideration when implementing performance improvement tasks and evaluate the efficacy of these tasks as part of our ongoing process improvement plans. With this, we confirm our hypothesis that data from this error-reporting system can focus our efforts in managing quality within our expansive radiology department.
References
- 1.Johnson CD, Swensen SJ, Glenn LW, Hovsepian DM. Quality improvement in radiology: white paper report of the 2006 Sun Valley Group meeting. J Am Coll Radiol. 2007;4(3):145–147. doi: 10.1016/j.jacr.2006.10.010. [DOI] [PubMed] [Google Scholar]
- 2.Swensen SJ, Johnson CD. Radiologic quality and safety: mapping value into radiology. J Am Coll Radiol. 2005;2(12):992–1000. doi: 10.1016/j.jacr.2005.08.003. [DOI] [PubMed] [Google Scholar]
- 3.Hillman BJ, Amis ES, Jr, Neiman HL, FORUM Participants The future quality and safety of medical imaging: proceedings of the third annual ACR FORUM. J Am Coll Radiol. 2004;1(1):33–39. doi: 10.1016/S1546-1440(03)00012-7. [DOI] [PubMed] [Google Scholar]
- 4.Rubin DL. Informatics in radiology: measuring and improving quality in radiology: meeting the challenge with informatics. Radiographics. 2011;31(6):1511–1527. doi: 10.1148/rg.316105207. [DOI] [PubMed] [Google Scholar]
- 5.Nagy PG. Using informatics to improve the quality of radiology. Appl Radiol. 2008;46:9–14. [Google Scholar]
- 6.Kohli MD, Warnock M, Daly M, Toland C, Meenan C, Nagy PG. Building blocks for a clinical imaging informatics environment. J Digit Imaging. 2014;27(2):174–181. doi: 10.1007/s10278-013-9645-0. [DOI] [PMC free article] [PubMed] [Google Scholar]
- 7.Nagy P, Warnock M, Daly M, Rehm J, Ehlers K. Radtracker: a web-based open-source issue tracking tool. J Digit Imaging. 2002;15(Suppl 1):114–119. doi: 10.1007/s10278-002-5059-0. [DOI] [PMC free article] [PubMed] [Google Scholar]
- 8.Rybkin AV, Wilson M. A web-based flexible communication system in radiology. J Digit Imaging. 2011;24(5):890–896. doi: 10.1007/s10278-010-9351-0. [DOI] [PMC free article] [PubMed] [Google Scholar]
- 9.Meenan CD: evaluation of a long-term online quality control management system in radiology. SIIM 2012 Annual Meeting, Orlando, FL, 2012
- 10.Nagy PG, Pierce B, Otto M, Safdar NM. Quality control management and communication between radiologists and technologists. J Am Coll Radiol. 2008;5:759–765. doi: 10.1016/j.jacr.2008.01.013. [DOI] [PubMed] [Google Scholar]
- 11.http://www.peervue.com/qics_overview.htm, accessed 10 September 2014
- 12.Dunnick NR, Glenn LW, Hillman BJ, Lau LS, Lexa FJ, Weinreb JC, Wilcox P. Quality improvement in radiology: white paper report of the Sun Valley Group meeting. J Am Coll Radiol. 2006;3:544–549. doi: 10.1016/j.jacr.2006.01.001. [DOI] [PubMed] [Google Scholar]
- 13.Cascade PN. Quality improvement in diagnostic radiology. AJR Am J Roentgenol. 1990;154:1117–1120. doi: 10.2214/ajr.154.5.2108555. [DOI] [PubMed] [Google Scholar]
- 14.Kruskal JB, Yam CS, Sosna J, Hallett DT, Milliman YJ, Kressel HY. Implementation of online radiology quality assurance reporting system for performance improvement: initial evaluation. Radiology. 2006;241(2):518–527. doi: 10.1148/radiol.2412051400. [DOI] [PubMed] [Google Scholar]
- 15.White C. Doctors mistrust systems for reporting medical mistakes. BMJ. 2004;329:12–13. doi: 10.1136/bmj.329.7456.12-d. [DOI] [Google Scholar]
- 16.Fitzgerald R. Radiological error: analysis, standard setting, targeted instruction and teamworking. Eur Radiol. 2005;15(8):1760–1767. doi: 10.1007/s00330-005-2662-8. [DOI] [PubMed] [Google Scholar]


