Abstract
Regular comparison of preliminary to final reports is a critical part of radiology resident and fellow education as prior research has documented substantial preliminary to final discrepancies. Unfortunately, there are many barriers to this comparison: high study volume; overnight rotations without an attending; the ability to finalize reports remotely; the subtle nature of many changes; and lack of easy access to the preliminary report after finalization. We developed a system that automatically compiles and emails a weekly summary of report differences for all residents and fellows. Trainees can also create a custom report using a date range of their choice and can view this data on a resident dashboard. Differences between preliminary and final reports are clearly highlighted with links to the associated study in Picture Archiving and Communication Systems (PACS) for efficient review and learning. Reports with more changes, particularly changes made in the impression, are highlighted to focus attention on those exams with substantive edits. Our system provides an easy way for trainees to review changes to preliminary reports with immediate access to the associated images, thereby improving their educational experience. Departmental surveys showed that our report difference summary is easy to understand and improves the educational experience of our trainees. Additionally, interesting descriptive statistics help us understand how reports are changed by trainee level, by attending, and by exam type. Finally, this system can be easily ported to other departments who have access to their Health Level 7 (HL7) data.
Keywords: Radiology reporting, Radiology workflow, Radiology information systems, Quality assurance, Performance measurement, Medical informatics applications, Interpretation errors, Internship and residency, Health Level 7 (HL7), Medical education, Automated feedback, Resident-attending discrepancy
Background
Regular review and comparison of resident and attending reports is a critical aspect of radiology resident education [1]. Historically, the view box readout with the attending provided feedback for the resident to hone their skills under the guidance of the attending radiologist. Technological advances such as PACS and automated transcription software have helped increase the productivity of radiologists and radiology residents; however, they have also created barriers to face-to-face review of studies with attending radiologists [2, 3]. Many radiology residents now work independently, reviewing images and formulating reports which are later reviewed, edited, and finalized by an attending radiologist—sometimes completely asynchronously.
Significant discrepancies between radiology resident and attending reports have been documented [4, 5]. While face-to-face review with attending radiologists is ideal, there are many barriers to face-to-face review and comparison: high study volume; overnight rotations without an attending; the ability to finalize reports remotely; and the loss of the preliminary report after finalization. None of these barriers are easily overcome—but a method of comparison of preliminary and final reports should be considered a minimum standard to help the resident learn from their own work volume. We believe this method should automatically send residents feedback periodically; clearly highlight report differences for quick visualization; and prioritize those reports that have substantive changes. Recent publications have highlighted the value and utilization of these systems [3, 6, 7]. In this publication, we will discuss how our system works and the differences compared to other systems which have been reported, and report how it has impacted radiology education in our department.
Our system automatically provides residents with a summary highlighting differences between their preliminary reports and the final attending reports. These summaries are generated automatically each week and emailed via a secure link to the residents. Trainees can also generate summary reports on demand for a custom time period entered by the user and can also view these report comparisons on a resident dashboard. Our goal was to provide a comprehensive summary of all reports that were changed, with changes readily highlighted and organized by degree of change. We have worked on creating a visually appealing method of highlighting changes to easily convey which parts have been removed, added, or changed. A direct link to the exam in PACS is included for easy review of images as needed. We have surveyed our residents and fellows to see how they feel about the system and the effect that it has on their learning experience. We have also generated a number of different visualizations of our summary data which provides insight on resident and attending review and reporting styles.
Methods
We receive a real-time Health Level 7 (HL7) feed from our Radiology Information System (RIS) (Siemens) which contains HL7-ORU report messages for all versions of preliminary and final radiology reports. Our Mirth Connect HL7 engine (Mirth Corporation) filters these radiology report messages and parses report data into a MySQL (Oracle) database separated by preliminary and final statuses and with all associated metadata. A Bash (GNU) script queries for all final reports over a desired time period, both automatically on a weekly basis and on demand as requested by trainees, and finds the associated resident-generated preliminary report if it exists.
Our script then compares the preliminary and final reports using the wdiff (GNU) program, which identifies words inserted, deleted, and changed between these versions of the report. An additional comparison of just the impression section of each report, identified using the csplit (GNU) program and regular expressions, is also performed as it was hypothesized that changes in the impression section are potentially more important than changes made elsewhere in the body of the report. Custom parameters given to the wdiff program enable output to be generated in HTML format such that the differences can be easily highlighted and visualized on a web page. A link to PACS for each exam is added to enable quick viewing of images. This HTML is then concatenated into one summary report for each resident and moved to our department web server for viewing.
We also obtain summary statistics on total words changed which help us prioritize those reports with the most changes that are then displayed at the top of each resident’s summary report. These summary statistics also help us generate department-wide statistics on how each resident or attending radiologist performs in terms of changes made to their reports.
Once all reports have been compared, and summaries have been generated for each resident, an email is sent to the resident notifying them that the report is ready for viewing. These emails have also been routed to administration and our residency director for monitoring purposes as well as to keep track of the progress of trainees in developing their reporting technique, especially that of junior residents.
Similar methodology allows viewing of report changes through our department resident dashboard. The dashboard itself is built using the Sinatra Ruby library run through an Apache web server (Apache Software Foundation) and using the Bootstrap web framework. Queries from this application to our MySQL database and similar subsequent comparison using wdiff provide the comparison data for display. Custom date ranges are easily selected through the web interface.
A survey of resident perception of our comparison program was obtained anonymously using a survey website (www.surveymonkey.com). A total of 10 questions were asked and all residents in the training program were surveyed. Topics of the survey included how easy the differences in the reports were to see visually, how easy the report was to understand, if the report improves their learning experience, and the method of report review prior to implementation of our application.
Basic static descriptive summary statistics summarizing report change data across our department with associated charts were initially generated using Microsoft Excel. As departmental interest in these descriptive statistics increased, we have since developed more dynamic visualizations and summary statistics using on-the-fly MySQL queries through PHP (PHP Group) and Sinatra-based web pages with visualizations using the Highcharts JS (Highsoft AS) graphing library.
Results
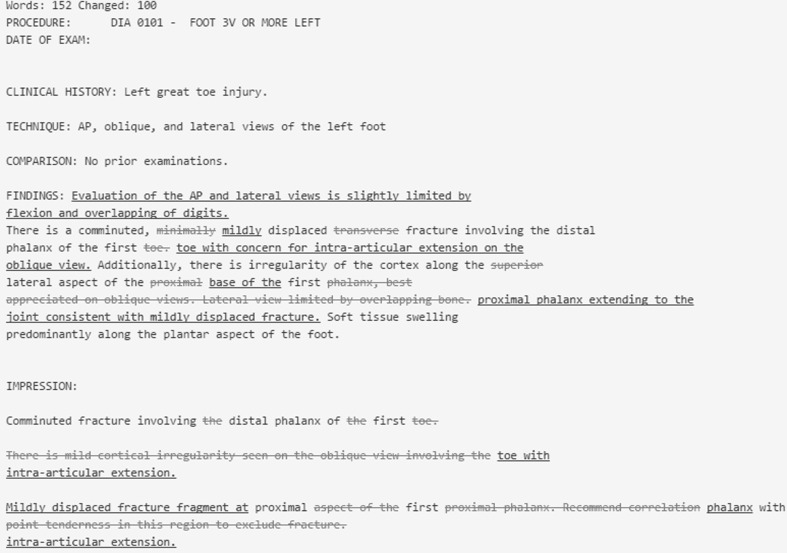
A portion of an example comparison report is shown in Fig. 1. Summary reports of all differences are provided for each resident every week and on demand. The concatenated summary for all reports generated over the time period requested is stored in our departmental web server for viewing. Reports are ordered within our summary by number of words changed to prioritize those reports that have been changed the most, and thus presumably those reports most important for the resident to review.
Fig. 1.
Sample of report comparison
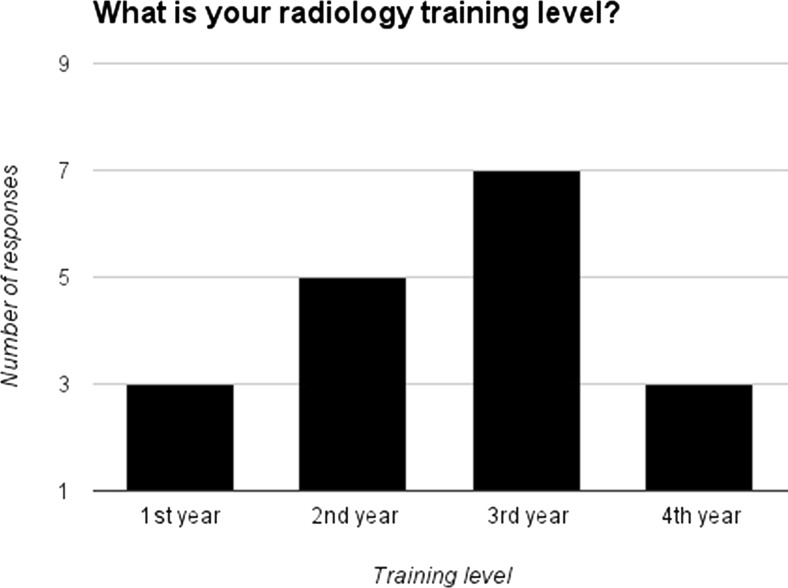
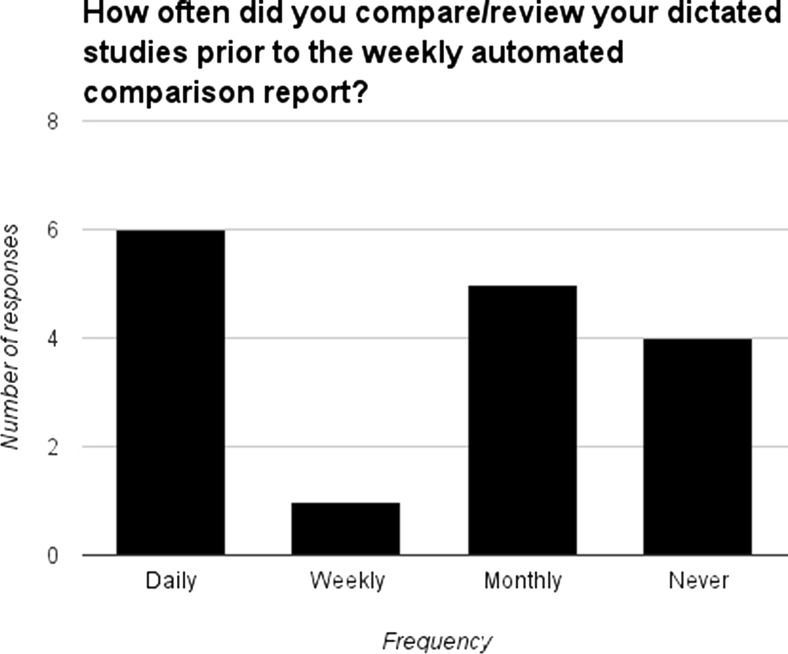
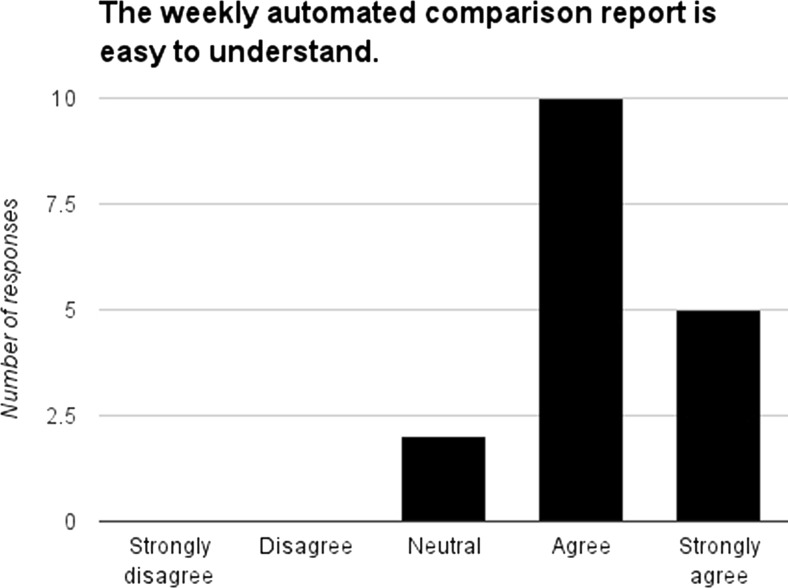
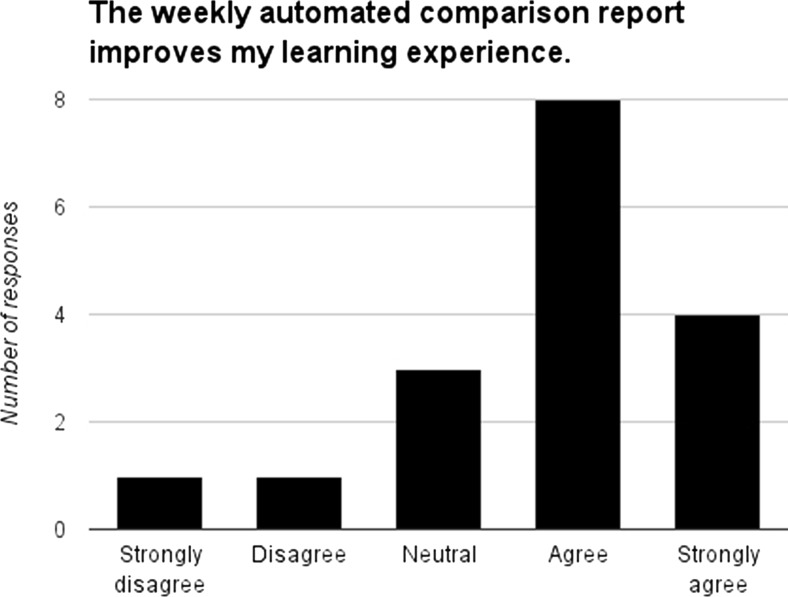
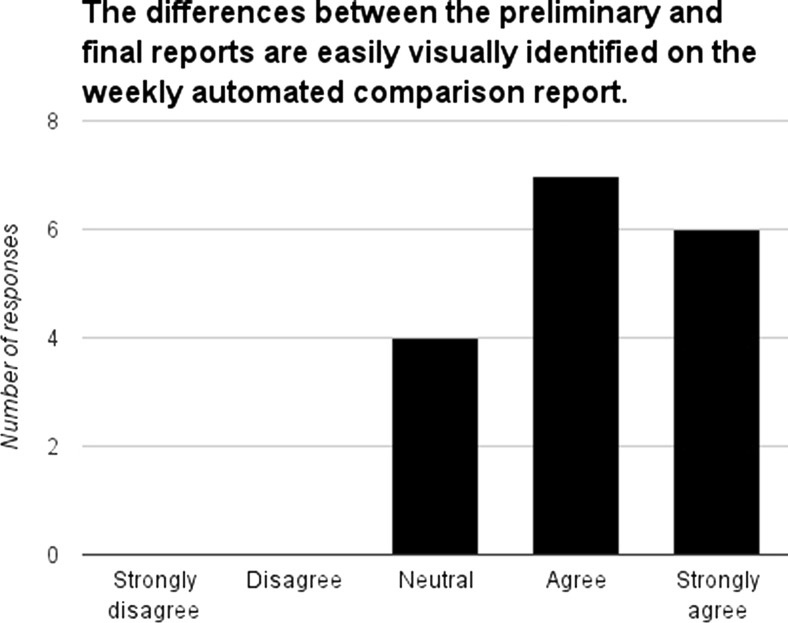
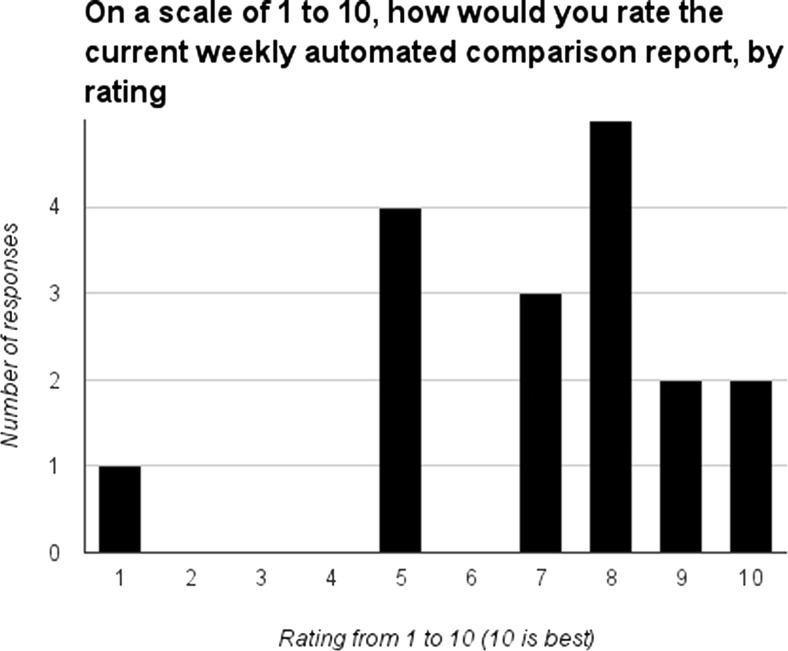
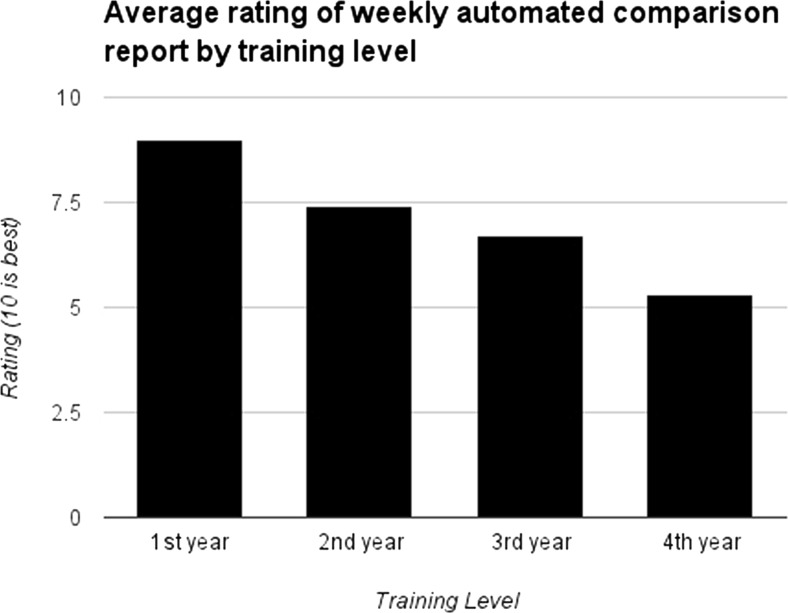
Out of 20 residents in our training program, 18 responded to our survey at least partially. Basic data regarding training level can be seen in Fig. 2. There may have been duplicate responses or misunderstanding regarding radiology training level vs PGY training level, as the seven responses from the third year class exceed the total number of residents in that class. Most residents reviewed their studies to see how their reports were changed although the frequency varied (Fig. 3). Most residents who answered the question regarding ease of understanding agreed or strongly agreed that the comparison report was easy to understand (Fig. 4) and most also believed that it improved their learning experience (Fig. 5). A majority of respondents believed the changes in their reports were easily identified in our comparisons (Fig. 6). Finally, the average rating for all trainee levels was above 5 (out of 10), with first year residents giving an average rating of 9 (Figs. 7 and 8).
Fig. 2.
Distribution of respondent training levels
Fig. 3.
Frequency that residents compared preliminary and final reports before implementation of report comparison email
Fig. 4.
Frequency that residents compared preliminary and final reports before implementation of report comparison email
Fig. 5.
Responses on how the report improves learning experience
Fig. 6.
Responses on how easily differences between reports are visually identified
Fig. 7.
Ratings of the automated comparison report system
Fig. 8.
Average rating of system by training level
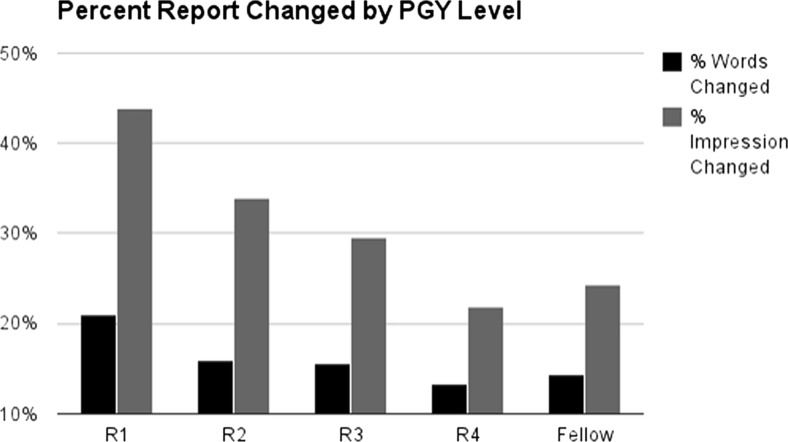
We summarized percentage of words changed by trainee level both for words changed in the whole report and words changed just in the impression section (Fig. 9). Not surprisingly, percentage of words changed decreased each year through the fourth and final year of training. There was actually a slight increase in percentage of words changed in reports for our fellows when compared to fourth year residents, perhaps explained by the fact that many of our fellows come from different institutions and may not be as familiar with the style and report descriptors preferred by the attending radiologists.
Fig. 9.
Percentage of report changed by training level
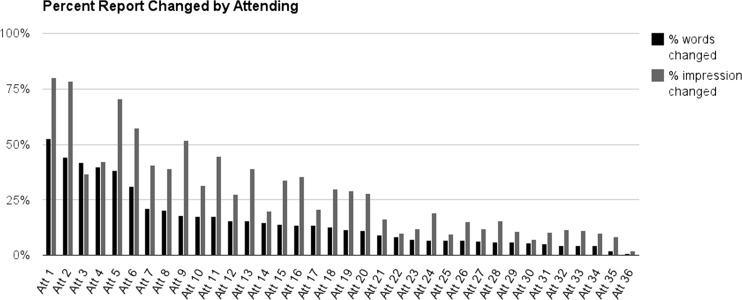
We also summarized percentage of words changed for the attending radiologists (Fig. 10) and have presented this at our monthly departmental quality and safety meetings. There is a wide range of report changing by our attending radiologists from nearly 0 % of the whole report changed to over 50 %, and from approximately 2 % of the impression changed to approximately 80 %.
Fig. 10.
Percentage of report changed for each attending physician
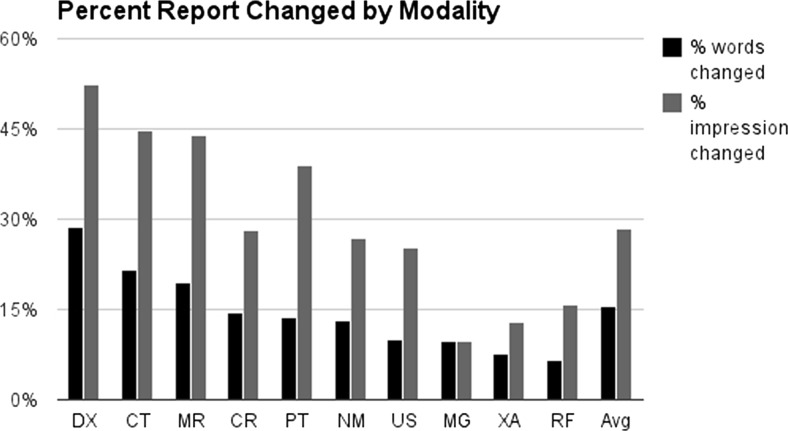
We also described which modalities have the most changes (Fig. 11), and we found that diagnostic radiography (DX), CT, and MR had the most changes while mammography (MG), interventional (XA), and fluoroscopy (RF) had the least.
Fig. 11.
Percentage of report changed by modality
Discussion
Most radiology residents would agree that a major contributor to their training comes from face-to-face feedback received from attending radiologists during readout sessions. However, many barriers described above prevent this from occurring for all resident work. Additionally, residents at our institution generally believe one of the most important and high-volume experiences is “night float” where residents work independently—but attending radiologists at our institution frequently edit and finalize these overnight reports without direct face-to-face feedback and education. This lack of direct feedback is compounded by resident duty hour restrictions which make it difficult for overnight residents to stay for early morning attending radiologist review of overnight studies.
Many systems for providing a means of evaluating the differences in reports have been reported in the literature. We have attempted to improve on these systems by providing: a combination of automatic and manual, on-demand feedback; improved, an easily interpretable display of report changes; prioritization of reports with substantive changes; and on-demand summary descriptive statistics to help understand and improve quality within the department. We have also used this system as a way to help our administration and residency director monitor the development of our trainees and better understand how our residents and attendings perform within our department.
Our survey results show that prior to implementation of the automated comparison report, residents used a variety of methods in order to follow up on their preliminary reports to learn from the changes by the attending radiologist. Barriers of effort, along with technical limitations, for example, the number of studies kept in PACS history, limit how effective these methods can be. After implementing our system, and thereby lowering the barrier to report comparison while also making comparison more efficient, our trainees overall felt that our system made it easy to view the differences in their reports and importantly improved their educational experience.
Interestingly, and perhaps not surprisingly, the average rating was inversely related to trainee level—i.e., those residents just starting to learn radiology found this feedback most helpful. Residents earlier in their training were also more likely to agree that the report improved their learning experience. Residents generally agreed that the report was easy to understand and differences were easily visually identified.
One of the major limitations of our comparison and ranking methodology is that it somewhat crudely highlights any words that have been changed, and prioritizes the summary report simply based on the percent of words changed. Indeed, some of our residents complained that the majority of changes made to their reports were simply stylistic and did not significantly impact patient management, particularly with certain attending radiologists that made the most changes. Clearly, some of these differences are due to style and degree of “pickiness” as many attendings, and residents, could easily predict who would be at the top of our summary. Some of this is likely due to attending radiologist style and idiosyncrasy—two of our self-described pickiest radiologists mostly read diagnostic radiology and CT—while some is likely due to report length and use of standard templates—mammography heavily relies on standard templates which generally change very little. The wide range can also be explained, in part, by attending radiologist specialty and area of interest—for example, one of our attending radiologists who makes very few changes on average almost always does one type of interventional procedure, and always uses the same template for this procedure, so there is generally very little that is subject to change.
One can imagine a more intelligent algorithm that has some level of understanding of the concepts that are being changed in the report such that it could ignore trivial or stylistic changes and focus the trainee on substantive changes that had significant clinical impact. One might also imagine an algorithm that could link changes to actual imaging findings that were missed or misinterpreted. While we have found our system to be very useful, clearly there are improvements in this field that could be made.
Conclusion
Our report comparison tool provides useful and easy consumable feedback to our trainees, residency director, and administration to improve the educational experience of our trainees and better understand the performance of trainees and faculty.
Acknowledgments
We would like to acknowledge Dr. Cirrelda Cooper for her passion in the fields of patient safety and quality improvement, which have motivated us to pursue this project.
Contributor Information
Amit D. Kalaria, Phone: 202 444-3400, Email: akalaria@gmail.com
Ross W. Filice, Email: rwfilice@gmail.com
References
- 1.Issa G, Taslakian B, Itani M, et al. The discrepancy rate between preliminary and official reports of emergency radiology studies: a performance indicator and quality improvement method. Acta Radiol 2014 [DOI] [PubMed]
- 2.Gorniak RJ, Flanders AE, Sharpe RE. Trainee Report Dashboard: Tool for Enhancing Feedback to Radiology Trainees about Their Reports. Radiographics. 2013, 135705. [DOI] [PubMed]
- 3.Sharpe RE, Surrey D, Gorniak RJ, Nazarian L, Rao VM, Flanders AE. Radiology Report Comparator: A novel method to augment resident education. J Digit Imaging. 2012;25(3):330–6. doi: 10.1007/s10278-011-9419-5. [DOI] [PMC free article] [PubMed] [Google Scholar]
- 4.Ruutiainen AT, Durand DJ, Scanlon MH, Itri JN. Increased error rates in preliminary reports issued by radiology residents working more than 10 consecutive hours overnight. Acad Radiol. 2013;20(3):305–11. doi: 10.1016/j.acra.2012.09.028. [DOI] [PubMed] [Google Scholar]
- 5.Ruutiainen AT, Scanlon MH, Itri JN. Identifying benchmarks for discrepancy rates in preliminary interpretations provided by radiology trainees at an academic institution. J Am Coll Radiol. 2011;8(9):644–8. doi: 10.1016/j.jacr.2011.04.003. [DOI] [PubMed] [Google Scholar]
- 6.Itri JN, Redfern RO, Scanlon MH. Using a web-based application to enhance resident training and improve performance on-call. Acad Radiol. 2010;17(7):917–20. doi: 10.1016/j.acra.2010.03.010. [DOI] [PubMed] [Google Scholar]
- 7.Itri JN, Kim W, Scanlon MH. Orion: a web-based application designed to monitor resident and fellow performance on-call. J Digit Imaging. 2011;24(5):897–907. doi: 10.1007/s10278-011-9360-7. [DOI] [PMC free article] [PubMed] [Google Scholar]


