Abstract
The Response Evaluation Criteria in Solid Tumors (RECIST) is the current standard for assessing therapy response in patients with malignant solid tumors; however, volumetric assessments are thought to be more representative of actual tumor size and hence superior in predicting patient outcomes. We segmented all primary and metastatic lesions in 21 chordoma patients for comparison to RECIST. Primary tumors were segmented on MR and validated by a neuroradiologist. Metastatic lesions were segmented on CT and validated by a general radiologist. We estimated times for a research assistant to segment all primary and metastatic chordoma lesions using semi-automated volumetric segmentation tools available within our PACS (v12.0, Carestream, Rochester, NY), as well as time required for radiologists to validate the segmentations. We also report success rates of semi-automatic segmentation in metastatic lesions on CT and time required to export data. Furthermore, we discuss the feasibility of volumetric segmentation workflow in research and clinical settings. The research assistant spent approximately 65 h segmenting 435 lesions in 21 patients. This resulted in 1349 total segmentations (average 2.89 min per lesion) and over 13,000 data points. Combined time for the neuroradiologist and general radiologist to validate segmentations was 45.7 min per patient. Exportation time for all patients totaled only 6 h, providing time-saving opportunities for data managers and oncologists. Perhaps cost-neutral resource reallocation can help acquire volumes paralleling our example workflow. Our results will provide researchers with benchmark resources required for volumetric assessments within PACS and help prepare institutions for future volumetric assessment criteria.
Keywords: Radiology workflow, Segmentation, Clinical oncology, Efficiency, PACS
Introduction
The Response Evaluation Criteria in Solid Tumors (RECIST) [1] is a commonly used standard for assessing therapy response in patients with malignant solid tumors but is becoming outdated with the advent of CT and MR volumetric acquisition and advanced segmentation capabilities. Volumetric assessments of tumor burden by researchers and clinicians will likely become more common as a result.
Studies have suggested that volumetric measurements correlate better with clinical outcomes than one-dimensional measurements [2] in certain tumor types and better reflect actual changes in tumor size [3]. Furthermore, segmentations of intracranial tumors on MR have been found to be reproducible even though their shapes are complex [4]. Categories of image segmentation are described elsewhere [5].
Volumetric assessments are becoming within reach of radiologists’ (and assistants’) workflows with more widespread availability within PACS. For example, semi-automated assessments within PACS have previously shown more consistency than linear measurements in phantoms [6] and in retrospective studies [7]. Some studies support the use of volumetric over 2D assessments [8], as well as the inclusion of volumetric density [9] and texture analysis [10]. Furthermore, assessing all measurable lesions has been shown to decrease variance in tumor burden assessment [11]. While this study specifically addresses feasibility and resources required for volumetric assessment, a parallel study is being conducted to evaluate the usefulness of volumetric assessment compared to RECIST in chordoma patients.
Segmentation of chordoma poses some unique challenges. Chordoma is a rare, slow-growing neoplasm arising from notochord remnants. The primary lesions we segmented on MR were large, lobulated, heterogenous, and often poorly marginated. Sacral lesions were often poorly differentiated from surrounding pelvic structures such as bowel. Clival primary lesions, while often better confined, were also challenging to segment with complex skull base anatomy. As part of another study with 21 chordoma patients in two ongoing phase I clinical trials, a research assistant segmented each primary lesion on MR and every metastatic lesion on CT at every timepoint following baseline imaging. We report times for the research assistant to segment and for a neuroradiologist and general radiologist to verify segmentations on primary and metastatic lesions respectively. We also report the time taken to export all measurement data to Excel® (Microsoft) for analysis since this is currently a necessary and resource-intensive task at our institution.
Methods
Cohort
Baseline and follow-up MR and CT exams on 21 chordoma patients in two ongoing IRB-approved studies were retrospectively analyzed using semi-automatic segmentation tools within our PACS. The number of follow-up appointments for each patient ranged from 2 to 14, with an average of 6.
Imaging
CT scans of chest, abdomen, and pelvis were acquired at baseline (pretreatment) and at 8-week intervals following treatment initiation using any of the following scanners: Siemens definition, biograph or Flash (Siemens Healthcare USA; Malvern, PA), Toshiba Aquillion ONE™ Vision CT (Toshiba MedicalSystems Corporation; Tochigi, Japan), or GE Lightspeed (GE MedicalSystems; Waukesha, WI).
Patients received contrast-enhanced CT scans using 0.6–2.5-mm collimation, 120 kVp, 150–240 reference mAs (with dose modulation), and 0.25–0.75-s rotation time. Images were pushed to our PACS as contiguous 5 × 5 and 2 × 1-mm overlap axial slices for volumetric assessments and reformats (e.g., coronal). Scans were obtained with patients coached to full inspiration, supine from chest to pelvis in one acquisition, and with weight-based (2 mg/kg) i.v. contrast (Isovue 300 at 2 mL/s) after a 70-s delay.
When obtaining MRs, one of the following scanners was used: 3 T Verio (Siemens), 3 T Achieva TX (Philips), 1.5 T Aera (Siemens), 3 T mMR (Siemens), or 1.5 T Achieva (Philips). Patients received TSE T1 axial and coronal imaging, TSE T2 axial and coronal imaging with fat suppression (or STIR), and axial DWIs with B values of 0, 250, and 800. ADC maps were generated from the zero and 800 B values. All pre-contrasted images were acquired at a slice thickness and imaging gap of 6 × 2 mm.
Prior to contrast administration, a pre-contrast 3D axial T1-weighted sequence (3 mm overlapping VIBE/DIXON/or E-Thrive) was obtained in a breath held fashion. Following the injection of intravenous gadolinium-based contrast (0.2 ml/kg, injected at 2 ml/s) (Magnevist®, Schering AG, Berlin, Germany and MultiHance®, Bracco, Milan, Italy), post-contrast images were obtained in identical fashion as the pre-contrast 3D images. Image acquisition timepoints were as follows: 20, 70 s, and a 3-min delay. All data was automatically subtracted from the pre-contrast acquisition. A final post-contrast 3D T1-weighted coronal (3-mm overlapping VIBE/DIXON/or E-Thrive) was obtained at the conclusion of the MR examination.
Volumetric Segmentation
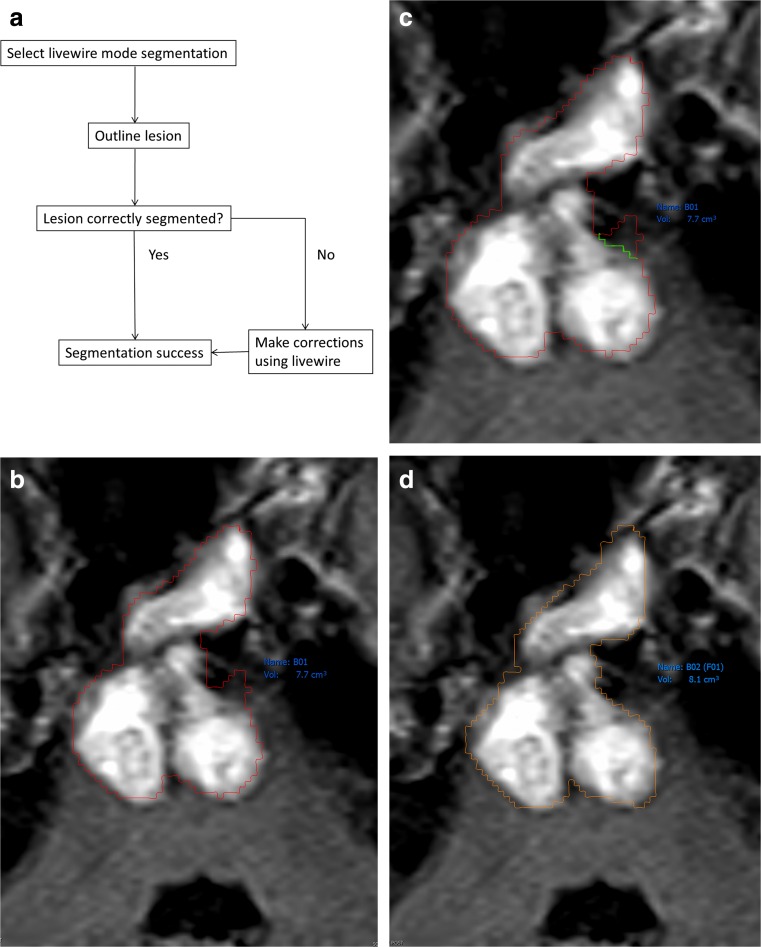
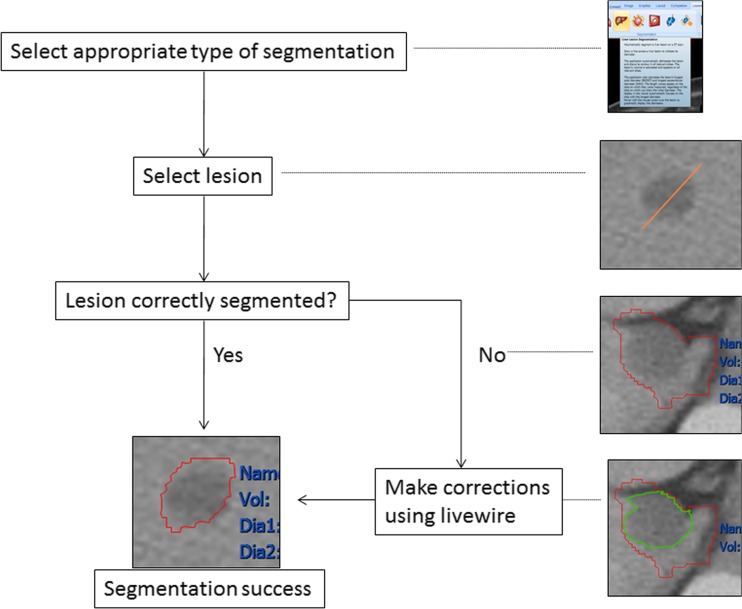
Primary chordoma lesions were volumetrically segmented on MR by a second-year medical student summer research assistant (KF). T2-weighted sequences were most often used for sacral lesions, with STIR and T1-weighted used as second and third choices, respectively; post-contrast FLAIR sequences were used for clival lesions. The inconsistency in MR sequences was due to variable availability of sequences. Using within-PACS technology, lesions could be segmented in several different ways. Automated “lesion tracking” automatically searched for and segmented lesions in new scans based on previous scans from the same patient. Semi-automatic segmentation required the research assistant to click on the lesion, check the segmentation, and make any necessary corrections. Manual segmentation required that the user trace each lesion with the mouse, although slices could intermittently be skipped and the program would “fill in” the missing information. See Figs. 1 and 2 for steps taken to segment lesions and Appendix 1 for more details of the segmentations process we used.
Fig. 1.
Process used to segment lesions on MR. a Flowchart of MR segmentation steps. b Axial FLAIR MR showing a partially enhancing clival lesion involving the pons, outlined in red. Normal brain tissue can be seen in the anterior left pons. c Note the short green contour to correct oversampling seen in Fig. 1b. d Corrected and neuroradiologist verified lesion segmentation
Fig. 2.
Segmentation steps used on CT. This was followed by verifying segmentation borders in consultation with a general radiologist, with fewer corrections needed since metastases were typically less complex than primary lesions. These were also faster to obtain since semi-automatic segmentation tools were more successful for lung, liver, and other soft tissue lesions
Although all patients had surgery and/or radiation, these treatments were most often given before the baseline scans. Changes in tumor volumes were calculated on subsequent scans up through the most recent scans available.
Data Collection and Exportation
Time required for the research assistant to segment all lesions was tracked manually and recorded. Volumetric segmentations of primary lesions were validated by a neuroradiologist (NP) with 30-year experience. All segmented metastatic lesions were verified with a general radiologist (LF) with 20-year experience. Each of these sessions was also manually timed.
Percent semi-automated (“semi” since user visually identifies each lesion) and fully automated segmentation success on follow-up scans [12] was also recorded.
All data was exported to Excel®, and the steps are described in Appendix 2. Over 13,000 individual data points were exported, including the date of each exam, tumor volume, bookmark description, long and short diameters, RECIST diameter, mean volumetric Hounsfield units (on CT only), and percent change from baseline for each of these parameters.
The time required for the exportation process was recorded as well. Our PACS allows for exporting in Annotation Image Markup (AIM) [13]; however, full-featured MHTML was sufficient for our purposes.
Results
The research assistant spent approximately 65 h (including training time) segmenting all lesions primary and metastatic lesions (435 total lesions—37 primary and 398 metastatic) in 21 patients.
We did not use target lesion selection such as five lesions for RECIST 1.1 or ten lesions for 1.0. Instead, we measured volumes for all lesions with greatest diameter 0.5 cm and all lymph nodes with short diameter 1.5 cm. Using these criteria, some patients had over 120 lesions requiring segmentation, although some had as few as one. Since lesions were segmented at multiple timepoints, this resulted in 1349 total segmentations (114 primary and 1235 metastatic).
Primary lesions for this population were found in the sacrum (14 patients, 66.7 %) clivus (6 patients, 28.6 %), and cervical spine (1 patient, 4.8 %). Some patients had multiple sites of primary tumor, likely connected beyond MR and CT resolving power.
Sixteen patients (76.2 %) had metastatic disease, distributed throughout the lung, liver, lymph nodes, and other soft tissue. Most of our patients with metastatic disease had lung lesions (71.4 %). Other common sites of metastases were liver (57.1 %), lymph nodes (28.6 %), and other soft tissue (50.0 %).
Average time to segment each lesion was 2.89 min, although this was highly variable (5 s–2 h). While semi-automatic segmentations allowed small lung and liver lesions to be segmented on CT in seconds, larger primary tumors took up to 2 h to be segmented on MR.
The research assistant and neuroradiologist consultation time to verify and correct segmentations averaged 44.3 min per patient and 12.9 min per segmentation. Because of the difficulty of segmenting on MR, the neuroradiologist checked the most recent scan and the baseline scan and addressed problems with other follow-up cases as they arose. A review of all scans obtained (using a variety of sequences both before and after contrast) was performed on the baseline and the most recent scans. This review showed that the most appropriate sequences to best appreciate the borders of the tumor were the fat suppressed T2-weighted sequences and STIR. It was also found that the post-contrast scans were not as valuable as expected due to prior radiation and surgical treatments and the subsequent development of scarring at the tumor bed. This scarring resulted in poor enhancement and definition of borders from adjacent structures.
Time to verify metastatic disease on CT with a general radiologist was 1.4 min per scan. Advanced segmentation capabilities on CT with less anatomical complexity involved in metastatic disease (relative to primary lesions) allowed the general radiologist to verify only the most recent scan; the research assistant made corrections to older scans accordingly, with periodic review of select lesions. Average time required to segment, verify, and export data for each lesion can be found in Table 1.
Table 1.
Summary of time required to segment, verify, and export data for each patient and lesion
| Avg time required per patient | Avg time required per segmentation | |
|---|---|---|
| Initial segmentation | 3.09 h | 2.89 min |
| MR verification | 44.3 min | 12.9 min |
| CT verification | 1.4 min | 4.5 s |
| Exportation of data | 17.1 min | 0.3 s |
Semi-automation percent success was similar to prior studies [9], 93.5 % (317/339 lesions) for lung and 75.7 % (28/37 lesions) for liver. Successful semi-automation consisted of the application estimating the borders of the lesion, although corrections sometimes still had to be made. Other metastatic lesions, as well as primary lesions, were done by hand. Fully automated segmentation (i.e., lesion tracking from one follow-up appointment to the next) is also available within our PACS, and the success rate for this type of segmentation on CT was 80.4 % (238/296) for lung lesions and 81.8 % (9/11) for liver lesions. When lesion tracking was used on PET CT, the success rate dropped to 47.1 % (105/223) in lung.
It is important to note that the exportation of over 13,000 data points for 21 patients took only 6 h, which represents a potential time-saving opportunity in data management.
Discussion
We report the time taken to obtain volumetric assessments in a cohort of 21 chordoma patients with metastatic lesions using semi-automation tools within our PACS. Volumetric segmentation of fimbriated or irregularly shaped lesions on MR was more difficult and hence time-consuming. Time required to segment lung and liver lesions was much less due to higher success in automated segmentations on CT. This is not to say that these types of segmentations are without challenges; chordoma liver metastases resemble cysts [14] and lung lesions can easily mimic or be masked by atelectasis, scarring, or other abnormalities. However, we believe that segmentation of metastatic lesions on CT may be within reach for radiologists, particularly for isolated lesions where visual contrast with surrounding tissue is stark.
We report distributions of metastatic sites that are similar to those found in past studies [14], although we were unable to accurately segment bone lesions in this study. Metastatic lesions often resembled the primary lesions, similar to prior studies [14–16].
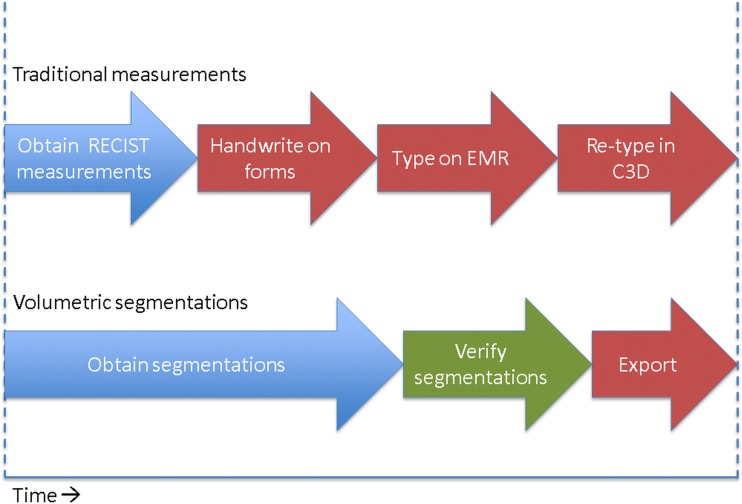
Data export and analysis in cancer research typically involves measurements being handwritten and retyped into Cancer Centralized Clinical Database (C3D [17]) or another database, then being transferred to a central database. Our method involves direct exportation of data, which has the potential to both save time and reduce the number of transfer errors made when recording data (Fig. 3). While the details of the data collection process may be specific to our institution, we believe that rapid exportation of large quantities of 3D data is generally an improvement on older methods that provide only one metric for each lesion and often take longer to record and export. It has been shown that automated measurement population into reporting is more efficient with fewer errors [18].
Fig. 3.
A schematic comparison of volumetric assessments to traditional tumor assessments that involve one-dimensional measurements, handwriting on paper forms, and typing and retyping data. Although significantly more time is needed to segment lesions, there may be an opportunity for a cost-neutral workflow, where resources saved in data management may be shifted to the time-intensive process of volumetric segmentation
Segmenting all lesions by the research assistant was time-intensive, which was expected with our current within-PACS technology. While volumetric assessments remain time-consuming and perhaps too laborious for radiologists to perform routinely, we believe that technological advances will soon assist radiologists and oncologists in assessing metastatic disease more accurately. Our workflow included a research assistant funded outside of radiology; perhaps similar workflows would allow for cost-neutral solutions that would save time in data management. We also believe that by recording radiologists’ verification time, we are able to put potential workflow reality into perspective as automation continues to evolve. Although not specifically timed or compared, the average times to perform 2D assessments are similar to our initial interpretation times (10–20 min). The volumetric validation times were at least double this but may not be unreasonable for some research institutions.
Volumetric segmentation allows for 3D visualization of patient data, which may have tremendous implications for clinicians, researchers, and patients. Within PACS, we are able to create 3D renderings of primary lesions from any perspective to better visualize tumor size and encroachment on surrounding anatomy (Fig. 4). Additionally, we are able to create color-coded multiplanar volume rendered (MVPR) diagrams that allow us to identify the extent and location of metastatic disease at a glance (Fig. 5). Example images and post-processed rendered reformats can be exported into our multimedia radiologist reports which also include graphs, tables, and hyperlinks from the report to select image annotations.
Fig. 4.
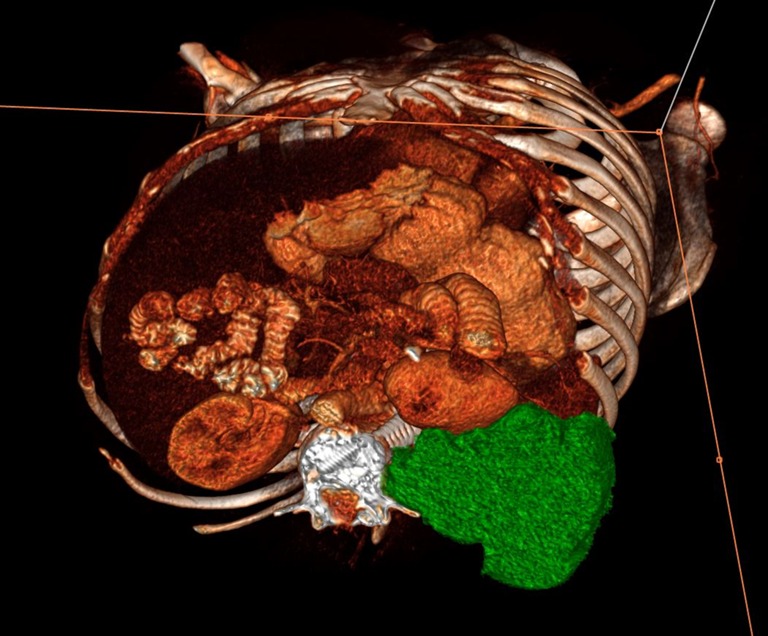
Example of a 3D volume rendered image illustrating mid-section axial of a large primary chordoma lesion (green) displacing the left kidney anteriorly. Post-processed images such as these can be exported to the radiologist report and linked to the report with hyperlinked text
Fig. 5.
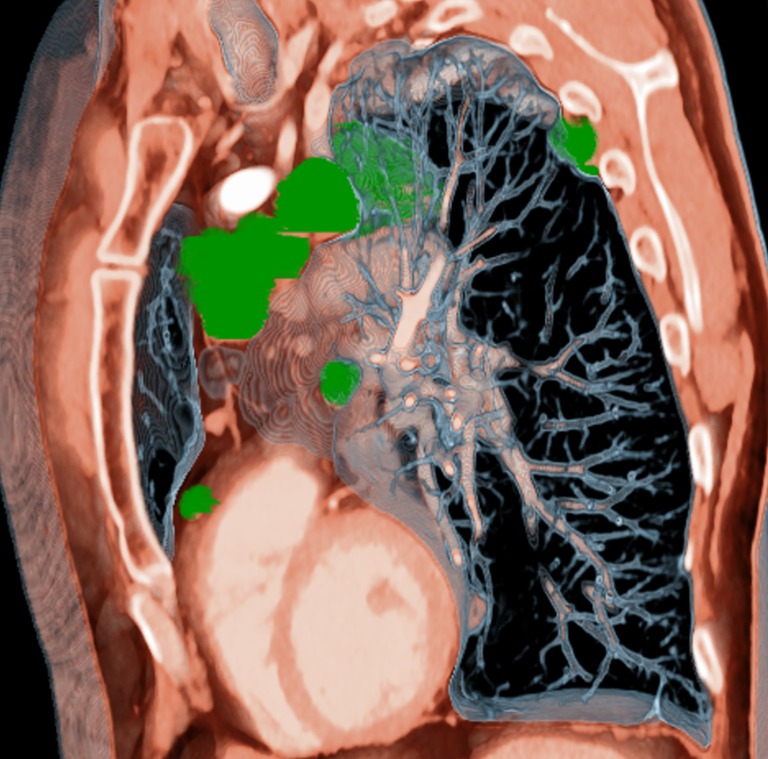
An example of an MPVR parasagittal reformat illustrating the distribution of metastases along the mediastinum, heart, and pleural wall
There are some advantages to linear measurements, such as simplicity and availability. In some circumstances, they have also been shown to correlate well with volumes [19]. However, volumetric measurement may be worth the additional resources for certain types of cancer with irregular borders and close proximity to physiologically and clinically important structures. It should also be kept in mind that many cancers would not require segmentation of primary sites since these are often surgically removed or irradiated. Additionally, if fewer than all lesions are found to be sufficiently representative of the extent of the disease (such as five target lesions in RECIST 1.1), times to segment and validate will be much shorter.
Limitations
Borders of chordoma lesions are especially difficult to distinguish; however, we believe that minor misestimations of the borders did not drastically distort our volume data. Poorly marginated lesions were especially problematic when segmenting on anisotropic MR, where volumetric assessments are limited. All patients also underwent surgery and/or radiation therapy, which distorted primary tumor borders and resulted in needing more time than would otherwise be necessary to perform segmentations. Timing segmentations manually may also be less reproducible and have a greater margin of error than automated timing; automated timing was not available within our PACS. Finally, while the 65 h required for the research assistant to segment each lesion included “training” time (i.e., the time spent becoming familiar with the tools and segmenting the first few lesions), the segmentation process is actually relatively simple, and maximal efficiency was achieved after several hours of practice. Therefore, we do not believe that the inclusion of training time drastically distorted time required to segment lesions.
Since we chose not to segment metastatic lesions with longest diameter less than 0.5 cm, we did not account for total disease burden. However, taking all measureable lesions into account is still more comprehensive than current assessment criteria that only assess five to ten lesions [11].
It was occasionally difficult to distinguish between lung masses and atelectasis and not possible to truly know which tumors were metastatic chordoma. However, none of the 21 patients were known to have any other type of cancer.
Summary
We present time and resources required to segment, verify, and export data of over 1000 segmentations and 13,000 data points in 21 metastatic chordoma patients. Although volumetric segmentations are expectedly time-consuming (at least twice that of 2D measurements), it should be kept in mind that if volumetric assessments are shown to be superior to 2D measurements in the future, our results provide a current benchmark of the required resources within PACS.
Additionally, our example workflow with a funded assistant outside the radiology department may provide a cost-neutral alternative to current processes. Although segmentation is more time-intensive than 2D measurements, our workflow (outlined in Fig. 3) provides other opportunities for efficiency and accuracy. For example, our direct exportation times are likely much faster than current systems for 2D measurement data, at least at our institution. We believe that negating the need to handwrite measurements by using direct exportation should not only save time but more importantly result in fewer transfer errors.
With continual automation improvements within PACS, we believe that volumetric assessments in radiologist workflows, especially with assistance, will soon be within reach.
Acknowledgments
Supported by Intramural Research Program, National Institutes of Health Clinical Center. The content is solely the responsibility of the authors and does not necessarily represent the official views of the National Institutes of Health.
Appendix 1
Segmentation on MR (Fig. 1):
Select livewire mode segmentation tool
Begin outlining the borders of the tumor. The border will appear in green.
Complete the outline and left click. The border will turn orange.
Click “accept lesion.” The outline will turn red, and the volume will be displayed in blue.
If corrections are necessary, right click on the segmentation and click “correct with livewire.”
Outline correct borders. Once the segmentation is correct, click “accept lesion.”
Segmentation on CT (Fig. 2):
Select the appropriate segmentation tool (lung, liver, lymph node, or general) under the “lesions” tab.
Select the lesion by clicking on it (lung) or drawing a line across its longest diameter (liver, lymph node, general).
Lesion will be outlined in red, and volume will appear in blue. If corrections need to be made, right click on lesion and select “correct with livewire.”
Trace the correct borders using the livewire tool.
Left click and borders will turn orange.
If the segmentation is satisfactory, click “accept lesion.”
Appendix 2: how to export the data for one patient
Open up most recent MR
Open bookmarks window
Select appropriate baseline date
Click the report button on the lower right
On report, click “export report” and select full featured editor format (MHTML)
Paste into Excel.
Delete non-volumetric measurements, measurements that do not meet size requirements, and lesions that were “MISSING” at baseline by hand.
Close the report. Reopen the report, this time using the first follow-up appointment as “baseline.”
Copy and paste data for any new lesions from the first follow-up appointment (i.e., ones that were not there at baseline) into Excel. This ensures that the computer calculates the % change from the first time the lesion appeared.
Repeat for every follow-up appointment at which new lesions appeared.
Repeat steps 1–10 for the patient’s CT scans.
Compliance with ethical standards
Conflict of interest
Dr. Folio manages a corporate research agreement with Carestream Health, the PACS used in this study.
Funding
Clinical trial numbers NCT01519817 and NCT02179515.
Contributor Information
Kathleen E. Fenerty, Phone: 317-656-9776, Email: kfenerty@iupui.edu
Nicholas J. Patronas, Email: npatronas@cc.nih.gov
Christopher R. Heery, Email: heerycr@mail.nih.gov
James L. Gulley, Email: gulleyj@mail.nih.gov
Les R. Folio, Email: les.folio@nih.gov
References
- 1.Eisenhaur EA, Therasse P, Bogaerts J, Schwartz LH, Sargent D, Ford R, Dancey J, Arbuck S, Gwyther S, Mooney M, Rubinstein L, Shankar L, Dodd L, Kaplan R, Laombe D, Verweij J. New response evaluation criteria in solid tumors: revised RECIST guideline (version 1.1) Eur J Cancer. 2009;45:228–247. doi: 10.1016/j.ejca.2008.10.026. [DOI] [PubMed] [Google Scholar]
- 2.Bradley JD, Ieumwananonthachai N, Purdy JA, et al. Gross tumor volume, critical prognostic factor in patients treated with three-dimensional conformal radiation therapy for non-small-cell lung carcinoma. Int J Radiat Oncol Biol Phys. 2002;52(1):49–57. doi: 10.1016/S0360-3016(01)01772-2. [DOI] [PubMed] [Google Scholar]
- 3.Bornemann L, Kuhnigk JM, Dicken V, et al. New tools for computer assistance in thoracic CT. II. Therapy monitoring of pulmonary metastases. RadioGraphics. 2005;25(3):841–848. doi: 10.1148/rg.253045163. [DOI] [PubMed] [Google Scholar]
- 4.Solomon J, Warren K, Dombi E, Patronas N, Widemann B. Automated detection and volume measurement of plexiform neurofibromas in neurofibromatosis 1 using magnetic resonance imaging. Comput Med Imaging Graph. 2004;28:257–265. doi: 10.1016/j.compmedimag.2004.03.002. [DOI] [PubMed] [Google Scholar]
- 5.Mansoor A, Bagci U, Foster B, Xu Z, Folio LR, Udupa JK, Mollura DJ: Segmentation and image analysis of abnormal lungs in computed tomography: current approaches, challenges, and future trends. Radiographics (in press) [DOI] [PMC free article] [PubMed]
- 6.Huang J, Sandouk A, Folio LR: Accuracy of volumes in a phantom serial CT imaging. RSNA formal scientific presentation. 2012
- 7.Folio LR, Sandouk A, Huang J, Solomon JM, Apolo AB. Consistency and efficiency of CT analysis of metastatic disease: semiautomated lesion management application within a PACS. AJR Am J Roentgenol. 2013;201(3):618–25. doi: 10.2214/AJR.12.10136. [DOI] [PMC free article] [PubMed] [Google Scholar]
- 8.Lee YH, Hsia CY, Hsu CY, Huang YH, Lin HC, Huo TI. Total tumor volume is a better marker of tumor burden in hepatocellular carcinoma defined by the Milan criteria. World J Surg. 2013;37(6):1348–55. doi: 10.1007/s00268-013-1978-9. [DOI] [PubMed] [Google Scholar]
- 9.Folio L, Turkbey E, Steinberg S, Apolo A: Viable tumor volume: volume of interest within segmented metastatic lesions, a pilot study of proposed computed tomography response criteria for urothelial cancer. EJR (in press) [DOI] [PMC free article] [PubMed]
- 10.Goh V, Ganeshan B, Nathan P, et al. Assessment of response to tyrosine kinase inhibitors in metastatic renal cell cancer: CT texture as a predictive biomarker. Radiology. 2011;261:165–171. doi: 10.1148/radiol.11110264. [DOI] [PubMed] [Google Scholar]
- 11.Schwartz LH, Mazumdar M, Brown W, Smith A, Panicek DM. Variability in response assessment in solid tumors: effect of number of lesions chosen for measurement. Clin Cancer Res. 2003;9:4318–4323. [PubMed] [Google Scholar]
- 12.Folio LR, Choi MM, Solomon JM, Schaub NP. Automated registration, segmentation, and measurement of metastatic melanoma tumors in serial CT scans. Acad Radiol. 2013;20:604–613. doi: 10.1016/j.acra.2012.12.013. [DOI] [PubMed] [Google Scholar]
- 13.Abajian AC, Mia L, Rubin DL. Informatics in radiology: improving clinical work flow through an aim database: a sample web-based lesion tracking application. Radiographics. 2012;32(5):1543–52. doi: 10.1148/rg.325115752. [DOI] [PMC free article] [PubMed] [Google Scholar]
- 14.Kishimoto R, Omatsu T, Hasegawa A, Imai R, Kandatsu S, Kamada T. Imaging characteristics of metastatic chordoma. Jpn J Radiol. 2012;30:509–516. doi: 10.1007/s11604-012-0086-3. [DOI] [PubMed] [Google Scholar]
- 15.Rosenthal DI, Scott JA, Mankin HJ, Wismer GL, Brady TJ. Sacrococcygeal chordoma: magnetic resonance imaging and computed tomography. AJR. 1985;145(1):143–7. doi: 10.2214/ajr.145.1.143. [DOI] [PubMed] [Google Scholar]
- 16.Sze G, Uichanco LS, 3rd, Brant-Zawadzki MN, Davis RL, Gutin PH, Wilson CB, et al. Chordomas: MR imaging. Radiology. 1988;166:187–91. doi: 10.1148/radiology.166.1.3336677. [DOI] [PubMed] [Google Scholar]
- 17.NCI Cancer Centralized Clinical Database. http://ncicb.nci.nih.gov/support/c3dsupport. Last accessed 20 July, 2015
- 18.Sevenster M, Travis AR, Ganesh RK, Liu P, Kose U, Peters J, Chang PJ. Improved efficiency in clinical workflow of reporting measured oncology lesions via PACS-integrated lesion tracking tool. AJR Am J Roentgenol. 2015;204(3):576–83. doi: 10.2214/AJR.14.12915. [DOI] [PubMed] [Google Scholar]
- 19.Shah GD, Kesari S, Xu R, Batchelor TT, O’Neill AM, Hochberg FH, Levy B, Bradshaw J, Wen PY. Comparison of linear and volumetric criteria in assessing tumor response in adult high-grade gliomas. Neuro Oncol. 2006;8:38–46. doi: 10.1215/S1522851705000529. [DOI] [PMC free article] [PubMed] [Google Scholar]


