



Abstract
Tonic inhibition was imaged in cerebellar granule cells of transgenic mice expressing the optogenetic chloride indicator, Clomeleon. Blockade of GABAA receptors substantially reduced chloride concentration in granule cells due to block of tonic inhibition. This indicates that tonic inhibition is a significant contributor to the resting chloride concentration of these cells. Tonic inhibition was observed not only in granule cell bodies, but also in their axons, the parallel fibers (PFs). This presynaptic tonic inhibition could be observed in slices both at room and physiological temperatures, as well as in vivo, and has many of the same properties as tonic inhibition measured in granule cell bodies. GABA application revealed that PFs possess at least two types of GABAA receptor: one high-affinity receptor that is activated by ambient GABA and causes a chloride influx that mediates tonic inhibition, and a second with a low affinity for GABA that causes a chloride efflux that excites PFs. Presynaptic tonic inhibition regulates glutamate release from PFs because GABAA receptor blockade enhanced both the frequency of spontaneous EPSCs and the amplitude of evoked EPSCs at the PF-Purkinje cell synapse. We conclude that tonic inhibition of PFs could play an important role in regulating information flow though cerebellar synaptic circuits. Such cross talk between phasic and tonic signaling could be a general mechanism for fine tuning of synaptic circuits.
SIGNIFICANCE STATEMENT This paper demonstrates that an unconventional form of signaling, known as tonic inhibition, is found in presynaptic terminals and affects conventional synaptic communication. Our results establish the basic characteristics and mechanisms of presynaptic tonic inhibition and show that it occurs in vivo as well as in isolated brain tissue.
Keywords: cerebellum, chloride, GABA, imaging, parallel fibers, tonic inhibition
Introduction
In addition to the well-established role of GABA in conventional, phasic synaptic inhibition, this neurotransmitter also participates in a tonic form of inhibition (Mody and Pearce, 2004; Farrant and Nusser, 2005). Tonic inhibition arises from constant activation of GABAA receptors and has been studied most extensively in cerebellar granule cells, where it is the predominant form of inhibition (Kaneda et al., 1995; Brickley et al., 1996, 2001; Hamann et al., 2002; Rossi et al., 2003) and has been proposed to arise at least partially from channel-mediated release of GABA from glia (Lee et al., 2010). Although tonic inhibition has been studied mainly in slices, it is not a consequence of the slicing procedure because it has been observed in vivo in both cerebellar (Chadderton et al., 2004) and olfactory (Labarrera et al., 2013) granule cells. Tonic inhibition controls the gain and excitability of cerebellar granule cells (Mitchell and Silver, 2003), and at least some of the behavioral effects of ethanol consumption may arise from augmentation of tonic inhibition (Wallner et al., 2003; Hanchar et al., 2005).
Our current understanding of tonic inhibition is largely based on electrophysiological measurements of GABA-induced chloride currents. While such measurements offer very high sensitivity, they provide minimal spatial information. Thus, although it is clear that currents produced by tonic inhibition can be detected from recordings from the cell bodies of several types of neurons, it is rarely known which cellular compartments actually receive tonic inhibition. Here we use Clomeleon, an optogenetic fluorescent chloride indicator (Kuner and Augustine, 2000), to image the spatial extent of tonic inhibition of cerebellar granule cells. We have taken advantage of transgenic mice that express Clomeleon in various subsets of neurons (Berglund et al., 2006); these mice have enabled imaging of local changes in intracellular chloride concentration ([Cl−]i) associated with phasic synaptic inhibition (Berglund et al., 2006, 2008), heterogeneity of [Cl−]i and GABA responses in different compartments of retinal neurons (Duebel et al., 2006), and [Cl−]i increases in hippocampal neurons associated with both ischemia (Pond et al., 2006) and seizure activity (Glykys et al., 2009; Dzhala et al., 2010, 2012; Lillis et al., 2012; Glykys et al., 2014).
Our results follow-up on a preliminary report indicating that Clomeleon imaging allows visualization of tonic inhibition (Lee et al., 2010) and demonstrate that tonic inhibition approximately doubles resting [Cl−]i in cerebellar granule cells. Remarkably, tonic inhibition occurs not only on granule cell bodies (GCBs) and dendrites, but also on their axons, the parallel fibers (PFs). Tonic inhibition of PFs was observed in vivo and reduces both spontaneous and evoked release of glutamate from PF presynaptic terminals. Thus, presynaptic tonic inhibition may serve as an important regulator of information flow through the synaptic circuits of the cerebellar cortex. Given that somatic tonic inhibition is found throughout the brain, presynaptic tonic inhibition may also be a general mechanism for regulating neurotransmitter release during phasic synaptic transmission.
Materials and Methods
Immunohistochemistry.
Immunohistochemistry was used to determine the pattern of Clomeleon expression in the cerebellum. In brief, anesthetized CLM1 transgenic mice (Berglund et al., 2006; The Jackson Laboratory, RRID: IMSR_JAX:013161) were transcardially perfused with phosphate-buffered saline (PBS) containing (in mm) as follows: 137 NaCl, 2.7 KCl, 10 NaH2PO4, and 1.8 KH2PO4 (pH 7.4 with HCl), then with a PBS solution containing 4% paraformaldehyde (PFA). Brain tissue was then removed and postfixed overnight in 4% PFA solution at 4°C. For subsequent cryoprotection, tissue was kept overnight in PBS solutions containing graded concentrations of sucrose ranging from 10%–30% (w/v). A freezing microtome (CM 3050S, Leica) was used to cut the brain, including cerebellum, into 20-μm-thick parasagittal sections. Sections were initially washed in 0.1 m PBS followed by blocking buffer (2% normal goat serum and 0.1% Triton X-100), and then incubated with anti-metabotropic glutamate receptor 2 (mGluR2) rabbit primary antibody (1:250, Abcam) and anti-YFP chicken primary antibody (1:1000, Abcam) for 48 h at 4°C. Sections were then further incubated with anti-rabbit Alexa-594 (1:500, Invitrogen) and anti-chicken Alexa-488 (1:500, Invitrogen) secondary antibodies. These incubations were performed at room temperature in the blocking buffer, followed by a rinse with PBS. Finally, sections were mounted with antifade reagent (ProLong Gold, Invitrogen) and coverslipped for confocal imaging. To identify the cell bodies of molecular layer (ML) interneurons, a subset of brain sections were immunostained with the anti-YFP primary antibody, followed by anti-chicken Alexa-488 secondary antibody and then stained with DAPI (Invitrogen).
Slice preparation.
Cerebellar slices were prepared, using conventional methods (Tanaka et al., 2007), from 2- to 8-week-old homozygous CLM1 mice of either sex. In brief, the mice were anesthetized, and their brains were isolated and then placed in cold artificial cerebrospinal fluid (ACSF), containing the following (in mm): 125 NaCl, 2.5 KCl, 1.25 NaH2PO4, 26 NaHCO3, 20 d(+)-glucose, 2 CaCl2, and 1.3 MgCl2 (pH 7.4 after bubbling with 95% O2/5% CO2, v/v). A vibratome was used to make 200-μm-thick slices; usually these were cut in the sagittal plane. The slices were then incubated at 36°C for 30 min before use.
Microscopy.
Most Clomeleon imaging was done with a wide-field fluorescent microscope, as described by Berglund et al. (2006). For this purpose, an upright epifluorescence microscope (E600-FN, Nikon) was equipped with a 10 × 0.3 NA objective for the Clomeleon imaging experiments or with a 40 × 0.8 NA water-immersion objective for the electrophysiological experiments. This microscope included in its excitation pathway a mercury arc lamp, an electronic shutter (Uniblitz), an excitation filter (440 ± 10 nm), and a dichroic mirror (460 nm); the emission pathway included a filter wheel (Ludl Electronic Products) that alternated between two emission filters (485 ± 15 nm for CFP and 530 ± 15 nm for YFP; 71007a Cameleons 2, Chroma). Fluorescence excitation was produced by light pulses (200–500 duration, 0.5 Hz), and fluorescence emission was alternately collected at each wavelength with a back-illuminated, cooled CCD camera with on-chip multiplication gain control (Cascade 512B, Photometrics). Image acquisition was controlled by RatioTool software (ISee Imaging Systems) and a PowerMac G4 (Apple Computer). Further details of the imaging system can be found in Berglund et al. (2006).
To measure Clomeleon fluorescence in the granule cell and MLs, two ROIs covering these layers were defined. The intensity of YFP fluorescence, corrected for detector dark current and other sources of background signal, was divided by that of CFP to calculate a ratio in each ROI that is inversely proportional to [Cl−] (Kuner and Augustine, 2000). Autofluorescence accounted for <1.5% of the total fluorescence and did not have any significant effect on the calculated ratio (Pond et al., 2006). Photobleaching (Berglund et al., 2005; Friedel et al., 2013) was minimized by using a low level of excitation light, with neutral density filters used to attenuate excitation light from the mercury lamp >500-fold. Because of the low levels of fluorescence emission under these conditions, pixels on the CCD camera chip were sometimes binned by a factor of 2 to increase signal/noise. If any obvious trend due to photobleaching remained, it was corrected by fitting a regression line or an exponential function to traces measured in the absence of responses.
For experiments where GABA or GABA receptor antagonists were locally applied (see Figs. 7, 8), images were produced by averaging raw images over 3 or 4 trials and smoothed by a Gaussian filter (20 μm) twice before calculating the fluorescence emission ratio. Such ratio images were then converted into [Cl−]. All the image processing, analysis, and statistical tests were done by IgorPro 6.1 (WaveMetrics).
Figure 7.
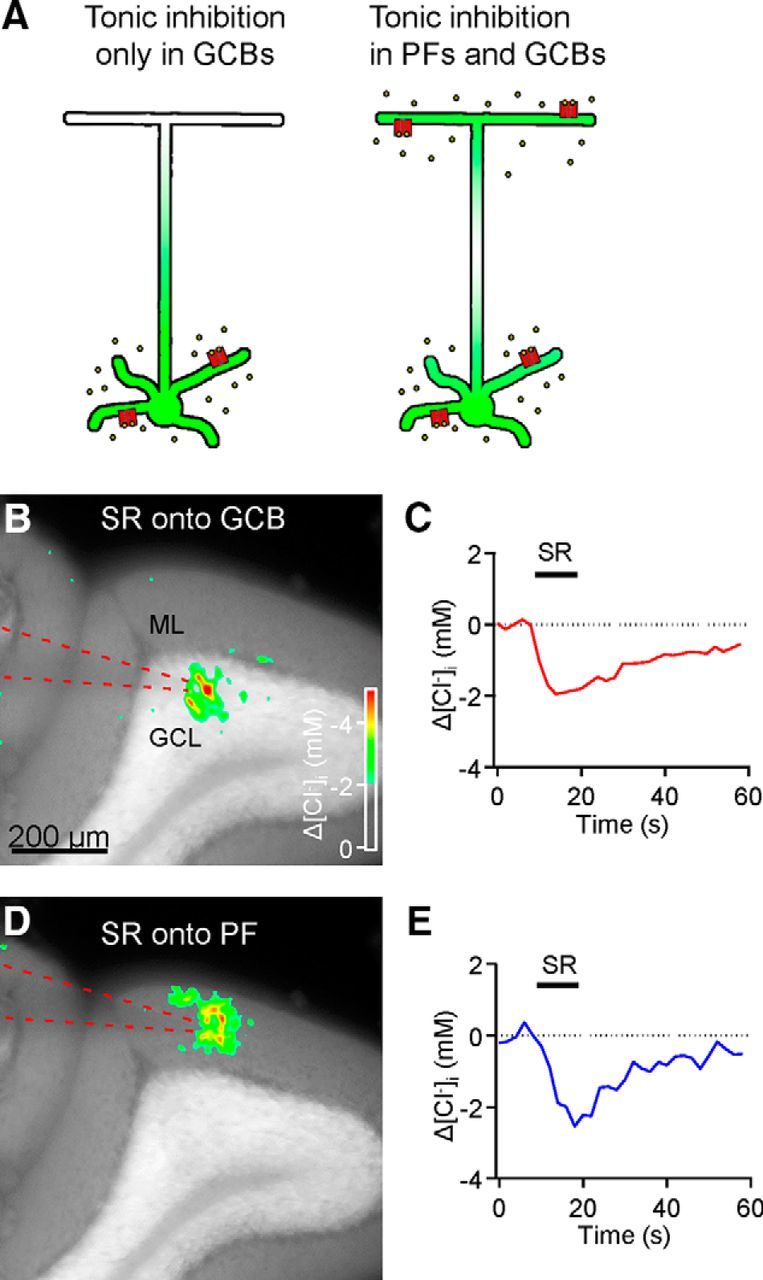
Tonic activation of GABAA receptors on PFs. A, Two possible models for tonic inhibition of PFs in granule cells. Left, [Cl−]i in PFs may be raised by diffusion of Cl− that enters via GABAA receptors in GCBs/dendrites. Right, PFs may have GABAA receptors that are tonically active. B, [Cl−]i response to SR (100 μm for 10 s) locally applied from a puff pipette (dotted lines) onto GCBs. C, Time course of the response shown in B. A transient decrease in [Cl−]i was produced in GCBs near the pipette. D, Response to SR application onto PFs. E, Time course of the response shown in D. A similar transient reduction in [Cl−]i was produced in PFs near the pipette in response to SR.
Figure 8.

Depolarizing action of GABA on PFs. A, Reduction in [Cl−]i in PFs produced by GABA (1 mm for 500 ms) locally applied from a pipette (dotted lines) onto the ML. B, Time course of the response shown in A. C, Local application of GABA onto the GCL elevated [Cl−]i in GCBs. D, Time course of the response shown in C.
The measurements shown in Figures 2, 6, and 10 were done with 2-photon imaging, using either an Ultima IV microscope (Prairie Technologies) or an Olympus FV1000 microscope. Clomeleon was excited using 860 nm excitation light (Berglund et al., 2011) and either a 25 × or 40 × water-immersion objective (Olympus) with total output power <50 mW. A fluorescence filter cube with an emission beamsplitter (71007, Chroma) was used for fluorescence emission. During imaging, 512 × 512 pixel images were acquired continuously every 30 s, with 4 images averaged to yield the results shown.
Figure 2.
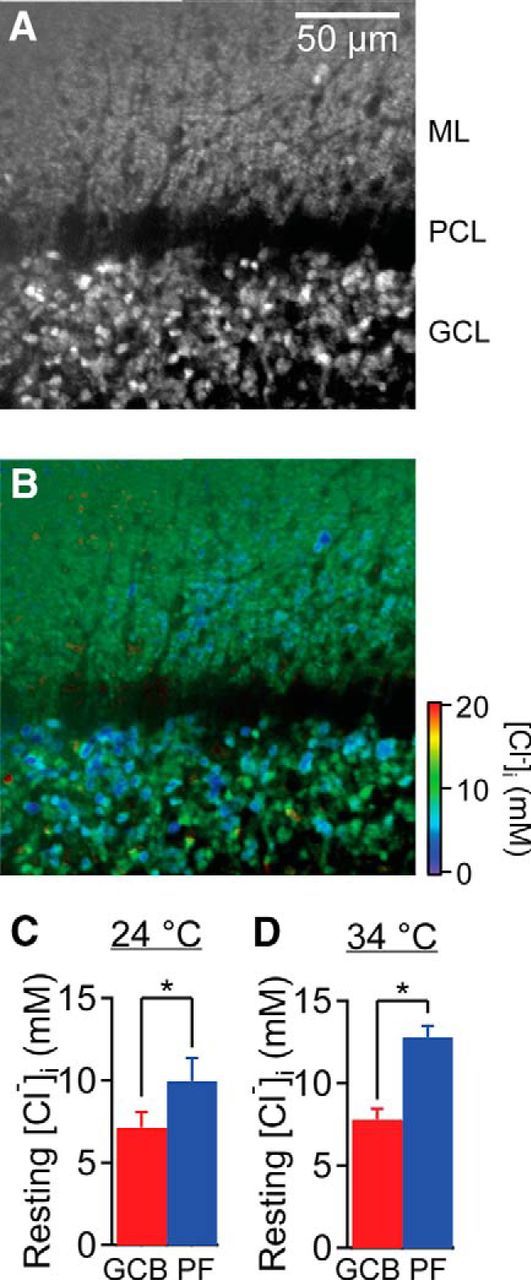
Measuring [Cl−]i in granule cells via 2-photon microscopy. A, An image of YFP fluorescence in the cerebellar cortex. B, Resting [Cl−]i of granule cells, determined from the ratio of YFP/CFP fluorescence emission. C, Mean resting [Cl−]i in GCBs and PFs. Error bars indicate SEM in this and subsequent figures (n = 24). D, Mean resting [Cl−]i of granule cells at more physiological temperature (n = 7). *p = 0.016 (two-tailed Wilcoxon paired-sample test).
Figure 6.

Tonic inhibition in vivo. A, Diagram of experimental arrangement for in vivo imaging experiment. Red line indicates a representative focal plane when imaging [Cl−]i in the fourth and fifth lobule of the cerebellum (4 and 5). B, Two-photon microscopy image of YFP fluorescence obtained from the location shown in A. C, D, Time courses of [Cl−]i changes in response to subcutaneous injection of SR (5 mg/kg body weight). C, D, Obtained in GCBs and PFs, respectively. E, F, Time courses of [Cl−]i changes in response to topical application of SR (2 mm). E, [Cl−]i changes in GCB. F, [Cl−]i changes in PFs. G, Mean changes in resting [Cl−]i produced by SR application (n = 7; combined results of topical and subcutaneous applications).
Figure 10.

Tonic inhibition requires HCO3−. A, Measurement of pH changes in PFs during HCO3− removal (acetazolamide [AZA]/HEPES/no CO2). B, HCO3− removal reduced intracellular pH in PFs significantly. *p = 0.028. C, [Cl−]i changes in PFs during HCO3− removal. D, HCO3− removal reduced resting [Cl−]i significantly. *p = 0.0008. E, Reduction in [Cl−]i in PFs caused by SR treatment disappeared in the absence of HCO3−. *p < 0.05.
Calibration of Clomeleon.
The Clomeleon fluorescence emission ratio (YFP/CFP) was converted into [Cl−]i as detailed by Kuner and Augustine (2000) and Berglund et al. (2009). In brief, [Cl−]i was calculated based on the following equation:
 |
where R is the measured emission ratio, Rmin and Rmax represent the values of R when Clomeleon is either Cl− bound (Rmin) or Cl− free (Rmax), and Kd′ is the effective Cl− dissociation constant of Clomeleon (Grimley et al., 2013). The calibration constants (Rmin = 0.85, Rmax = 3.08, and Kd′ = 144 mm for GCBs, and Rmin = 0.82, Rmax = 2.92, and Kd′ = 175 mm for PFs) were determined in situ using solutions of F−, gluconate, and two known concentrations of Cl− (50 and 134 mm), respectively, at pH 7.1. F− solution contained the following (in mm): 89 KF, 7 N-methyl-d-glucamine (NMDG), 7 HF, 1.25 NaH2PO4, 16 KHCO3, 20 d(+)-glucose, 2 EGTA, and 5 NaOH. Gluconate solution contained the following (in mm): 45 NMDG, 45 d-gluconic acid, 92 K-gluconate, 1.25 NaH2PO4, 13 KHCO3, 20 d(+)-glucose, 2 EGTA, 5 NaOH, and 3.3 Mg-gluconate2. 134 mm Cl− solution contained the following (in mm): 45 NMDG, 45 HCl, 1.25 NaH2PO4, 15 KHCO3, 20 d(+)-glucose, 2 EGTA, 5 NaOH, and 3.3 Mg-gluconate2; 50 mm Cl− solution was obtained by mixing appropriate proportions of gluconate and 134 mm Cl− solutions. The Cl−/OH− antiporter tributyltin acetate (20 μm) and the K+/H+ ionophore nigericin (20 μm) were first dissolved in ethanol and then diluted into solutions to remove the Cl− and H+/OH− gradients, respectively.
Measurement of intracellular pH.
A stock solution of SNARF-5F AM ester (2 mm; Invitrogen) in Pluronic F-127 (20% w/v solution in DMSO; Invitrogen) was added to an oxygenated ACSF at a final concentration of 4–20 μm. After incubation at 36°C, cerebellar slices from C57BL/6 wild-type mice were exposed to the SNARF-5F AM solution for 30–60 min and washed in oxygenated ACSF for at least 15 min at room temperature. Slices loaded with SNARF-5F were then imaged as described above, except for an excitation filter (540.5 ± 12.5 nm), a dichroic mirror (565 nm cutoff), and emission filters (580 ± 12.5 and 630 ± 30 nm). SNARF-5F emission ratio (630/580) was calibrated in vitro, as described previously (Pond et al., 2006), by using the following equation:
 |
where R is the measured 630/580 nm emission ratio, Rmin and Rmax represent the values when SNARF-5F is either H+ bound or H+ free, respectively, and Kd is the effective H+ dissociation constant of SNARF-5F.
The Kd of Clomeleon was then corrected for measured pH changes by using the following equation:
 |
where Kd is Cl− dissociation constant of Clomeleon obtained at pH 7.10 described above and Kd′ is pH-corrected Cl− dissociation constant at any given pH (pH′) measured by SNARF-5F.
In vivo imaging.
Clomeleon transgenic mice (age 5–10 weeks) initially were anesthetized with intraperitoneal injection of ketamine (100 mg/kg) and xylazine (10 mg/kg). Their heads were shaved and the mice were then placed in a stereotaxic head frame. Isoflurane gas (2%) in oxygen was administered throughout the experiments, and the electrocardiogram was measured continuously to monitor the physiological status of the mice. Body temperature was measured by a rectal probe and maintained at 38°C by a feedback-controlled heating pad. Before making an incision, droplets of bupivacaine were applied subcutaneously. A wire mesh was attached to the skull with acrylic glue to provide an anchor point for dental acrylic resin, and a stainless steel head plate with a 2 mm opening was cemented above the craniotomy site. A craniotomy was performed above the cerebellum, and the dura was removed.
The GABAA receptor blocker SR95531 (SR; also called gabazine; Tocris Bioscience) was administered either by topical application onto the surface of the cerebellum or via subcutaneous injection. For topical application, polyethylene tubing was filled with SR solution (2 mm in sterilized normal saline [0.9% w/v NaCl]) via suction and then connected to a Hamilton syringe in an injection pump. The tip of the tubing was filled with SR-free saline, which served as a control, and was placed at the edge of the craniotomical window. The time when solution switched between control and SR solutions (see Fig. 6E, F, horizontal bars) was determined in advance by filling the same tubing with a fluorescent dye solution of the same volume in the same manner. Alternatively, SR was administered by subcutaneous injection at a dose of 5 mg/kg body weight.
Regardless of the method of drug application, the imaging window was sealed with a glass coverslip (diameter: 5 mm; thickness: #1; Warner Instruments) and low-melting point agar (2%) in normal saline. The objective lens was immersed in a droplet of normal saline on the coverslip. After completing the surgical procedures, isoflurane concentration was lowered to 0.5%–1% to maintain anesthesia during in vivo imaging.
Because solution exchange was practically impossible during in vivo experiments, the Clomeleon ratio was calibrated on the 2-photon microscope by using slices maintained at 38°C by a temperature controller (TC-344B, Warner Instruments). Although we were able to match the temperature, one of the critical determinants of Cl− binding to Clomeleon (Berglund et al., 2009), there may be other factors (e.g., circulating blood in the intact brain) and differential scattering of emission light in deeper tissue that affect CFP and YFP emission differently between in vivo experiments and calibration experiments. Thus, we think that absolute measurements of [Cl−]i were more reliable in slice experiments than in vivo.
Electrophysiology.
Conventional whole-cell patch-clamp recordings were obtained from Purkinje cells by an Axopatch 1D amplifier (Molecular Devices), as described previously (Tanaka et al., 2007). Pipettes (4–5 mΩ) were filled with a solution that contained (in mm) the following: 130 K-gluconate, 2 NaCl, 0.5 EGTA, 20 HEPES, 4 Na2-ATP, 0.4 Na3-GTP, 4 MgCl2. pH was adjusted to 7.2 with KOH. The cells were voltage clamped at ECl (approximately −70 mV) to isolate EPSCs.
The chamber was constantly superfused with oxygenated ACSF at 2 ml/min. Most experiments were done at room temperature (∼24°C); in some cases, the slice was maintained at 34°C by an electronic temperature controller. ACSF containing SR (10 μm), TTX (Tocris Bioscience; 1 μm), bicuculline (Sigma; 20 μm), furosemide (Tocris Bioscience; 100 μm), GABA (Sigma; 10 nm-100 μm), CGP55845 (Tocris Bioscience; 2 or 50 μm), or acetazolamide (Sigma; 50 μm) was bath applied by diluting a stock solution into the ACSF before chamber superfusion. In the Ca2+-free ACSF solution, CaCl2 was replaced by an equimolar concentration of MgCl2, and EGTA (2 mm) was added to chelate remaining trace amounts of Ca2+. Following a solution change, measurements were made after reaching an apparent steady state. For the experiments shown in Figure 10C, there was a systematic shift in baseline [Cl−]i; to measure responses to SR, this shift was subtracted by fitting a single exponential while masking the time of drug application.
To stimulate PFs, a glass electrode (tip diameter ∼10 μm) was used. This electrode was positioned in the ML near the Purkinje cell body and electrical stimuli (5–10 μA, 100–200 μs duration) were applied by a stimulator (S44, Grass Instruments) with a stimulus isolation unit (PSIU6, Grass Instruments). When examining synaptic facilitation with paired stimulation, stimulus pairs were repeated every 10 s.
Animal experiments.
All animal procedures listed here were approved by the Duke University Animal Care and Use Committee or by the Institutional Animal Care and Use Committee of the Biopolis Biological Resource Center in Singapore.
Experimental measurements are expressed as mean ± SEM, unless indicated otherwise.
Results
Clomeleon expression in cerebellar granule cells
The CLM1 line reportedly expresses the optogenetic Cl− indicator, Clomeleon, in cerebellar granule cells (Berglund et al., 2006). In slices prepared from these mice, the cerebellar granule cell layer (GCL) was highly fluorescent and the molecular layer (ML) was more diffusely fluorescent, whereas no fluorescence was observed in the Purkinje cell layer (PCL) (Fig. 1A). This pattern of expression is consistent with Clomeleon being expressed in GCBs and dendrites (to yield fluorescence in the GCL) as well as in their axons, the PFs, within the ML.
Figure 1.
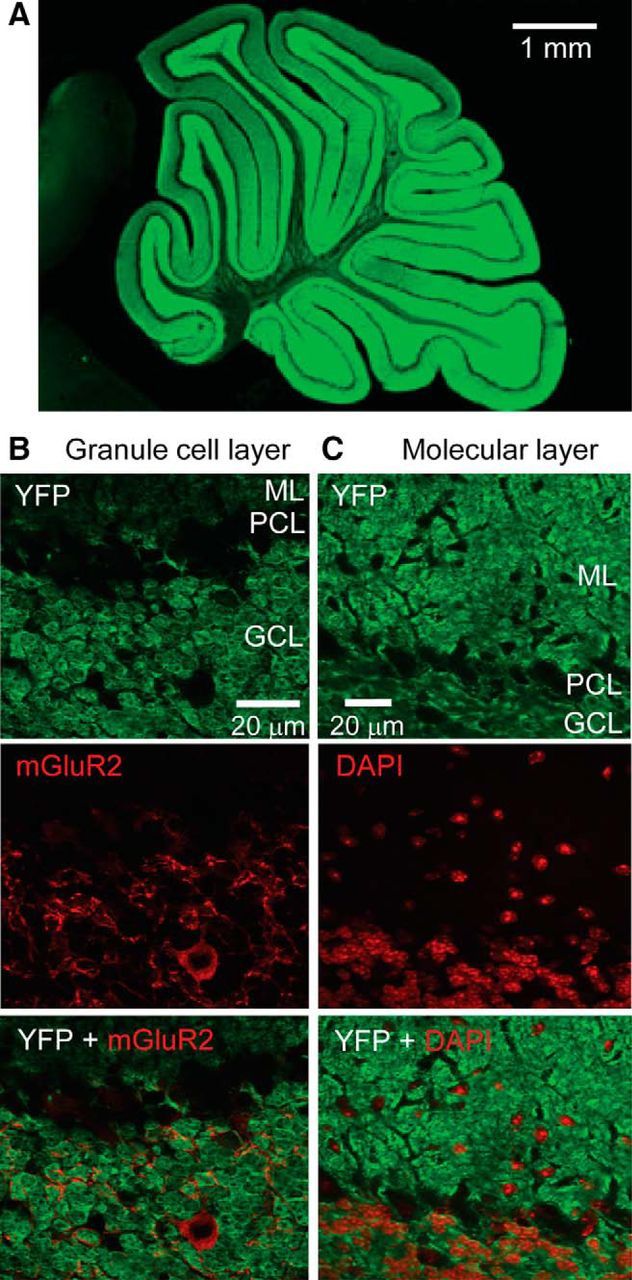
Exclusive expression of Clomeleon in granule cells in the cerebellum. A, A parasagittal section of the entire cerebellum from Clomeleon transgenic mouse line 1, showing YFP fluorescence from Clomeleon in granule cells. Both the ML and GCL are fluorescent due to the presence of Clomeleon in GCBs/dendrites and PFs. Note the absence of YFP fluorescence in the Purkinje cell layer (PCL) in between as Purkinje cell bodies do not express Clomeleon. B, Immunostaining against Clomeleon (top) and mGluR2 (middle) in the GCL. The lack of overlap of the two signals indicates exclusive expression of Clomeleon in GCBs in the GCL (bottom). C, Immunostaining against Clomeleon (top) and nuclear staining with DAPI (middle) in the ML. The lack of overlap of the two signals indicates exclusive expression of Clomeleon in PFs within the ML (bottom).
To more precisely determine which cells express Clomeleon, we examined the spatial pattern of fluorescence within the cerebellum at higher magnification. Within the GCL, Clomeleon fluorescence appeared to be restricted to a dense population of neurons with small cell bodies (3–5 μm diameter), characteristic of granule cells (Fig. 1B, top). Occasional gaps in fluorescence apparently were caused by Golgi cells: labeling of Golgi cells, via an mGluR2 antibody (Fig. 1B, center), revealed that the nonfluorescent areas corresponded to Golgi cell bodies (Fig. 1B, bottom). More generally, there was minimal spatial overlap between the fluorescence signals from Clomeleon and mGluR2, indicating a lack of Clomeleon expression in Golgi cells. Similarly, within the ML, the diffuse pattern of Clomeleon fluorescence was associated with structures too small to be resolved (Fig. 1C, top), consistent with localization to sagitally sectioned PFs (which have a cross-sectional diameter of <1 μm). Clomeleon fluorescence was excluded from blood vessels as well as small spherical regions ∼10 μm in diameter. The spherical regions contained nuclei, as indicated by the nuclear label, DAPI (Fig. 1C, center). There was no overlap between Clomeleon and DAPI labeling within the ML (Fig. 1C, bottom); given that interneurons are the predominant cell type within the ML, we conclude that interneurons, both within the ML as well as the GCL, do not express Clomeleon. In summary, our results extend previous indications that granule cells are the only cells expressing Clomeleon within the cerebellar cortex of this mouse line (Berglund et al., 2006), allowing us to use this mouse to image [Cl−]i in granule cells.
Imaging tonic inhibition with Clomeleon
By measuring the ratio of fluorescence emission of the CFP donor and YFP acceptor of Clomeleon, we could determine resting [Cl−]i in both the GCBs within the GCL and their PFs within the ML (Fig. 2A,B). When measured at room temperature (24°C), resting [Cl−]i was in the range of 5–10 mm in both compartments (Fig. 2C). On average, resting [Cl−]i was slightly higher in PFs than in GCBs (two-tailed paired Student's t test; t(23) = 2.093; p = 0.048; n = 24). From these values, we calculated the equilibrium potential for Cl− (ECl) to be −74 mV for GCBs and −65 mV for PFs. Thus, there is a substantial difference in ECl between GCBs and PFs. Very similar results were obtained when the measurements were repeated at a more physiological temperature (34°C; Fig. 2D): resting [Cl−]i was significantly higher in PFs than in GCBs (two-tailed Wilcoxon paired-sample test; p = 0.016; n = 7).
Clomeleon also allowed us to image chloride-based inhibition of these cells. To visualize tonic inhibition caused by ambient GABA, we treated cerebellar slices with GABAA receptor antagonists; in most experiments, we applied SR95531 (SR; also called gabazine; 10 μm), although occasionally we instead applied bicuculline (20 μm). Treatment with either antagonist reduced basal [Cl−]i substantially (Fig. 3A), as expected if these drugs were blocking a constant Cl− influx produced by tonic inhibition. Thus, Clomeleon imaging is capable of reporting the magnitude, time course, and spatial distribution of rises in [Cl−]i produced by tonic inhibition.
Figure 3.
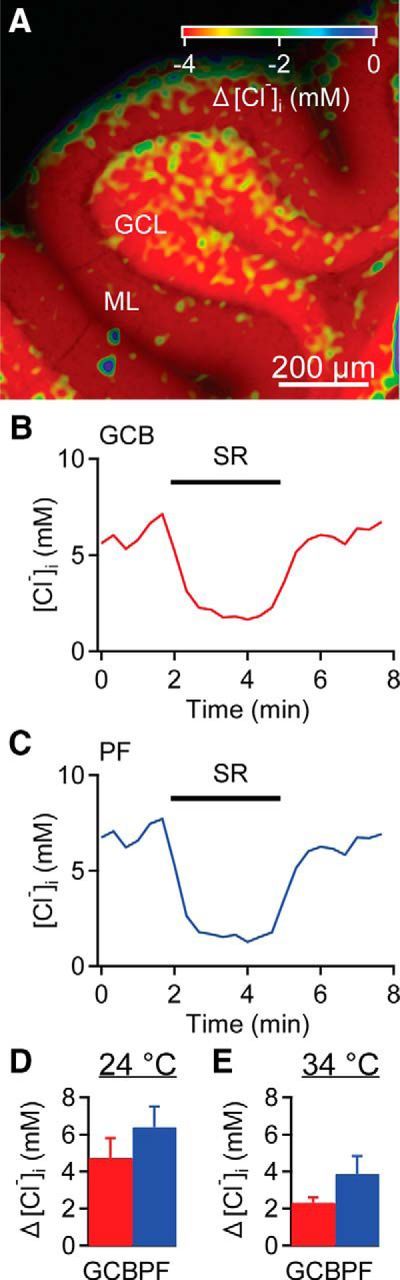
Tonic inhibition of granule cells. A, Reduction in [Cl−]i produced throughout the cerebellar cortex by bath application of SR (10 μm). Image was obtained with a wide-field microscope. B, C, Time course of [Cl−]i changes in the two compartments of granule cells, GCBs (B) and PFs (C), in response to SR application. D, Mean changes in resting [Cl−]i produced by SR application (n = 11). E, Mean changes in [Cl−]i at more physiological temperature (n = 7).
The image shown in Figure 3A indicates that SR caused a reduction in [Cl−]i both in the GCL, where the cell bodies and dendrites of the granule cells reside, as well as in the ML, where PF axons are the only Clomeleon-expressing structures. These reductions in [Cl−]i were relatively rapid, reaching a peak within 1–2 min both in GCBs (Fig. 3B) and in PFs (Fig. 3C), and reversed promptly upon removal of the SR. This time course presumably reflects the competitive interaction between SR and ambient GABA, as well as the rate of drug addition/removal. At 24°C, the SR-induced decrease in [Cl−]i was ∼5 mm and was very similar in magnitude in GCBs and PFs (Fig. 3D; two-tailed Wilcoxon paired-sample test; p = 0.054; n = 11). Significant reductions in [Cl−]i were also observed in GCBs and PFs at a more physiological temperature (34°C), although these reductions were somewhat smaller (Fig. 3E; two-tailed Wilcoxon paired-sample test; p = 0.16; n = 7). These results indicate that tonic inhibition affects [Cl−]i in PFs, in addition to the expected effects on [Cl−]i in GCBs. In both granule cell compartments, tonic inhibition makes a very substantial contribution to Cl− homeostasis and accounts for 25%–75% of the basal [Cl−]i.
Clomeleon is somewhat sensitive to protons, with lower pH increasing the Cl− affinity of this indicator (Kuner and Augustine, 2000). Because we calibrated Clomeleon at a pH of 7.1, any deviation of intracellular pH from this value would result in an error when determining [Cl−]i from the Clomeleon FRET ratio (Kuner and Augustine, 2000; Pond et al., 2006). We therefore measured intracellular pH in granule cells loaded with a pH indicator, SNARF-5F (Fig. 4A). The basal pH of GCBs and PFs was 7.15 ± 0.01 and 7.11 ± 0.02 (mean ± SEM; n = 12), respectively, which were statistically different (two-tailed Wilcoxon paired-sample test; p = 0.042; n = 12). During application of SR, pH in both compartments increased by 0.04 (Fig. 4B,C), and all relevant [Cl−]i values described here have been adjusted accordingly (see Materials and Methods). However, in practice, this slight alkalization produced by SR application did not affect measured [Cl−]i values appreciably because Clomeleon is virtually insensitive to pH at low [Cl−]i (Kuner and Augustine, 2000). We therefore conclude that tonic inhibition actually elevates [Cl−]i in addition to slightly acidifying pH.
Figure 4.
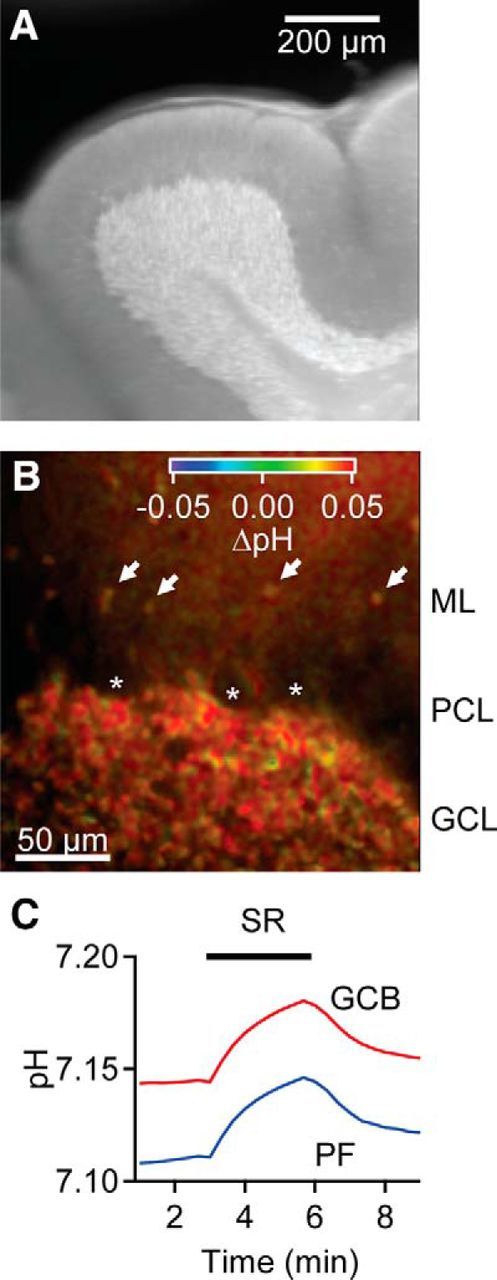
pH measurements in the cerebellar granule cells. A, A SNARF-5F-loaded cerebellar slice. Emission at 630 nm. B, Global alkalization in the cerebellar cortex was seen when SR (10 μm) was applied in the bath. A part of the cerebellar cortex was imaged with the 40 × objective lens. ML interneurons were loaded as well (arrows). Note the lack of SNARF-5F loading in Purkinje cells (*). Image was integrated over the last minute of SR application. C, Time courses of intracellular pH changes following SR application in the two compartments of granule cells, GCBs and PFs. Traces represent averages of 12 experiments.
Properties of tonic inhibition of presynaptic PFs
The remainder of our study largely focused on tonic inhibition of PFs, which presumably went undetected in previous electrophysiological measurements from GCBs. We next asked whether the properties of presynaptic tonic inhibition of PFs, as reported by Clomeleon imaging, are comparable with those identified for tonic inhibition of postsynaptic GCBs. For this purpose, we performed several pharmacological experiments that addressed the sources of GABA in the ML and the identity of the GABAA receptors mediating the response of PFs to this GABA.
Tonic inhibition of cerebellar GCBs is mediated by ambient release of GABA that does not require electrical activity in presynaptic neurons (Rossi et al., 2003). To determine whether tonic inhibition of PFs exhibits similar characteristics, we examined the effects of TTX. Unlike bicuculline or SR, TTX (1 μm) had no significant effect on basal [Cl−]i (Fig. 5A); TTX produced a reduction of 0.5 ± 0.4 mm (mean ± SEM; n = 6) in basal [Cl−]i, providing an indication that tonic inhibition of PFs does not require neuronal activity. More importantly, bicuculline (20 μm) still blocked tonic inhibition in the presence of TTX; the changes in [Cl−]i produced by bicuculline were similar (two-tailed Wilcoxon paired-sample test; p = 0.22; n = 6) in the absence or presence of TTX (Fig. 5A,B). This provides a second indication that tonic inhibition of PFs does not require neuronal activity. Similar results were observed in GCBs as well; bicuculline decreased [Cl−]i similarly in the absence or presence of TTX (2.1 ± 0.5 mm vs 1.7 ± 0.4 mm; mean ± SEM; n = 6; two-tailed Wilcoxon paired-sample test; p = 0.22), yielding one further indication that tonic inhibition of granule cells does not require neuronal activity.
Figure 5.
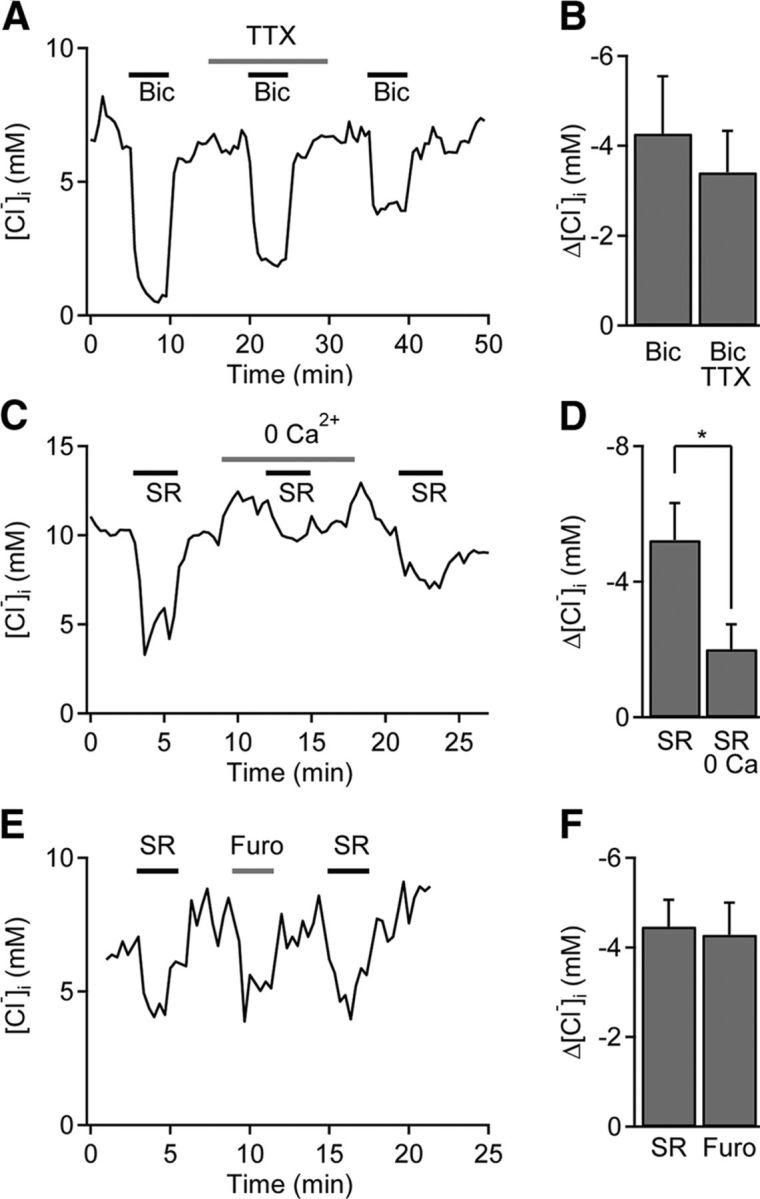
Properties of tonic inhibition of PFs. A, TTX (1 μm) did not change basal [Cl−]i in PFs or block the changes in [Cl−]i produced by bicuculline (Bic; 20 μm). B, Mean changes in resting [Cl−]i of PFs produced by application of bicuculline alone (Bic) or by bicuculline in the presence of TTX (Bic TTX; n = 6). C, Treatment of cerebellar slices with Ca2+-free extracellular solution increased basal [Cl−]i in PFs but did not block the response of PFs to SR (10 μm). D, Mean changes in resting [Cl−]i of PFs produced by application of SR in normal saline (SR) and in the absence of Ca2+ (SR 0 Ca; n = 9). * p < 0.05 (Wilcoxon test). E, [Cl−]i of PFs was reduced by SR as well as by furosemide (Furo; 100 μm). F, Mean changes in resting [Cl−]i produced by application of SR or furosemide (n = 7).
Tonic inhibition of cerebellar GCBs also does not require Ca2+-dependent exocytosis (Rossi et al., 2003). To determine whether this was true for tonic inhibition of PFs, we examined the effect of removing Ca2+ from the extracellular solution. Treatment with Ca2+-free solution caused an increase in basal [Cl−]i (Fig. 5C), yielding a mean increase in [Cl−]i of 1.5 ± 0.6 mm (mean ± SEM; n = 9). Although the reason for this increase is not clear, it is the opposite of what would be expected if tonic inhibition of PFs depended upon Ca2+. Further, this rise in [Cl−]i reduces the driving force on Cl− movement which, in turn, would be expected to reduce the Cl− fluxes associated with tonic inhibition. Nonetheless, SR still decreased [Cl−]i in the absence of Ca2+ (Fig. 5C), although, as expected, the effect of SR was significantly smaller in Ca2+-free solution than in control conditions (Fig. 5D; two-tailed Wilcoxon paired-sample test; p = 0.04; n = 9). Similar results were observed in GCBs as well (5.0 ± 1.0 mm in control vs 2.3 ± 0.5 mm in Ca2+-free; mean ± SEM; n = 9; two-tailed Wilcoxon paired-sample test; p = 0.004). These results indicate that tonic inhibition of presynaptic PFs reported by Clomeleon imaging is due to tonic release of GABA via a mechanism that is independent of neuronal activity and does not depend entirely upon calcium influx, as has been reported previously for tonic inhibition of GCBs. These parallels between tonic inhibition of PFs and GCBs are consistent with the proposal that sustained, channel-mediated release of GABA from glia is the source of ambient GABA responsible for both forms of tonic inhibition (Lee et al., 2010).
The GABAA receptors involved in tonic inhibition of GCBs contain α6 subunits (Hamann et al., 2002), which are preferentially blocked by low concentrations of furosemide (Wall, 2002). To determine whether such receptors are involved in tonic inhibition of PFs, we asked whether the reduction of [Cl−]i in PFs produced by SR was mimicked by furosemide (100 μm). We found that furosemide also reduced [Cl−]i in PFs (Fig. 5E). The changes in [Cl−]i produced by furosemide were very similar in magnitude to those produced by SR (Fig. 5F), with no significant difference between the mean changes in [Cl−]i produced by the two drugs (two-tailed Wilcoxon paired-sample test; p = 0.81; n = 7). Similar results were observed for GCBs: there was no significant difference between the mean changes in [Cl−]i produced by the two drugs (3.6 ± 0.8 mm with SR vs 3.6 ± 0.4 mm with furosemide; n = 7; two-tailed Wilcoxon paired-sample test; p = 0.94). These results indicate that that the high basal [Cl−]i of PFs is due to the tonic activation of high-affinity GABAA receptors that contain α6 subunits. Further, we can conclude that the changes in basal [Cl−]i produced by blockade of these GABAA receptors are due to reduction of this tonic inhibition.
Tonic inhibition of PFs in vivo
To determine whether tonic inhibition of PFs occurs in vivo, we used 2-photon imaging to measure [Cl−]i in the intact brain of Clomeleon transgenic mice. For this purpose, a window was made in the skull of mice anesthetized by isoflurane, and Clomeleon fluorescence was imaged in granule cells in the fourth and fifth lobule or the sixth lobule of the cerebellum, near the midline (Fig. 6A). In these conditions, we could visualize the laminar structure of the cerebellum ∼200 μm below the pial surface (Fig. 6B). Such images were strikingly similar to what was observed in cerebellar slices in vitro (Fig. 2A). Unlike in slice preparations, there was no significant difference in resting [Cl−]i between PFs and GCBs (7.5 ± 2.5 mm and 10.0 ± 1.7 mm, respectively; n = 7; two-tailed Wilcoxon paired-sample test; p = 0.47).
Figure 6C, D shows representative changes in [Cl−]i in the GCBs and PFs, respectively, following subcutaneous injection of SR (5 mg/kg body weight) (Nelson et al., 2002). In these experiments, [Cl−]i started dropping ∼5 min after injection of the SR solution and continued to decrease for the next 10 min or so. Presumably, the slow time course of these responses reflects the time required for SR to reach the cerebellum. Similar observations were made in a total of 4 animals.
We also applied SR (2 mm) topically onto the surface of the cerebellum in a different set of animals (n = 3). To apply SR topically, a tube was placed at the edge of the craniotomy, sealed with agar and a coverslip (Fig. 6A). The tubing was connected to a syringe pump which continuously superfused solutions during an imaging session, initially delivering normal saline as a control and then switching to SR-containing saline. Although there was again a decline in [Cl−]i in GCBs (Fig. 6E) and in PFs (Fig. 6F) during treatment with SR, as observed during subcutaneous application, these decreases were preceded by an apparent increase in [Cl−]i. The initial response was immediate and more rapid than the time required for SR to diffuse from the pial surface to the plane of focus where Clomeleon fluorescence was imaged. We suspect that this initial effect was an artifact caused by the concentrated SR solution, which was bright yellow and could differentially absorb Clomeleon emission. Considering the drops in [Cl−]i observed with both application methods, the magnitude of this SR-induced drop in [Cl−]i was similar in GCBs and in PFs (Fig. 6G; two-tailed Wilcoxon paired-sample test; p = 0.94; n = 7), consistent with our observations in slices (Fig. 3E). Thus, we conclude that tonic inhibition of PFs occurs both in slices and in vivo. Our results also confirm a previous electrophysiological demonstration of tonic inhibition of GCBs in vivo (Chadderton et al., 2004). Because these measurements were made in adult mice (age 5–10 weeks), we can conclude that tonic inhibition occurs in adult mice as well as in the younger mice used for our slice experiments.
In summary, Clomeleon imaging allowed us to monitor tonic inhibition of PFs both in vitro and in vivo. This approach revealed that tonic inhibition of PFs shares most of the properties of tonic inhibition of GCBs observed in previous electrophysiological studies.
Direct tonic inhibition of presynaptic PFs
Because tonic inhibition previously had been detected only with electrical recordings from GCBs, it is possible that tonic inhibition only occurs in the somatodendritic region of these cells. In this case, the decrease in [Cl−]i of PFs produced by application of SR (Figs. 3, 5, and 6) would be an indirect consequence of blocking tonic inhibition in the somata and dendrites of granule cells, with Cl− diffusing from PFs to the rest of the granule cell (Fig. 7A, left). Alternatively, the drop in PF [Cl−]i could result directly from tonic inhibition of PFs (Fig. 7A, right). Local application of SR provides a means of distinguishing between these two models. If [Cl−]i changes in PFs are caused by intracellular Cl− diffusion, then these changes should not occur when SR is locally applied onto PFs. In contrast, if functional GABAA receptors are present on PFs, then [Cl−]i in PFs should be reduced in response to local application of SR.
To distinguish between these two possibilities, we locally applied SR in cerebellar slices. Local application of SR onto GCBs caused a localized decrease in [Cl−]i (Fig. 7B), with the mean decrease in [Cl−]i in GCBs being 1.9 ± 0.4 mm (mean ± SEM; n = 7). This response was transient and recovered soon after the 10-s-long application of SR ended (Fig. 7C), presumably due to rapid diffusion of the drug. This result is predicted by both of the models shown in Figure 7A and serves as a positive control to indicate that local SR application is effective in blocking tonic inhibition. To distinguish between the two models, we next locally applied SR onto PFs. This caused a transient decrease in [Cl−]i in PFs (Fig. 7D,E). The mean decrease in [Cl−]i in PFs was 2.0 ± 0.3 mm (mean ± SEM; n = 7). This result is consistent with the model shown in Figure 7A (right) and therefore indicates a tonic inhibition of PFs via sustained activation of GABAA receptors that reside on PFs.
Biphasic GABA actions on PFs
Although our results with GABAA receptor antagonists indicate that GABA tonically inhibits PFs, local application of GABA or GABAA agonists reportedly excites PFs (Stell et al., 2007; Stell, 2011; Astorga et al., 2015). To reconcile these seemingly contradictory results, we locally applied GABA (1 mm) onto PFs. Local application of GABA onto PFs decreased [Cl−]i (Fig. 8A,B). These responses to GABA were reduced significantly by SR (100 μm; from 0.73 ± 0.14 mm to 0.10 ± 0.05 mm; mean ± SEM; n = 11; two-tailed Wilcoxon paired-sample test; p = 0.001), but not by a GABAB antagonist, CGP55845 (2–50 μm; from 2.5 ± 0.7 mm to 2.5 ± 0.6 mm; mean ± SEM; n = 7; two-tailed Wilcoxon paired-sample test; p = 0.38). This indicates that the GABA-induced decrease in [Cl−]i is mediated solely by GABAA receptors. This decrease in [Cl−]i must result from an efflux of Cl− that would depolarize the PF membrane potential, indicating that GABA is excitatory under these conditions. This confirms previous conclusions (Stell et al., 2007; Stell, 2011; Astorga et al., 2015).
In contrast, local application of GABA onto GCBs increased [Cl−]i (Fig. 8C,D; 0.7 ± 0.2 mm; mean ± SEM; n = 10), indicating an inhibitory action of GABA on this compartment of the granule cell. Further, these results indicate limited diffusion of Cl− between the PFs and GCBs.
The concentration of ambient GABA that produces tonic inhibition has been estimated to be ∼160 nm (Santhakumar et al., 2006; Lee et al., 2010), which is much lower than the concentration produced by local GABA application (1 mm in our experiments). Thus, the simplest explanation for our results showing that both SR and high concentrations of GABA lower [Cl−]i in PFs is that GABA has different actions at different concentrations. To test this hypothesis, we bath-applied GABA at various concentrations while measuring [Cl−]i. Treating PFs with 100 nm GABA, near the concentration thought to mediate tonic inhibition, increased [Cl−]i (Fig. 9A). This is consistent with the observed reduction in [Cl−]i caused by SR blockade of tonic inhibition (Fig. 3). Higher concentrations of GABA caused larger increases in [Cl−]i, with maximal effects observed at 1 μm GABA (Fig. 9B,C); 10 μm GABA caused an increase in [Cl−]i in PFs similar to that produced by 1 μm GABA (Fig. 9C). However, 100 μm GABA produced a smaller increase than that produced by lower concentrations of GABA; in some cases, 100 μm GABA caused a small net decrease in [Cl−]i (Fig. 9D), revealing biphasic effects of GABA on PFs (Fig. 9E; n = 8). This biphasic property accounts for the decreases in [Cl−]i observed both when blocking tonic inhibition of PFs (Fig. 3) and when locally applying 1 mm GABA onto PFs (Fig. 8). In contrast, increasing GABA concentrations produced only monotonic rises in [Cl−]i in GCBs (Fig. 9F; n = 8).
Figure 9.
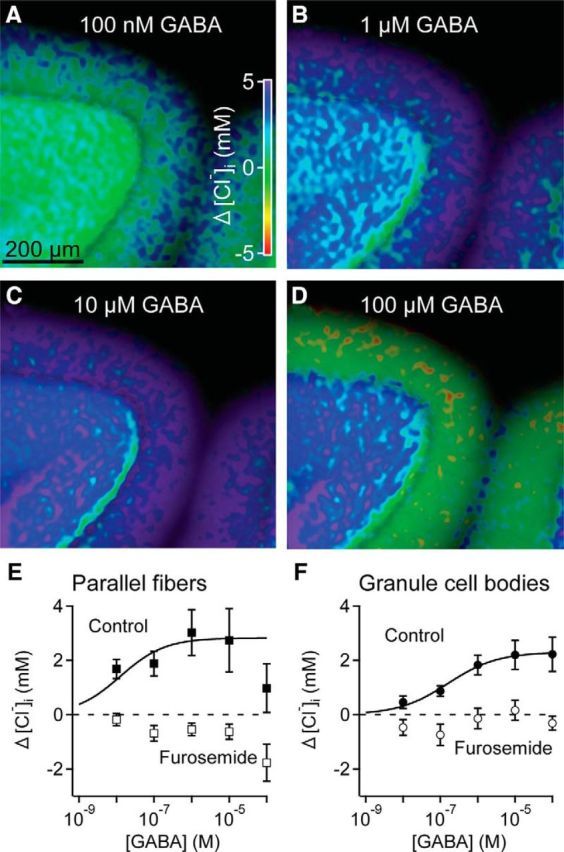
Biphasic actions of GABA on PFs. A–D, Images of changes in [Cl−]i produced by bath application of GABA at the indicated concentrations. E, F, GABA dose–response curves for GCBs (E) and PFs (F). In GCBs, furosemide (100 μm) blocked the response by higher doses of GABA. Smooth curve indicates fits of the Hill equation to the data. Because of the biphasic nature of the [Cl−]i changes in PFs, only data from GABA concentrations of ≤1 μm were fit, using the same Kd measured for the GCB dose–response curve (n = 6).
The dose–response curve for GCBs was well fit by the Hill equation (Fig. 9F, curve), with a Hill coefficient of 0.66 and a Kd of 160 nm (n = 8). A similar relationship could also describe the responses of PFs to GABA concentrations of ≤10 μm (Fig. 9E, curve; a Hill coefficient of 0.73 and a Kd of 13 nm; n = 8), where the actions of GABA to decrease [Cl−]i were not evident. The submicromolar Kd for both responses is consistent with the very high affinity characteristic of GABAA receptors involved in tonic inhibition (Quirk et al., 1994; Saxena and Macdonald, 1996; Rossi and Hamann, 1998).
The two processes underlying the biphasic response of PFs to GABA could be dissociated by treatment with furosemide (100 μm). This drug completely prevented GABA from elevating [Cl−]i in PFs (Fig. 9E; n = 7). This blockage of GABA responses was statistically significant (two-way ANOVA; the main effect of furosemide: F(1,78) = 46.1, p < 0.05; the main effect of GABA: F(1,78) = 2.38, p < 0.05; their interactions: F(5,78) = 2.36, p < 0.05; in Dunnett's pairwise comparison, all the furosemide conditions were significantly different from control, p < 0.05 and control responses to 1 and 10 μm GABA were significantly different from 0, p < 0.05). The same was true in GCBs (Fig. 9F; n = 7; two-way ANOVA; the main effect of furosemide: F(1,78) = 52.9, p < 0.05; the main effect of GABA: F(1,78) = 5.01, p < 0.05; their interactions: F(5,78) = 3.21, p < 0.05; in Dunnett's pairwise comparison, all the furosemide conditions were significantly different from control, p < 0.05 and control responses to 1, 10, and 100 μm GABA were significantly different from 0, p < 0.05). This suggests that exogenous GABA raises [Cl−]i by activating high-affinity GABAA receptors that contain α6 subunits (Wall, 2002). In contrast, the reduction of [Cl−]i produced in PFs by higher doses of GABA was not blocked by furosemide (Fig. 9E), including when 1 mm GABA was locally applied onto PFs with the procedure illustrated in Figure 8 (data not shown). These results indicate that the ability of high concentrations of GABA to cause Cl− efflux is due to a different population of GABAA receptors with a very low affinity for GABA. This affinity must be >100 μm because at this concentration the dose–response curve measured in the presence of furosemide shows no sign of saturation (Fig. 9E). This is consistent with previous work showing that phasic inhibition of granule cells is mediated by low-affinity synaptic GABAA receptors that are insensitive to furosemide (Rossi and Hamann, 1998; Hamann et al., 2002).
Anion fluxes underlying GABA inhibition and excitation of PFs
How can different concentrations of GABA cause Cl− to flow in opposite directions? The efflux of Cl− during the action of high [GABA] indicates that the PF membrane potential is more negative than ECl (−65 mV for PFs). This arises from the high resting [Cl−]i of PFs (Fig. 2C,D), as well as the likely contribution of a relatively high resting K+ conductance to maintain a hyperpolarized resting membrane potential. However, the action of low [GABA] to create a sustained influx of Cl− requires an additional depolarizing drive to maintain the membrane potential at a level more positive than ECl; otherwise, the resting membrane potential would quickly hyperpolarize to ECl and Cl− influx would cease. It is known that sustained activation of GABAA receptors can depolarize neurons because efflux of HCO3− through GABA receptors occurs even when the electrochemical gradient for Cl− has collapsed (Staley et al., 1995; Staley and Proctor, 1999; Ferrini et al., 2013). We therefore next considered the possible role of HCO3− in maintaining the driving force for Cl− influx during tonic inhibition.
The contribution of HCO3− to tonic inhibition was examined by measuring Cl− fluxes while removing HCO3−. To eliminate HCO3−, NaHCO3 in the extracellular solution was replaced by HEPES and CO2 was replaced with O2; extracellular pH was maintained at 7.4. In addition, intracellular generation of HCO3− by carbonyl anhydrase was blocked by the inhibitor acetazolamide (50 μm) (Kim and Trussell, 2009; Ferrini et al., 2013). Such depletion of intracellular HCO3− could be observed as an alkalization of cytoplasmic pH in PFs (Fig. 10A,B). This effect upon presynaptic pH was statistically significant (n = 3; one-way ANOVA; F(2,6) = 12.8; p = 0.007; followed by Dunnett's test; q(6, 3) = 3.33; p = 0.028). Removal of HCO3− also reduced resting [Cl−]i significantly (Fig. 10C,D; n = 7; one-way ANOVA; F(2,18) = 13.7; p = 0.0002; followed by Dunnett's test; q(18, 3) = 4.31; p = 0.0008). This effect perhaps was due to the predicted reduction in driving force for Cl− influx during tonic inhibition. More importantly, the absence of HCO3− caused a complete loss of the drop in [Cl−]i caused by SR blockade of tonic inhibition (Fig. 10E); this effect was statistically significant (n = 4; p < 0.05; one-way ANOVA followed by Dunnett's test). Further, this effect on SR responses reversed when HCO3− was restored, indicating that it is not a nonspecific effect associated with HCO3− removal. Together, these results indicate that HCO3− is required to sustain the driving force for Cl− influx during tonic inhibition.
In conclusion, PFs possess at least two types of GABAA receptors (Fig. 11). One type of GABAA receptor has a high affinity for GABA and is tonically activated by ambient GABA, yielding an influx of Cl− that produces tonic inhibition (Fig. 11, left). HCO3− permeation in these receptors apparently is significant and required to sustain tonic inhibition by providing the driving force for Cl− influx. These receptors are blocked by furosemide (Figs. 5E,F, 9E). The second type of GABAA receptor has a low affinity for GABA (Fig. 11, right). Activation of this receptor by high concentrations of GABA (≥50 μm) causes Cl− efflux that can depolarize PFs, evident as both an enhancement of PF transmission (Stell et al., 2007; Pugh and Jahr, 2011; Dellal et al., 2012; Astorga et al., 2015) and a decline in [Cl−]i (Figs. 8B, 9D). These receptors are not blocked by furosemide (Fig. 9E) and apparently are not permeable to HCO; the driving force for Cl− efflux through these receptors is provided by a hyperpolarized resting membrane potential, due to resting K+ efflux, as well as possible desensitization of the high-affinity, HCO3−/CI− permeable GABA receptors.
Figure 11.

Two types of GABAA receptors in PFs. High-affinity receptors are permeable to HCO3−, with the efflux of this anion providing a positive driving force for Cl− that enables persistent influx of Cl− through these receptors (left). Low-affinity receptors are not permeable to HCO3−, reversing the polarity of the electrochemical driving force for Cl− at high GABA levels (right).
Regulation of glutamate release by presynaptic tonic inhibition
Tonic inhibition of presynaptic PFs by ambient GABA could also regulate the amount of transmitter released from PF terminals, thereby influencing phasic synaptic transmission between granule cells and postsynaptic Purkinje cells. To examine this possibility, we used SR application to block tonic inhibition while measuring EPSCs produced in Purkinje cells in response to glutamate released by PFs. In these experiments, we held the Purkinje cells at ECl to avoid possible complications caused by SR blocking IPSCs generated in Purkinje cells by phasic release of GABA from interneurons (Konnerth et al., 1990; Llano et al., 1991; Vincent and Marty, 1996; Kim et al., 2014). These experiments were done in sagittal slices; in such slices, PFs are severed from GCBs during the slicing procedure, thereby eliminating any possible contribution of GCBs to measured synaptic responses.
We first examined the effect of SR on spontaneous release of glutamate from PF terminals. Small spontaneous inward currents could be detected in Purkinje cells (Fig. 12A). Treatment with the glutamate receptor antagonist, kynurenic acid (3 mm), reduced the frequency of these currents by 99%, from 5.4 ± 1.4 Hz to 0.1 ± 0.1 Hz (mean ± SEM; n = 6 cells). This indicates that these currents represent glutamatergic EPSCs that were virtually uncontaminated by GABAergic IPSCs and presumably reflect spontaneous miniature EPSCs (Bordey and Sontheimer, 2003). Blockade of tonic inhibition, by application of SR, caused the frequency of these spontaneous EPSCs to increase (Fig. 12A). This effect of SR treatment was relatively rapid, reaching a peak within 1–2 min after beginning SR superfusion (Fig. 12B). This approximately parallels the time course of changes in [Cl−]i caused in PFs by SR (Fig. 3C). SR increased the mean frequency of spontaneous EPSCs by 172 ± 70% (mean ± SEM; n = 6 cells) over the values measured before SR treatment (Fig. 12C). This increase in EPSC frequency was significant (two-tailed Wilcoxon paired-sample test; p = 0.03; n = 6 cells). In contrast, SR had no effect on the distribution of spontaneous EPSC amplitudes (Fig. 12D; Kolmogorov–Smirnov test; D = 0.014; p = 0.13; n [weighted number of elements] = 7,072) or the mean amplitude of spontaneous EPSCs (Fig. 12E; two-tailed Wilcoxon paired-sample test; p = 0.56; n = 6 cells), indicating a lack of effect of SR treatment on the properties of postsynaptic Purkinje cells (Fatt and Katz, 1952). Thus, spontaneous release of glutamate from presynaptic PFs is limited by tonic inhibition.
Figure 12.
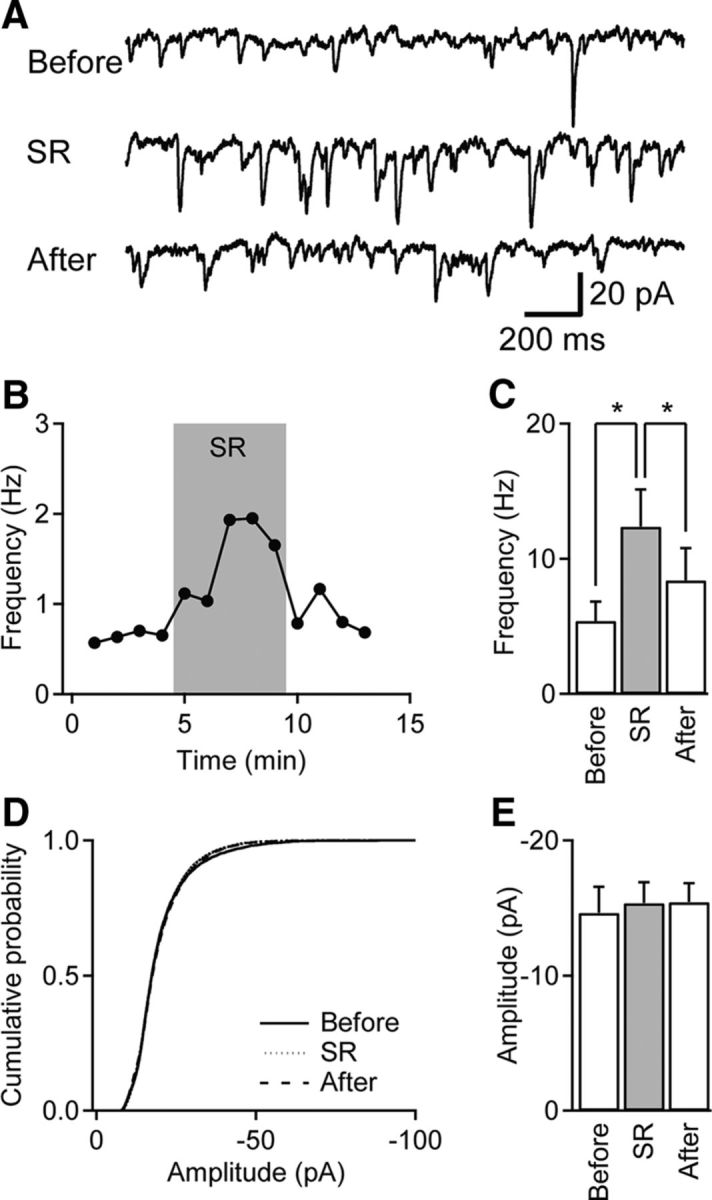
Tonic inhibition affects spontaneous transmitter release from PFs. A, Spontaneous EPSCs recorded from a Purkinje cell before, during, and after application of SR (10 μm) in the bath. SR increased the frequency of spontaneous EPSCs. B, Time course of changes in frequency of spontaneous EPSCs produced by application of SR. Results from the same experiment shown in A. C, Mean frequency of spontaneous EPSCs in the indicated conditions (n = 6). *p < 0.05, significant differences between comparisons illustrated by lines. D, Cumulative distribution of spontaneous EPSC amplitudes was unaffected by SR application (n > 7000 events for each condition from four cells). E, Mean amplitude of spontaneous EPSCs measured in the indicated conditions. Mean EPSC amplitude was not statistically different between groups (p > 0.4; paired Student's t tests; n = 6), from the same data shown in C.
We next examined the effect of SR on EPSCs evoked by PF stimulation. In these experiments, an extracellular stimulating electrode was used to activate presynaptic PFs and was placed near the Purkinje cell body to minimize possible shunting of the evoked EPSCs along Purkinje cell dendrites by GABAergic inhibition. The inward currents evoked by such stimuli were almost completely blocked by the combined application of the glutamate antagonists kinurenic acid (3 mm) and CNQX (100 μm; Fig. 13A; n = 10), indicating that these currents were almost purely glutamatergic EPSCs.
Figure 13.

Tonic inhibition reduces evoked transmitter release. A, EPSCs recorded from a Purkinje cell in response to electrical stimulation of PFs. Blocking tonic inhibition by bath application of SR (10 μm) increased the amplitude of EPSCs. Coapplication of glutamate receptor blockers kinurenic acid (KA; 3 mm) and CNQX (100 μm) almost completely eliminated EPSCs, revealing their glutamatergic origins. Each trace represents the average of responses to 20 stimuli. B, Time course of changes in EPSC amplitude produced by application of SR. EPSC amplitudes were normalized to the mean value measured before SR application. Points represent the means of 8 experiments. C, Mean amplitude of EPSCs in the indicated conditions (n = 9). D, EPSCs produced by paired stimuli separated by an interval of 100 ms, with responses normalized to the peak amplitude of the response to the first stimulus. Each trace represents the average of 40 trials. E, Amount of facilitation measured in the three conditions indicated (n = 9). F, Coefficient of variation (CV) of the first eEPSCs in the three conditions (n = 10). *p < 0.05 (paired Student's t test). **p < 0.01 (paired Student's t test).
SR treatment increased the amplitude of these evoked EPSCs (Fig. 13A). The effect of SR on EPSC amplitude was reversible (Fig. 13B,C). On average, SR treatment increased EPSC amplitude by 16 ± 8% (mean ± SEM; n = 9; Fig. 13C), and this effect was statistically significant (two-tailed Wilcoxon paired-sample test; p = 0.037). These results indicate that tonic inhibition suppresses phasic transmission between presynaptic PFs and postsynaptic Purkinje cells. Given the results above indicating that SR does not alter the amplitude of spontaneous EPSCs (Fig. 12D,E), we conclude that this effect of SR on EPSC amplitude is due to tonic inhibition reducing the amount of glutamate released from presynaptic PFs in response to action potentials (Del Castillo and Katz, 1954).
To provide further support for our conclusion that SR affects phasic synaptic transmission by acting on presynaptic PFs, we next examined the effects of SR on synaptic facilitation. Given that facilitation is very sensitive to the probability of transmitter release, changes in transmitter release from presynaptic terminals usually alter the degree of facilitation (Dobrunz and Stevens, 1997; Oleskevich et al., 2000). Under control conditions, EPSCs facilitated when pairs of PF stimuli were applied at an interval of 100 ms, as has been described previously (Konnerth et al., 1990; Atluri and Regehr, 1996; Kreitzer and Regehr, 2000). Application of SR caused the second EPSC to show less facilitation than in control conditions. This effect on synaptic facilitation was readily observed after normalizing the amplitudes of EPSCs produced by the first stimuli (Fig. 13D). The effect of SR on facilitation was reversible and statistically significant (Fig. 13E; two-tailed Wilcoxon paired-sample test; p = 0.02; n = 9). This reduction in facilitation provides a second indication that tonic inhibition normally acts to decrease the probability of glutamate release from presynaptic terminals of PFs in response to action potentials.
Finally, we examined a third index of presynaptic function, EPSC coefficient of variation (CV) (Del Castillo and Katz, 1954; Silver et al., 1996; Silver et al., 1998; Sola et al., 2004). This parameter also was reversibly reduced by SR, and the effect of SR on the coefficient of variation was statistically significant (Fig. 13F; two-tailed Wilcoxon paired-sample test; p = 0.002; n = 10). The decrease in the CV produced by SR is a third independent indication that tonic inhibition reduces the probability of glutamate release from presynaptic PFs in response to action potentials.
In conclusion, tonic inhibition reduces both spontaneous and evoked release of glutamate from PFs and thereby limits phasic synaptic transmission between PFs and Purkinje cells.
Discussion
We used Clomeleon imaging to detect tonic inhibition of cerebellar granule cells. Tonic inhibition was not limited to GCBs and dendrites: granule cell axons, the PFs, also have tonically activated GABAA receptors. The properties of PF tonic inhibition are much like those of tonic inhibition of GCBs, with the important additional property of regulating neurotransmitter release from PF presynaptic terminals.
Optogenetic imaging of tonic inhibition
Optogenetic techniques are revolutionizing our ability to both control and monitor neuronal activity, as well as to map neural circuits (Baker et al., 2008; Berglund et al., 2008; Mancuso et al., 2011; Deisseroth, 2015). Here we have used the optogenetic indicator, Clomeleon (Kuner and Augustine, 2000), to monitor tonic inhibition. Transgenic mice that express Clomeleon in cerebellar granule cells allowed us to visualize tonic inhibition of these cells, both in vitro and in vivo. This approach revealed that tonic inhibition occurs in PFs, a location that has gone undetected in previous electrophysiological studies. Thus, Clomeleon imaging provides a means of detecting tonic inhibition offering technical ease, spatial resolution, and targeting to genetically defined neuronal populations. This approach should greatly promote efforts to identify the locations and physiological significance of tonic inhibition throughout the brain, as well as to understand the underlying mechanisms.
Presynaptic GABAA receptors
Presynaptic inhibition of phasic synaptic transmission by GABAA receptors was first identified in the crayfish neuromuscular junction (Dudel and Kuffler, 1961) and subsequently has been found in many types of synapses in the mammalian CNS (for review, see Trigo et al., 2008). Our work adds cerebellar PFs to the list of presynaptic terminals that evince inhibition mediated by GABAA receptors. Thus, GABAA receptors join adenosine and GABAB receptors (Dittman and Regehr, 1996, 1997) as presynaptic modulators of excitatory transmission in the cerebellar ML.
Following blockade of tonic inhibition, we observed a substantial increase in spontaneous excitatory synaptic transmission between granule cells and Purkinje cells (Fig. 12) and a smaller but significant enhancement of evoked excitatory transmission (Fig. 13). These experiments were made in sagittal slices, where the vast majority of granule-cell axons (PFs) were severed from their cell bodies in the granular layer, thus eliminating any contribution of granule-cell dendrites and cell bodies to the response to SR application. Still, SR can block GABAA receptors on Purkinje cell dendrites, and this could affect propagation of synaptic current along the dendrites via shunting inhibition, potentially contributing to changes in EPSCs recorded in the cell body. However, this cannot explain our results because there was no observable change in the amplitude of spontaneous EPSCs during SR treatment (Fig. 12D,E). Further, we also observed changes in synaptic facilitation and coefficient of variance, measures that solely depend upon presynaptic properties. Together, we can conclude that tonic inhibition reduces both spontaneous and evoked release of glutamate from PFs.
The magnitude of the effect of presynaptic tonic inhibition on PF synaptic transmission (∼16%) was smaller than some other forms of synaptic plasticity found at this synapse: long-term potentiation can strengthen PF synapses on Purkinje cells by up to 75% (Hirano, 1990), and long-term depression can reduce transmission at these synapses by as much as 50% (Tanaka et al., 2007). However, given that ∼150 PF synapses must be active to fire an action potential in a Purkinje cell (Isope and Barbour, 2002), a 16% inhibition of PF synaptic transmission will negate the effect of >20 PF inputs to a Purkinje cell. This would be expected to significantly alter integration of PF inputs by Purkinje cells. The substantial effects of tonic inhibition on synaptic facilitation (Fig. 13E) and synaptic variability (Fig. 13F) would be expected to have further dynamic effects on integration of PF synaptic input.
Our conclusion that presynaptic GABAA receptors control phasic synaptic transmission between cerebellar granule cells and Purkinje cells is consistent with previous results. Immunoelectron microscopy studies have identified GABAA receptors on PF terminals (Stell et al., 2007). In cerebellar granule cells, single electrical stimuli can generate repetitive firing of action potentials that is blocked by muscimol, a GABAA agonist (Isope et al., 2004). Further, both spontaneous and evoked glutamate release from PFs is regulated by activation of GABAA receptors (Stell et al., 2007; Stell, 2011; Astorga et al., 2015).
One apparent discrepancy is that application of GABAA agonists enhances glutamate release from PFs (Stell et al., 2007), although we have found that ambient GABA is inhibitory. We have demonstrated that this difference is due to the GABA concentrations present in the two conditions. Specifically, during tonic inhibition, ambient GABA concentrations are in the submicromolar range (Santhakumar et al., 2006), a concentration where GABA increases [Cl−]i in PFs (Fig. 9F). In contrast, the excitatory actions of GABA on PFs require high GABA concentrations. Thus, in addition to its tonic inhibitory action, high concentrations of GABA (50 μm to 1 mm) cause a Cl− efflux (Figs. 8, 9) that depolarizes PFs (Astorga et al., 2015), accounting for the observation that activation of GABAA receptors by such concentrations of GABA can augment glutamate release (Stell et al., 2007). The timing of GABA application also appears to be important for inhibitory action of GABA. Stell (2011) reported that the effect of the GABAA agonist, muscimol, on action potential firing of PFs became inhibitory when application was prolonged, consistent with our observation that the sustained presence of ambient GABA is inhibitory.
Manipulation of HCO3− showed that this anion enables a sustained influx of Cl− during tonic inhibition (Fig. 10). Although HCO3− supports tonic inhibition, such an effect would prevent Cl− efflux during the excitatory action of GABA. We thus hypothesize that differences in HCO3− permeability between the high- and low-affinity GABAA receptors of PFs underlies the biphasic nature of GABA action (Figs. 8–10). Differences have been observed in the HCO3− permeability of GABA receptors (Farrant and Kaila, 2007; Alvarez-Leefmans and Delpire, 2009), and such a differential permeability to HCO3− presumably is conferred by GABAA receptors with different subunit composition. Future studies will be needed to identify the molecular determinants of HCO3− permeability in the GABAA receptors of PFs.
The receptors involved in the excitatory presynaptic action of high concentrations of GABA are not blocked by furosemide and therefore are distinct from those that mediate tonic presynaptic inhibition. Although the subunit composition of these receptors also remains to be elucidated, the immunoelectron microscopy data of Stell et al. (2007) indicate that these receptors contain at least the GABAA receptor α1 subunit.
Regulation of phasic transmission by tonic inhibition
In addition to conventional synaptic transmission that relies on presynaptic action potentials to trigger phasic, Ca2+-dependent exocytosis of neurotransmitters, a second mode of communication is based on tonic release of neurotransmitters (most notably GABA) via a mechanism that depends on neither neuronal activity nor Ca2+-dependent exocytosis (Jabaudon et al., 1999; Liu et al., 2000; Rossi et al., 2003) and may be due to channel-mediated release of GABA from glia (Lee et al., 2010). We have discovered that these two mechanisms of synaptic signaling interact, specifically that GABA-mediated tonic inhibition limits phasic glutamate release from PFs. Thus, the low concentrations of ambient GABA present under physiological conditions allows tonic inhibition to fine-tune synaptic circuitry mediated by phasic synaptic transmission.
The logic behind regulation of phasic transmission by tonic inhibition is not yet clear. In general, tonic inhibition is thought to be an adaptive mechanism that alters the input-output gain of a neuron and the excitability of neural networks. Tonic inhibition of phasic synaptic transmission should provide another means of setting the overall tone of a synaptic network. Because the ambient GABA that causes tonic inhibition of PFs appears to be spatially diffuse, this cross talk could provide a spatially diffuse mechanism for controlling neural circuits constructed from phasic synapses. Presynaptic tonic inhibition potentially can also make synaptic information processing sensitive both to changes in ambient GABA signaling as well as to various types of regulators of GABAA receptors. Tonic inhibition shows distinct cell specificity and developmental profiles in different brain regions (Semyanov et al., 2004). Tonic inhibition also is regulated by a variety of endogenous and exogenous factors that might provide fine control of phasic synaptic signaling (Stell et al., 2003; Maguire and Mody, 2007) and conceivably could regulate tonic inhibition of presynaptic PFs as well.
In conclusion, we have used the optogenetic indicator, Clomeleon, to visualize tonic inhibition in the cerebellum. Our finding of tonic inhibition of presynaptic PFs indicates that the ambient GABA level is high enough to activate GABAA receptors throughout the cerebellar cortex, including PFs within the ML. This was observed both in slices and in vivo, indicating that this level of ambient GABA is physiologically relevant. We have found that PF synaptic transmission is under the control of tonic inhibition. Our identification of this novel interaction between phasic and tonic signaling mechanisms suggests that tonic inhibition probably plays a larger than expected role in regulating cerebellar function and perhaps the function of circuits in other brain regions as well.
Footnotes
This work was supported by National Institute of Mental Health Grants, Alfred P. Sloan Research Fellowship, Klingenstein Fellowship Award in the Neuroscience, Beckman Young Investigator Award, World Class Institute program of the National Research Foundation of Korea funded by Ministry of Education, Science, and Technology WCI 2009-003, National Research Foundation of Singapore CRP Grant, National Science Foundation Grant 1512826, and BRAIN Initiative MH106013. We thank S. Van Hooser and D. Fitzpatrick for teaching us about in vivo imaging; K. Tanaka for electrophysiological advice; C.J. Lee for helpful discussion; and K. Chung, E. Ellison, D. Given, S. Kay, M. Lee, and P. Teo for technical assistance.
The authors declare no competing financial interests.
References
- Alvarez-Leefmans FJ, Delpire E. Thermodynamics and kinetics of chloride transport in neurons: an outline. In: Alvarez-Leefmans FJ, Delpire E, editors. Physiology and pathology of chloride transporters and channles in the nervous system. London: Academic; 2009. pp. 81–108. [Google Scholar]
- Astorga G, Bao J, Marty A, Augustine GJ, Franconville R, Jalil A, Bradley J, Llano I. An excitatory GABA loop operating in vivo. Front Cell Neurosci. 2015;9:275. doi: 10.3389/fncel.2015.00275. [DOI] [PMC free article] [PubMed] [Google Scholar]
- Atluri PP, Regehr WG. Determinants of the time course of facilitation at the granule cell to Purkinje cell synapse. J Neurosci. 1996;16:5661–5671. doi: 10.1523/JNEUROSCI.16-18-05661.1996. [DOI] [PMC free article] [PubMed] [Google Scholar]
- Baker BJ, Mutoh H, Dimitrov D, Akemann W, Perron A, Iwamoto Y, Jin L, Cohen LB, Isacoff EY, Pieribone VA, Hughes T, Knöpfel T. Genetically encoded fluorescent sensors of membrane potential. Brain Cell Biol. 2008;36:53–67. doi: 10.1007/s11068-008-9026-7. [DOI] [PMC free article] [PubMed] [Google Scholar]
- Berglund K, Dunbar RL, Lee P, Feng G, Augustine GJ. Imaging synaptic inhibition with Clomeleon, a genetically encoded chloride indicator. In: Konnerth A, Lanni F, Yuste R, editors. Imaging in neuroscience and development: a laboratory manual, Ed 2. New York: Cold Spring Harbor Laboratory; 2005. pp. 495–498. [Google Scholar]
- Berglund K, Schleich W, Krieger P, Loo LS, Wang D, Cant NB, Feng G, Augustine GJ, Kuner T. Imaging synaptic inhibition in transgenic mice expressing the chloride indicator, Clomeleon. Brain Cell Biol. 2006;35:207–228. doi: 10.1007/s11068-008-9019-6. [DOI] [PMC free article] [PubMed] [Google Scholar]
- Berglund K, Schleich W, Wang H, Feng G, Hall WC, Kuner T, Augustine GJ. Imaging synaptic inhibition throughout the brain via genetically targeted Clomeleon. Brain Cell Biol. 2008;36:101–118. doi: 10.1007/s11068-008-9031-x. [DOI] [PMC free article] [PubMed] [Google Scholar]
- Berglund K, Kuner T, Augustine GJ. Clomeleon, a genetically encoded chloride inidicator. In: Alvarez-Leefmans FJ, Delpire E, editors. Physiology and pathology of chloride transporters and channles in the nervous system. London: Academic; 2009. pp. 125–139. [Google Scholar]
- Berglund K, Kuner T, Feng G, Augustine GJ. Imaging synaptic inhibition with the genetically encoded chloride indicator Clomeleon. Cold Spring Harb Protoc. 2011;2011:1492–1497. doi: 10.1101/pdb.prot066985. [DOI] [PubMed] [Google Scholar]
- Bordey A, Sontheimer H. Modulation of glutamatergic transmission by bergmann glial cells in rat cerebellum in situ. J Neurophysiol. 2003;89:979–988. doi: 10.1152/jn.00904.2002. [DOI] [PubMed] [Google Scholar]
- Brickley SG, Cull-Candy SG, Farrant M. Development of a tonic form of synaptic inhibition in rat cerebellar granule cells resulting from persistent activation of GABAA receptors. J Physiol. 1996;497:753–759. doi: 10.1113/jphysiol.1996.sp021806. [DOI] [PMC free article] [PubMed] [Google Scholar]
- Brickley SG, Revilla V, Cull-Candy SG, Wisden W, Farrant M. Adaptive regulation of neuronal excitability by a voltage-independent potassium conductance. Nature. 2001;409:88–92. doi: 10.1038/35051086. [DOI] [PubMed] [Google Scholar]
- Chadderton P, Margrie TW, Häusser M. Integration of quanta in cerebellar granule cells during sensory processing. Nature. 2004;428:856–860. doi: 10.1038/nature02442. [DOI] [PubMed] [Google Scholar]
- Deisseroth K. Optogenetics: 10 years of microbial opsins in neuroscience. Nat Neurosci. 2015;18:1213–1225. doi: 10.1038/nn.4091. [DOI] [PMC free article] [PubMed] [Google Scholar]
- Del Castillo J, Katz B. Quantal components of the end-plate potential. J Physiol. 1954;124:560–573. doi: 10.1113/jphysiol.1954.sp005129. [DOI] [PMC free article] [PubMed] [Google Scholar]
- Dellal SS, Luo R, Otis TS. GABAA receptors increase excitability and conduction velocity of cerebellar parallel fiber axons. J Neurophysiol. 2012;107:2958–2970. doi: 10.1152/jn.01028.2011. [DOI] [PMC free article] [PubMed] [Google Scholar]
- Dittman JS, Regehr WG. Contributions of calcium-dependent and calcium-independent mechanisms to presynaptic inhibition at a cerebellar synapse. J Neurosci. 1996;16:1623–1633. doi: 10.1523/JNEUROSCI.16-05-01623.1996. [DOI] [PMC free article] [PubMed] [Google Scholar]
- Dittman JS, Regehr WG. Mechanism and kinetics of heterosynaptic depression at a cerebellar synapse. J Neurosci. 1997;17:9048–9059. doi: 10.1523/JNEUROSCI.17-23-09048.1997. [DOI] [PMC free article] [PubMed] [Google Scholar]
- Dobrunz LE, Stevens CF. Heterogeneity of release probability, facilitation, and depletion at central synapses. Neuron. 1997;18:995–1008. doi: 10.1016/S0896-6273(00)80338-4. [DOI] [PubMed] [Google Scholar]
- Dudel J, Kuffler SW. Presynaptic inhibition at the crayfish neuromuscular junction. J Physiol. 1961;155:543–562. doi: 10.1113/jphysiol.1961.sp006646. [DOI] [PMC free article] [PubMed] [Google Scholar]
- Duebel J, Haverkamp S, Schleich W, Feng G, Augustine GJ, Kuner T, Euler T. Two-photon imaging reveals somatodendritic chloride gradient in retinal ON-type bipolar cells expressing the biosensor Clomeleon. Neuron. 2006;49:81–94. doi: 10.1016/j.neuron.2005.10.035. [DOI] [PubMed] [Google Scholar]
- Dzhala VI, Kuchibhotla KV, Glykys JC, Kahle KT, Swiercz WB, Feng G, Kuner T, Augustine GJ, Bacskai BJ, Staley KJ. Progressive NKCC1-dependent neuronal chloride accumulation during neonatal seizures. J Neurosci. 2010;30:11745–11761. doi: 10.1523/JNEUROSCI.1769-10.2010. [DOI] [PMC free article] [PubMed] [Google Scholar]
- Dzhala V, Valeeva G, Glykys J, Khazipov R, Staley K. Traumatic alterations in GABA signaling disrupt hippocampal network activity in the developing brain. J Neurosci. 2012;32:4017–4031. doi: 10.1523/JNEUROSCI.5139-11.2012. [DOI] [PMC free article] [PubMed] [Google Scholar]
- Farrant M, Kaila K. The cellular, molecular and ionic basis of GABAA receptor signalling. Prog Brain Res. 2007;160:59–87. doi: 10.1016/S0079-6123(06)60005-8. [DOI] [PubMed] [Google Scholar]
- Farrant M, Nusser Z. Variations on an inhibitory theme: phasic and tonic activation of GABAA receptors. Nat Rev Neurosci. 2005;6:215–229. doi: 10.1038/nrn1625. [DOI] [PubMed] [Google Scholar]
- Fatt P, Katz B. Spontaneous subthreshold activity at motor nerve endings. J Physiol. 1952;117:109–128. [PMC free article] [PubMed] [Google Scholar]
- Ferrini F, Trang T, Mattioli TA, Laffray S, Del'Guidice T, Lorenzo LE, Castonguay A, Doyon N, Zhang W, Godin AG, Mohr D, Beggs S, Vandal K, Beaulieu JM, Cahill CM, Salter MW, De Koninck Y. Morphine hyperalgesia gated through microglia-mediated disruption of neuronal Cl− homeostasis. Nat Neurosci. 2013;16:183–192. doi: 10.1038/nn.3295. [DOI] [PMC free article] [PubMed] [Google Scholar]
- Friedel P, Bregestovski P, Medina I. Improved method for efficient imaging of intracellular Cl− with Cl− sensor using conventional fluorescence setup. Front Mol Neurosci. 2013;6:7. doi: 10.3389/fnmol.2013.00007. [DOI] [PMC free article] [PubMed] [Google Scholar]
- Glykys J, Dzhala VI, Kuchibhotla KV, Feng G, Kuner T, Augustine G, Bacskai BJ, Staley KJ. Differences in cortical versus subcortical GABAergic signaling: a candidate mechanism of electroclinical uncoupling of neonatal seizures. Neuron. 2009;63:657–672. doi: 10.1016/j.neuron.2009.08.022. [DOI] [PMC free article] [PubMed] [Google Scholar]
- Glykys J, Dzhala V, Egawa K, Balena T, Saponjian Y, Kuchibhotla KV, Bacskai BJ, Kahle KT, Zeuthen T, Staley KJ. Local impermeant anions establish the neuronal chloride concentration. Science. 2014;343:670–675. doi: 10.1126/science.1245423. [DOI] [PMC free article] [PubMed] [Google Scholar]
- Grimley JS, Li L, Wang W, Wen L, Beese LS, Hellinga HW, Augustine GJ. Visualization of synaptic inhibition with an optogenetic sensor developed by cell-free protein engineering automation. J Neurosci. 2013;33:16297–16309. doi: 10.1523/jneurosci.4616-11.2013. [DOI] [PMC free article] [PubMed] [Google Scholar]
- Hamann M, Rossi DJ, Attwell D. Tonic and spillover inhibition of granule cells control information flow through cerebellar cortex. Neuron. 2002;33:625–633. doi: 10.1016/S0896-6273(02)00593-7. [DOI] [PubMed] [Google Scholar]
- Hanchar HJ, Dodson PD, Olsen RW, Otis TS, Wallner M. Alcohol-induced motor impairment caused by increased extrasynaptic GABAA receptor activity. Nat Neurosci. 2005;8:339–345. doi: 10.1038/nn1398. [DOI] [PMC free article] [PubMed] [Google Scholar]
- Hirano T. Depression and potentiation of the synaptic transmission between a granule cell and a Purkinje cell in rat cerebellar culture. Neurosci Lett. 1990;119:141–144. doi: 10.1016/0304-3940(90)90818-T. [DOI] [PubMed] [Google Scholar]
- Isope P, Barbour B. Properties of unitary granule cell→Purkinje cell synapses in adult rat cerebellar slices. J Neurosci. 2002;22:9668–9678. doi: 10.1523/JNEUROSCI.22-22-09668.2002. [DOI] [PMC free article] [PubMed] [Google Scholar]
- Isope P, Franconville R, Barbour B, Ascher P. Repetitive firing of rat cerebellar parallel fibres after a single stimulation. J Physiol. 2004;554:829–839. doi: 10.1113/jphysiol.2003.056523. [DOI] [PMC free article] [PubMed] [Google Scholar]
- Jabaudon D, Shimamoto K, Yasuda-Kamatani Y, Scanziani M, Gähwiler BH, Gerber U. Inhibition of uptake unmasks rapid extracellular turnover of glutamate of nonvesicular origin. Proc Natl Acad Sci U S A. 1999;96:8733–8738. doi: 10.1073/pnas.96.15.8733. [DOI] [PMC free article] [PubMed] [Google Scholar]
- Kaneda M, Farrant M, Cull-Candy SG. Whole-cell and single-channel currents activated by GABA and glycine in granule cells of the rat cerebellum. J Physiol. 1995;485:419–435. doi: 10.1113/jphysiol.1995.sp020739. [DOI] [PMC free article] [PubMed] [Google Scholar]
- Kim J, Lee S, Tsuda S, Zhang X, Asrican B, Gloss B, Feng G, Augustine GJ. Optogenetic mapping of cerebellar inhibitory circuitry reveals spatially biased coordination of interneurons via electrical synapses. Cell Rep. 2014;7:1601–1613. doi: 10.1016/j.celrep.2014.04.047. [DOI] [PMC free article] [PubMed] [Google Scholar]
- Kim Y, Trussell LO. Negative shift in the glycine reversal potential mediated by a Ca2+- and pH-dependent mechanism in interneurons. J Neurosci. 2009;29:11495–11510. doi: 10.1523/JNEUROSCI.1086-09.2009. [DOI] [PMC free article] [PubMed] [Google Scholar]
- Konnerth A, Llano I, Armstrong CM. Synaptic currents in cerebellar Purkinje cells. Proc Natl Acad Sci U S A. 1990;87:2662–2665. doi: 10.1073/pnas.87.7.2662. [DOI] [PMC free article] [PubMed] [Google Scholar]
- Kreitzer AC, Regehr WG. Modulation of transmission during trains at a cerebellar synapse. J Neurosci. 2000;20:1348–1357. doi: 10.1523/JNEUROSCI.20-04-01348.2000. [DOI] [PMC free article] [PubMed] [Google Scholar]
- Kuner T, Augustine GJ. A genetically encoded ratiometric indicator for chloride: capturing chloride transients in cultured hippocampal neurons. Neuron. 2000;27:447–459. doi: 10.1016/S0896-6273(00)00056-8. [DOI] [PubMed] [Google Scholar]
- Labarrera C, London M, Angelo K. Tonic inhibition sets the state of excitability in olfactory bulb granule cells. J Physiol. 2013;591:1841–1850. doi: 10.1113/jphysiol.2012.241851. [DOI] [PMC free article] [PubMed] [Google Scholar]
- Lee S, Yoon BE, Berglund K, Oh SJ, Park H, Shin HS, Augustine GJ, Lee CJ. Channel-mediated tonic GABA release from glia. Science. 2010;330:790–796. doi: 10.1126/science.1184334. [DOI] [PubMed] [Google Scholar]
- Lillis KP, Kramer MA, Mertz J, Staley KJ, White JA. Pyramidal cells accumulate chloride at seizure onset. Neurobiol Dis. 2012;47:358–366. doi: 10.1016/j.nbd.2012.05.016. [DOI] [PMC free article] [PubMed] [Google Scholar]
- Liu QY, Schaffner AE, Chang YH, Maric D, Barker JL. Persistent activation of GABAA receptor/ Cl− channels by astrocyte-derived GABA in cultured embryonic rat hippocampal neurons. J Neurophysiol. 2000;84:1392–1403. doi: 10.1152/jn.2000.84.3.1392. [DOI] [PubMed] [Google Scholar]
- Llano I, Leresche N, Marty A. Calcium entry increases the sensitivity of cerebellar Purkinje cells to applied GABA and decreases inhibitory synaptic currents. Neuron. 1991;6:565–574. doi: 10.1016/0896-6273(91)90059-9. [DOI] [PubMed] [Google Scholar]
- Maguire J, Mody I. Neurosteroid synthesis-mediated regulation of GABAA receptors: relevance to the ovarian cycle and stress. J Neurosci. 2007;27:2155–2162. doi: 10.1523/JNEUROSCI.4945-06.2007. [DOI] [PMC free article] [PubMed] [Google Scholar]
- Mancuso JJ, Kim J, Lee S, Tsuda S, Chow NB, Augustine GJ. Optogenetic probing of functional brain circuitry. Exp Physiol. 2011;96:26–33. doi: 10.1113/expphysiol.2010.055731. [DOI] [PubMed] [Google Scholar]
- Mitchell SJ, Silver RA. Shunting inhibition modulates neuronal gain during synaptic excitation. Neuron. 2003;38:433–445. doi: 10.1016/S0896-6273(03)00200-9. [DOI] [PubMed] [Google Scholar]
- Mody I, Pearce RA. Diversity of inhibitory neurotransmission through GABAA receptors. Trends Neurosci. 2004;27:569–575. doi: 10.1016/j.tins.2004.07.002. [DOI] [PubMed] [Google Scholar]
- Nelson LE, Guo TZ, Lu J, Saper CB, Franks NP, Maze M. The sedative component of anesthesia is mediated by GABAA receptors in an endogenous sleep pathway. Nat Neurosci. 2002;5:979–984. doi: 10.1038/nn913. [DOI] [PubMed] [Google Scholar]
- Oleskevich S, Clements J, Walmsley B. Release probability modulates short-term plasticity at a rat giant terminal. J Physiol. 2000;524:513–523. doi: 10.1111/j.1469-7793.2000.00513.x. [DOI] [PMC free article] [PubMed] [Google Scholar]
- Pond BB, Berglund K, Kuner T, Feng G, Augustine GJ, Schwartz-Bloom RD. The chloride transporter Na+-K+- Cl− cotransporter isoform-1 contributes to intracellular chloride increases after in vitro ischemia. J Neurosci. 2006;26:1396–1406. doi: 10.1523/JNEUROSCI.1421-05.2006. [DOI] [PMC free article] [PubMed] [Google Scholar]
- Pugh JR, Jahr CE. Axonal GABAA receptors increase cerebellar granule cell excitability and synaptic activity. J Neurosci. 2011;31:565–574. doi: 10.1523/JNEUROSCI.4506-10.2011. [DOI] [PMC free article] [PubMed] [Google Scholar]
- Quirk K, Gillard NP, Ragan CI, Whiting PJ, McKernan RM. Model of subunit composition of γ-aminobutyric acid A receptor subtypes expressed in rat cerebellum with respect to their α and γ/δ subunits. J Biol Chem. 1994;269:16020–16028. [PubMed] [Google Scholar]
- Rossi DJ, Hamann M. Spillover-mediated transmission at inhibitory synapses promoted by high affinity α6 subunit GABAA receptors and glomerular geometry. Neuron. 1998;20:783–795. doi: 10.1016/S0896-6273(00)81016-8. [DOI] [PubMed] [Google Scholar]
- Rossi DJ, Hamann M, Attwell D. Multiple modes of GABAergic inhibition of rat cerebellar granule cells. J Physiol. 2003;548:97–110. doi: 10.1113/jphysiol.2002.036459. [DOI] [PMC free article] [PubMed] [Google Scholar]
- Santhakumar V, Hanchar HJ, Wallner M, Olsen RW, Otis TS. Contributions of the GABAA receptor α6 subunit to phasic and tonic inhibition revealed by a naturally occurring polymorphism in the α6 gene. J Neurosci. 2006;26:3357–3364. doi: 10.1523/JNEUROSCI.4799-05.2006. [DOI] [PMC free article] [PubMed] [Google Scholar]
- Saxena NC, Macdonald RL. Properties of putative cerebellar γ-aminobutyric acidA receptor isoforms. Mol Pharmacol. 1996;49:567–579. [PubMed] [Google Scholar]
- Semyanov A, Walker MC, Kullmann DM, Silver RA. Tonically active GABAA receptors: modulating gain and maintaining the tone. Trends Neurosci. 2004;27:262–269. doi: 10.1016/j.tins.2004.03.005. [DOI] [PubMed] [Google Scholar]
- Silver RA, Cull-Candy SG, Takahashi T. Non-NMDA glutamate receptor occupancy and open probability at a rat cerebellar synapse with single and multiple release sites. J Physiol. 1996;494:231–250. doi: 10.1113/jphysiol.1996.sp021487. [DOI] [PMC free article] [PubMed] [Google Scholar]
- Silver RA, Momiyama A, Cull-Candy SG. Locus of frequency-dependent depression identified with multiple-probability fluctuation analysis at rat climbing fibre-Purkinje cell synapses. J Physiol. 1998;510:881–902. doi: 10.1111/j.1469-7793.1998.881bj.x. [DOI] [PMC free article] [PubMed] [Google Scholar]
- Sola E, Prestori F, Rossi P, Taglietti V, D'Angelo E. Increased neurotransmitter release during long-term potentiation at mossy fibre-granule cell synapses in rat cerebellum. J Physiol. 2004;557:843–861. doi: 10.1113/jphysiol.2003.060285. [DOI] [PMC free article] [PubMed] [Google Scholar]
- Staley KJ, Proctor WR. Modulation of mammalian dendritic GABAA receptor function by the kinetics of Cl− and HCO3− transport. J Physiol. 1999;519:693–712. doi: 10.1111/j.1469-7793.1999.0693n.x. [DOI] [PMC free article] [PubMed] [Google Scholar]
- Staley KJ, Soldo BL, Proctor WR. Ionic mechanisms of neuronal excitation by inhibitory GABAA receptors. Science. 1995;269:977–981. doi: 10.1126/science.7638623. [DOI] [PubMed] [Google Scholar]
- Stell BM. Biphasic action of axonal GABAA receptors on presynaptic calcium influx. J Neurophysiol. 2011;105:2931–2936. doi: 10.1152/jn.01125.2010. [DOI] [PubMed] [Google Scholar]
- Stell BM, Brickley SG, Tang CY, Farrant M, Mody I. Neuroactive steroids reduce neuronal excitability by selectively enhancing tonic inhibition mediated by δsubunit-containing GABAA receptors. Proc Natl Acad Sci U S A. 2003;100:14439–14444. doi: 10.1073/pnas.2435457100. [DOI] [PMC free article] [PubMed] [Google Scholar]
- Stell BM, Rostaing P, Triller A, Marty A. Activation of presynaptic GABAA receptors induces glutamate release from parallel fiber synapses. J Neurosci. 2007;27:9022–9031. doi: 10.1523/JNEUROSCI.1954-07.2007. [DOI] [PMC free article] [PubMed] [Google Scholar]
- Tanaka K, Khiroug L, Santamaria F, Doi T, Ogasawara H, Ellis-Davies GC, Kawato M, Augustine GJ. Ca2+ requirements for cerebellar long-term synaptic depression: role for a postsynaptic leaky integrator. Neuron. 2007;54:787–800. doi: 10.1016/j.neuron.2007.05.014. [DOI] [PubMed] [Google Scholar]
- Trigo FF, Marty A, Stell BM. Axonal GABAA receptors. Eur J Neurosci. 2008;28:841–848. doi: 10.1111/j.1460-9568.2008.06404.x. [DOI] [PubMed] [Google Scholar]
- Vincent P, Marty A. Fluctuations of inhibitory postsynaptic currents in Purkinje cells from rat cerebellar slices. J Physiol. 1996;494:183–199. doi: 10.1113/jphysiol.1996.sp021484. [DOI] [PMC free article] [PubMed] [Google Scholar]
- Wall MJ. Furosemide reveals heterogeneous GABAA receptor expression at adult rat Golgi cell to granule cell synapses. Neuropharmacology. 2002;43:737–749. doi: 10.1016/S0028-3908(02)00085-0. [DOI] [PubMed] [Google Scholar]
- Wallner M, Hanchar HJ, Olsen RW. Ethanol enhances α4β3δ and α6β3δ γ-aminobutyric acid type A receptors at low concentrations known to affect humans. Proc Natl Acad Sci U S A. 2003;100:15218–15223. doi: 10.1073/pnas.2435171100. [DOI] [PMC free article] [PubMed] [Google Scholar]