

Abstract
Microglia, the principal resident immune cell of the CNS, exert significant influence on neurons during development and in pathological situations. However, if and how microglia contribute to normal neuronal function in the mature uninjured CNS is not well understood. We used the model of the adult mouse retina, a part of the CNS amenable to structural and functional analysis, to investigate the constitutive role of microglia by depleting microglia from the retina in a sustained manner using genetic methods. We discovered that microglia are not acutely required for the maintenance of adult retinal architecture, the survival of retinal neurons, or the laminar organization of their dendritic and axonal compartments. However, sustained microglial depletion results in the degeneration of photoreceptor synapses in the outer plexiform layer, leading to a progressive functional deterioration in retinal light responses. Our results demonstrate that microglia are constitutively required for the maintenance of synaptic structure in the adult retina and for synaptic transmission underlying normal visual function. Our findings on constitutive microglial function are relevant in understanding microglial contributions to pathology and in the consideration of therapeutic interventions that reduce or perturb constitutive microglial function.
SIGNIFICANCE STATEMENT Microglia, the principal resident immune cell population in the CNS, has been implicated in diseases in the brain and retina. However, how they contribute to the everyday function of the CNS is unclear. Using the model of the adult mouse retina, we examined the constitutive role of microglia by depleting microglia from the retina. We found that in the absence of microglia, retinal neurons did not undergo overt cell death or become structurally disorganized in their processes. However, connections between neurons called synapses begin to break down, leading to a decreased ability of the retina to transmit light responses. Our results indicate that retinal microglia contribute constitutively to the maintenance of synapses underlying healthy vision.
Keywords: degeneration, electroretinogram, glia, microglia, retina, synapse
Introduction
Microglia are the principal resident immune cell type in the CNS and are found broadly distributed throughout all CNS regions. Microglia demonstrate highly ramified morphologies and exhibit constitutive dynamism in their processes (Davalos et al., 2005; Nimmerjahn et al., 2005) that bring them into rapid and repeated contact with neurons and macroglia in their vicinity (Wake et al., 2009; Tremblay et al., 2010). In the developing CNS, microglia play important functional roles, regulating neurogenesis (Sierra et al., 2010), neuronal survival (Ueno et al., 2013), axonal growth (Squarzoni et al., 2014), and synapse refinement (Schafer et al., 2012). In the diseased or injured CNS, microglia have been implicated in potentiating, but also alternately providing protection from, neurodegeneration (Hellwig et al., 2013; Rice et al., 2015). However, in the mature healthy CNS, how microglia contribute constitutively to maintaining normal neuronal structure and function is less clear.
Previous studies have found that the specific deletion of microglia-expressed genes (Hoxb8, BDNF) in mature mice have resulted in abnormal behavior (Chen et al., 2010) and learning deficits (Parkhurst et al., 2013), implicating a requirement for constitutive microglial function. However, experiments that ablate microglia in adult mice have described varying effects on cognitive behavior (Parkhurst et al., 2013; Elmore et al., 2014); ablation via pharmacological inhibition of CSF1R signaling for up to 2 months reported no detectable brain abnormalities, or any motor or cognitive deficits (Elmore et al., 2014), whereas ablation using a genetic model led to decreased cognitive function (Parkhurst et al., 2013). As such, whether microglia in the mature CNS are dispensable for normal function, or if they are similarly required in different CNS regions, remain uncertain. As potential therapies aimed at inhibiting or eliminating microglia in CNS disorders are under current development, (Cartier et al., 2014; Karlstetter et al., 2015), elucidating the endogenous roles of microglia will be a key consideration in evaluating the risk versus benefit of these approaches.
The retina is an approachable part of the sensory CNS and a model system in which the contributions of microglia in maintaining mature systems can be optimally investigated. The retina possesses a laminar organization in which neuronal cell types and their intervening synaptic connections are organized in defined layers; retinal microglia are similarly distributed in a laminar way with their dynamic processes positioned in the retinal plexiform layers. Easily accessed in vivo through a dilated pupil, the retina can be structurally evaluated in a noninvasive manner at high resolution using optical coherence tomography (OCT) imaging. The assessment of visual function in the retina can also be performed quantitatively and objectively using electroretinography, permitting the functional contribution of retinal microglia to be assessed.
In the current study, we have used the transgenic CX3CR1CreER mouse (Parkhurst et al., 2013; Bruttger et al., 2015) to genetically ablate microglia in the adult retina in a sustained manner to discover the contribution of microglia to structure and function of the adult retina. We discovered that sustained microglial depletion for over 1 month did not influence overall retinal structure, the survival of retinal neurons, or the organization of neuronal dendritic and axonal compartments. Functionally, although mice with retinas devoid of microglia remain visually able, we observed a progressive decline in the magnitude of electroretinographic responses to light stimuli that was associated with ultrastructural evidence of synaptic degeneration. Our findings reveal a constitutive role for retinal microglia in the mature retina for the maintenance of synaptic structure and visual function and implicate a continued postdevelopment requirement for microglial function even in the absence of insult or injury.
Materials and Methods
Experimental animals.
Transgenic mice in which the CX3CR1 gene was replaced by a sequence encoding a mutant Cre protein with a tamoxifen (TAM)-dependent estrogen ligand-binding domain (CX3CR1CreER; Parkhurst et al., 2013) were found to harbor the rd8 mutation in the Crb1 gene by genotyping analysis (Mattapallil et al., 2012). These were crossed with C57BL/6J wild-type animals (Jackson Laboratories) to generate CX3CR1CreER transgenic animals lacking the rd8 mutation. These resulting animals were then crossed with mice containing a flox-STOP-flox diphtheria toxin subunit α (DTA) gene cassette in the ROSA26 locus (The Jackson Laboratory, no. 009669; Rosa26-flox-STOP-flox-DTA mice; Voehringer et al., 2008). Mice heterozygous for CX3CR1CreER and for the flox-STOP-flox DTA gene (designated as “TG” mice) were used. Depletion of CX3CR1-expressing microglia in TG mice was enabled by the activation of Cre recombinase upon tamoxifen administration; adult 2- to 3-month-old TG mice were administered with tamoxifen dissolved in corn oil (Sigma-Aldrich; 500 mg/kg dose of a 20 mg/ml solution) via oral gavage as previously described (Parkhurst et al., 2013). The ocular deposition of TAM-related crystals was not noted in the retina or choroid in any of the experimental animals examined on in vivo imaging or on histologic analysis. Age-matched control TG animals were administered corn oil without added TAM. Wild-type (WT) C57BL/6J mice and nondepleted TG animals were used as controls. As no retinal functional or morphological differences between male and female TG mice were observed with microglial depletion, animals of either sex were used. All experiments were conducted according to protocols approved by a local Institutional Animal Care and Use Committee and adhered to the Association for Research in Vision and Ophthalmology Statement animal use in ophthalmic and vision research.
Tissue preparation for light and electron microscopy analysis.
Following deep anesthesia with intraperitoneal injection of ketamine (90 mg/kg) and xylazine (8 mg/kg), mice were perfused with Ringer's solution followed by a fixative containing 2.5% paraformaldehyde + 2.5% glutaraldehyde in 0.1 m sodium cacodylate buffer, pH 7.4 (Electron Microscopy Sciences). Following enucleation, eyes were incised at the cornea with a scalpel and returned to primary fixative for 24 h at 4°C. Following removal of the anterior segment and lens by dissection, retinas were collected and washed in 0.1 m sodium cacodylate buffer and fixed for 1 h in 2% buffered osmium tetroxide on ice in a dark container. Following repeated washes in distilled water at 4°C and dehydration in a graded ethanol, retinas were infiltrated in mixtures of Epon 812 resin (Electron Microscopy Sciences) and propylene oxide (as follows: 1:2 for 2 h, 1:1 for 4 h, 2:1 for overnight) and in pure resin for 24 h. Finally, retinas were embedded in freshly prepared resin at 60°C for 24–48 h. One-micrometer-thick sections were stained with 1% toluidine blue, imaged under light microscopy (AxioCam HR microscope camera, Carl-Zeiss Microscopy), and oriented to achieve optimally transverse 70-nm-thick ultrasections, which were collected on Formvar-coated copper grids (Electron Microscopy Sciences). Grids were stained with 2% aqueous uranyl acetate and Reynolds lead citrate, and viewed on a JEOL USA 1200 TEM at 60 kV. Digital images were acquired at 8000× to 30,000× magnifications by AMT software (Advanced Microscopy Techniques).
Immunohistochemistry and TUNEL of retinal tissue.
Mice were euthanized by CO2 inhalation and their eyes removed. Enucleated eyes were dissected to form posterior segment eye-cups which were then fixed in 4% paraformaldehyde in PBS for 2–4 h at 4°C. Eyecups were either processed for vibratome sectioning (100-μm-thick sections, VT1000, Leica) or dissected to form retinal flat-mounts. Flat-mounted retinas or retinal sections were blocked for 1 h in blocking buffer containing 6% normal goat serum and 0.5% Triton X-100 in PBS at room temperature. Primary antibodies (Table 1) were diluted in blocking buffer and applied overnight for sections and for 48 h for flat-mounts at 4°C on a shaker. Experiments in which primary antibodies were omitted served as negative controls. After washing in 1× PBS with 0.5% Triton X-100, sections were incubated overnight with secondary antibodies [AlexaFluor 488- or 568-conjugated donkey anti-rabbit, goat, mouse, guinea pig, or rat IgG, respectively, and DAPI (1:500; Sigma-Aldrich)] to label cell nuclei. Isolectin B4, conjugated to AlexaFluor 568 (1:100, Life Technologies), and peanut agglutinin (PNA) conjugated to AlexaFluor 488 (1:1000, Sigma-Aldrich) were used as an additional marker for retinal endothelial cells and cone outer segments, respectively. Apoptosis of retinal cells were assayed using a terminal deoxynucleotidyl transferase-mediated biotinylated UTP nick end labeling (TUNEL) assay (Roche) according to the manufacturer's specifications.
Table 1.
List of the primary antibodies, working dilution, and source, related to experimental procedures
| Antigen | Host | Working dilution | Source (catalog #) |
|---|---|---|---|
| Brain-specific homeobox/POU domain protein 3A (Brn3a) | Goat | 1:100 | Santa Cruz Biotechnology (sc-31984) |
| Calbindin D-28k | Rabbit | 1:500 | Swant (CB38a) |
| Cluster of differentiation molecule 11b (CD11b) | Rat | 1:200 | AbD Serotec (MCA711) |
| ChAT | Goat | 1:500 | Millipore (AB144P) |
| Cone arrestin | Rabbit | 1:800 | Millipore (AB15282) |
| GFAP | Rat | 1:800 | Invitrogen (13-0300) |
| Green fluorescent protein (GFP) | Chicken | 1:400 | Aves (GFP-1020) |
| Glutamine synthetase (GS) | Mouse | 1:200 | Millipore (MAB302) |
| Ionized calcium-binding adapter molecule 1 (Iba1) | Rabbit | 1:500 | Wako (019-19741) |
| NDMA receptor subunit 2A (NMDAR2A) | Rabbit | 1:40 | Novus Biologicals (NB300-105) |
| Protein kinase Cα (PKC-α) | Rabbit | 1:1000 | Sigma-Aldrich (P4334) |
| PSD-95 | Mouse | 1:200 | Calbiochem (CP35) |
| Receptor accessory protein 6 (Reep6) | Rabbit | 1:1000 | Gift from Dr Anand Swaroop (National Eye Institute, Bethesda, MD) |
| C-terminal-binding protein-2 (CtBP2, Ribeye) | Mouse | 1:200 | BD Transduction Laboratories (612044) |
| VGlut1 | Guinea pig | 1:1000 | Millipore (AB5905) |
Imaging and analysis of retinal flat-mounts and sections.
Stained retinal sections and flat-mounts were imaged with confocal microscopy (FluoView 1000, Olympus). To generate high-magnification images, multiplane z-series were collected using a 40× oil-immersion objective; each z-series spanned 20 μm in depth, with each section spaced 1 μm apart. Confocal image stacks were viewed and analyzed with FV100 Viewer Software (Olympus) and ImageJ (NIH). To analyze microglial distributions over the entire retina, tiled images of retinal flat-mounts were obtained under a 10× objective using epifluorescence microscopy and stitched together with image analysis software (AxioImager Z1, Carl-Zeiss Microscopy); counts of microglial numbers over the entire area of the retina were tallied and averaged. To determine the density of various retinal cell types, cell counts were performed in imaging fields taken in flat-mounted retina at an eccentricity midway between the optic nerve and the retinal periphery under a 40× objective using confocal microscopy. Four separate imaging fields were obtained from each flat-mounted retinal sample. Cell counts were obtained using computer-assisted algorithms (NIH ImageJ) followed by manual verification.
In vivo OCT imaging of the retina.
Retinal structure was assessed in anesthetized experimental animals using OCT imaging (Bioptigen) performed through a dilated pupil. OCT images were obtained using the Envisu R2200-HR SD-OCT device (Bioptigen). Horizontal and vertical linear scans (1.4 mm width, 1000 A-scans/B-scan, average of 20 frames/B-scan) were obtained with the scan centered on the optic nerve head. In addition, volume scans of 1.4 × 1.4 mm centered on the optic nerve (1000 A-scans/horizontal B-scan, 33 horizontal B-scans, average of 3 frames/B-scan, each spaced 0.0424 mm apart) were captured in addition. Retinal thickness measurements in each quadrant of a circular grid of diameter 1.2 mm were computed using the manufacturer's software. OCT retinal thickness measurements of TG-depleted and TG control animals were compared using a two-way ANOVA. Measurements for a subset of TG animals whose retinal thicknesses were measured before and after microglial depletion were compared using a paired t test.
Measurement of optokinetic response.
Optokinetic responses of awake, behaving mice to visual stimuli in the form of a moving grating were measured using a custom-designed apparatus (Kretschmer et al., 2015). Optokinetic responses were measured in TG control (without TAM administration) and TG-depleted (following 30 d of microglial depletion with TAM administration; n = 4 animals in each condition). Mice were positioned on a platform and presented with sinusoidal gratings at maximum contrast at spatial frequencies of 0.025, 0.05, 0.1, 015, 0.2, 0.25, 0.3, 0.35, 0.4, 0.425, and 0.45 cycles/degree at a stimulus speed of 12°/s on four LCD screens that surround the tested animal. Stimuli presentation was controlled using a modified version of an open source software program to produce a virtual cylinder that maintains a constant distance between the grating and horizontal visual field of the tested animal located at the center of the apparatus.
To measure elicited optokinetic motor reflexes (OMRs), the head movements of the unrestrained tested animal were video-recorded by a camera placed above the animal and analyzed by an algorithm that tracks the position of the mouse's head. These data are used to automatically readjust the presentation of the stimuli to changing head positions to keep the size of the gratings constant (the analysis software used, OmrArena, was modified from a version previously published; Kretschmer et al., 2013). OMR measurements were objectively obtained using an automated approach during off-line analysis and do not involve subjective grading or input from a human observer. OMR tracking behavior was quantified as the ratio of the total amount of time the animal's head moved in the stimulus direction and the amount of time where the head moved against the stimulus direction (Tcorrect/Tincorrect). Each animal was measured under each condition five times for 1 min. OMR was recorded under photopic (9 × 10¹⁰ Q · s/cm2) and scotopic (9 × 10⁸ Q · s/cm2) light conditions.
Electroretinographic analysis.
Electroretinographs (ERGs) were recorded using an Espion E2 system (Diagnosys). Mice were dark adapted overnight and prepared for recording in darkness under dim-red illumination. Mice were anesthetized with intraperitoneal ketamine (90 mg/kg) and xylazine (8 mg/kg), and were topically administered tropicamide (1%, Alcon) and phenylephrine (2.5%, Alcon) for pupillary dilation and proparacaine hydrochloride (0.5%, Alcon) for topical anesthesia. Flash ERG recordings were obtained simultaneously from both eyes with gold wire loop electrodes, with the reference electrode placed in the mouth and the ground subdermal electrode at the tail. ERG responses were obtained at increasing light intensities over the ranges of 1 × 10⁻⁴ to 10 cd · s/m2 under dark-adapted conditions, and 0.3–100 cd · s/m2 under a background light that saturates rod function. The stimulus interval between flashes varied from 5 s at the lowest stimulus strengths to 60 s at the highest ones. Two to 10 responses were averaged depending on flash intensity. ERG signals were sampled at 1 kHz and recorded with 0.3 Hz low-frequency and 300 Hz high-frequency cutoffs. Analysis of a-wave and b-wave amplitudes was performed using customized Espion ERG Data Analyzer software (v2.2) that digitally filters out high-frequency oscillatory potential wavelets. The a-wave amplitude was measured from the baseline to the negative peak and the b-wave was measured from the a-wave trough to the maximum positive peak. ERGs were recorded before and after microglial depletion. The a- and b-wave measurements, and b- and a-wave ratios of TG-depleted and TG control animals were compared using a two-way ANOVA.
Gene expression analysis.
For whole transcriptome analysis, both retinas were collected from: adult (3-month-old) TG mice gavaged with corn oil without TAM, and TG mice depleted of microglia with continuous administration of TAM in corn oil for 15 and 30 d (n = 3 animals in each group). Additional controls included WT mice gavaged with corn oil with TAM (n = 3) and two WT animals without gavage (n = 2). After harvesting, all samples were frozen before RNA extraction using Qiagen RNA mini kit with RNase free DNas1 digestion. RNA quality and quantity were evaluated using BioAnalyzer 2100 with RNA 6000 Nano Kit (Agilent Technologies). RNA-seq libraries were constructed from 1 μg of total RNA using a modified TruSeq RNA Sample preparation kit protocol as previously described (Roger et al., 2014). Briefly, we used a stranded protocol and performed a single read sequence-by-synthesis of 76 bases length using TruSeq SBS v5 reagents on Genetic Analyzer IIx running SCS2.9 software (Illumina). Pass-filtered reads were mapped using TopHat v2.0.11 (Trapnell et al., 2009) and aligned to NCBI mouse reference genome Build 38/mm10. Count table of the gene features was obtained using HT-Seq. EdgeR was used to compute differential expression analysis and to calculate FPKM values (fragments per kilobase of exon per million fragments mapped). An FPKM filtering cutoff of 0.5 in at least one of the 14 samples was applied. An adjusted p value ≤0.05 was considered significant and a cutoff of fold-change of 2 was applied to identify differentially expressed isoforms.
Expression of mRNA was quantitated using quantitative reverse transcription-PCR (qRT-PCR). Cells in retina tissue dissected from experimental eyes were lysed by trituration and homogenized using QIAshredder spin columns (Qiagen). Total RNA was isolated using the RNeasy Mini kit (Qiagen) according to the manufacturer's specifications. First-strand cDNA synthesis from mRNA was performed using qScript cDNA SuperMix (Quanta Biosciences) using oligo-dT as primer. qRT-PCR was performed using a SYBR green RT-PCR kit (Affymetrix), using the 7900HT Fast Real-Time PCR System (Applied Biosystems) under the following conditions: denaturation at 95°C for 5 min, followed by 40 cycles of 95°C for 10 s, and then 60°C for 45 s. Threshold cycle (CT) values were calculated, and expressed as fold-induction determined using the comparative CT (2ΔΔCT) method. Ribosomal protein S13 (RPS13) was used as an internal control. Oligonucleotides used were as follows (gene, forward sequence, reverse sequence): S13: CCTCCCCGAGGATCTCTAC, GAGCAGAGGCTGTGGATGAC; IL6: GAGTCCTTCAGAGAGATACAG, CTAGGTTTGCCGAGTAGATC; IL1β: GCTGGAGAGTGTGGATCCC, GACACGGATTCCATGGTGAAG; TNFα: CCAGGAGAAAGTCAACCTCC, GAGCAATGACTCCAAAGTAGAC; Iba1: CCCACCTAGAGCTGAAGAG, CAGGGCAGCTCGGAGATAG; CD11b: GCAGGAGTCGTATGTGAGG, TTACTGAGGTGGGGCGTCT; CX3CR1: GTTGCCTCAACCCCTTTATCT, CAGGAGAGACCCATCTCCC; P2RY12: GTTCTACGTGAAGGAGAGCA, CTACATTGGGGTCTCTTCGC; P2RY13: CTGTAGGTTAGAAAACCAGCTG, CAGGCTAGGGTGATGTTGTC; CSF1R: CTCCTCCAGGAGCAGGCC, GAACTGGTAGTTGTTAGGCTG; TMEM119: GGTCACTGAAGAGAAGCTGG, CTCTGTTGCAGGCACAGGG; Siglech: CAGCCCATGTCTCTGGAAG, CTAATCCATGACAGCGTGTG; GFAP: CCAGGATCTACTCAACGTTAAG, GCATCTCCACAGTCTTTACCAC, Vimentin: CAGGAAGCTGCTGGAAGGC, GGTCATCGTGATGCTGAGAAG; S100A6: GGAAGGTGACAAGCACACCC, CAGAGCTTCATTGTAGATCAAAG.
Results
Efficient inducible depletion of retinal microglia in adult CX3CR1-CreER: Rosa26-flox-STOP-flox-DTA (TG) mice
Adult 2-month-old TG mice demonstrated no apparent abnormalities in retinal development, and were similar in terms of retinal structure, lamination, and thickness relative to age-matched WT C57BL/6 mice (Fig. 1A,B). In the retinas of TG mice, microglial cells in terms of their laminar distribution (Fig. 1C), morphology (Fig. 1D), density (Fig. 1E), and size of dendritic arbors (Fig. 1F), also resembled those in WT animals, indicating the absence of Cre-mediated effects when tamoxifen was not administered. Beginning at 2 to 3 months of age, young adult TG mice were administered oral TAM dosed on a fixed schedule (Fig. 2A) for up to 35 d. Depletion of almost all retinal microglia, assessed by immunostaining for the microglia marker, Iba1, was achieved following two initial oral doses of tamoxifen given 1 d apart (specified here as Day −2 and Day 0), and maintained at near complete (>95% depleted) levels for up to Day 35 (Fig. 2B,C). This level of depletion was similar to that achieved in previous reports using other genetic or pharmacological models (Parkhurst et al., 2013; Elmore et al., 2014). Microglial-specific expression of DTA induced by tamoxifen resulted in elimination of microglial cells, rather than simply decreasing microglial Iba1 expression, as evidenced by the absence of immunohistochemical staining for other microglial markers CD11b and EYFP (the gene encoding CreER in CX3CR1CreER transgenic mice is followed by a IRES-EYFP element; (Fig. 2D). Quantification of mRNA expression levels of multiple microglial-specific and microglial-associated genes using next generation sequencing (NGS) and real-time PCR analysis demonstrated significant decreases at days 15 and 30 in the depletion regimen (Fig. 2E). Some of these microglia-associated transcripts were similarly decreased in the brain in a pharmacological model of microglial depletion (Elmore et al., 2014). These findings indicated that tamoxifen administration in TG animals was able to effect a rapid, comprehensive, and sustained elimination of microglia in the adult retina.
Figure 1.
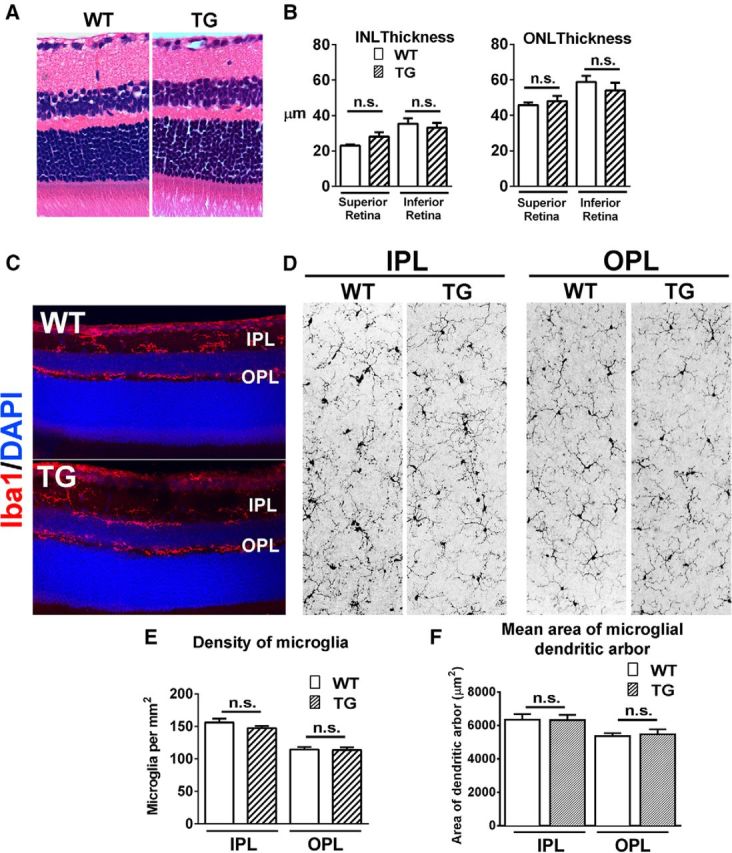
Adult TG mice demonstrate normal retinal thickness and lamination and normal microglial morphology and distribution. H&E-stained paraffin sections of 2-month-old adult C57BL/6J WT and TG mice, demonstrate similar retinal structure and lamination (A), and have no significant differences in inner nuclear layer (INL) and outer nuclear layer (ONL) thicknesses (B). Microglia in the retina of animals of both genotypes demonstrated a similar laminar distribution of Iba1+ (red) microglia in the IPL and OPL (C). En face inspection of Iba1+ retinal microglia in flat-mounted retina demonstrates similar ramified morphologies in the IPL and OPL layers (D), with similar mean densities in the plexiform layers (E) and similar mean size of individual microglial dendritic arbors. Graphical data are represented as mean ± SEM; data from three female animals in each group in B and E, from four female animals in F. (n.s. indicates comparisons for which p > 0.05, unpaired t test with Welch's correction).
Figure 2.

Induction of DTA expression in CX3CR1-expressing cells in TG mice results in complete and sustained depletion retinal microglia. A, TAM was administered orally to TG mice to induce CreER-mediated expression of DTA in microglia per the following schedule: two initial doses of TAM 1 d apart (500 mg/kg per oral dose) at Day −2 and Day 0, followed by an equal repeated dose every 5 d (Day 5, Day 10, etc) up to Day 35. B, Flat-mounted retinas from TAM-administered TG mice were immunostained for Iba1 to determine the presence and density of retinal microglia; insets show expanded views in the boxed areas. In control TG mice, which were administered corn oil without TAM (TG Control), retinal microglia were present throughout the retina in the normal distribution. In TAM-administered TG mice, Iba1+ microglia at Day 10 were absent in most retinal areas, with only isolated rare Iba1+ cells detected (inset). Near-complete depletion of retinal microglia was sustained by repeated TAM administration up to Day 35. C, Quantification of total number of retinal microglia indicated that although microglial numbers were similar between WT and TG Control animals, TAM-administered TG animals resulted in sustained and near-complete depletion (>95%) for up to 30 d (data are represented as mean ± SEM; n = 3 female 8-week-old animals at each group; *p < 0.05 on one-way ANOVA with Dunnett's multiple-comparisons test). D, Immunohistochemical localization of microglia performed with antibodies to CD11b (red),EYFP (green), and Iba1 (blue) confirmed microglial depletion across all retinal areas; the panels show a rare residual microglial cell that was typically immunopositive for all three markers. Scale bar, 40 μm. E, mRNA expression levels were assessed using NGS and separately verified by RT-PCR in independent replicates. Comparisons were made between TG mice gavaged with corn oil without TAM (TG Control), and animals depleted of microglia with continuous administration of TAM in corn oil for 15 and 30 d. Levels of microglia-expressed genes were significantly reduced in general, indicating microglial depletion. (Graphical data are represented as mean ± SEM; *indicates comparisons with control for which p < 0.05, one-way ANOVA, n = 3 male, 8-week-old animals per group).
Sustained microglia depletion does not result in generalized retinal atrophy and disorganization
In the developing brain, microglia have been implicated in providing neurotrophic support (Ueno et al., 2013) and provide safeguards against neural injury in a number of in vitro (Montero et al., 2009; Vinet et al., 2012) and in vivo (Lalancette-Hébert et al., 2007; Mirrione et al., 2010) models. However, their role in providing constitutive support to the mature retina in the absence of injury is not known. Using in vivo OCT imaging, we examined the effect of sustained microglial depletion (30 d) on the retinas of TG animals by comparing them with nondepleted control animals. We observed that the overall structure of the retina, in terms of its laminar organization and anatomical features (Fig. 3A), as well as overall retina thickness measurements (Fig. 3B), were similar between depleted retinas and nondepleted controls. No generalized defects or obscuration was noted in any of the retinal nuclear or plexiform layers, or in the sublamina in the outer retina, corresponding with the normal appearance of the WT C57BL6 mouse. In a subset of experimental animals, OCT retinal thickness measurements were obtained before and following microglial depletion for 30 d; these measurements similarly failed to reveal significant changes in the same animals following depletion (n = 6 eyes of 3 animals, p > 0.05 for comparisons at all retinal loci, paired t test).
Figure 3.

Effect of retinal microglial depletion on retinal lamination, cell survival, and vascular structure. A, In vivo OCT assessment demonstrating horizontal linear spectral domain OCT retinal scans of control transgenic mice (TG Control) and transgenic mice following microglial depletion for 30 d (TG-depleted 30 d); insets show magnified view of retinal lamination and thickness. Overall retinal structure was preserved following sustained depletion, with clear definition of all retinal lamina at all retinal loci within the central 1.4 × 1.4 mm imaging field. INL, Inner nuclear layer; ONL, outer nuclear layer; ELM, external limiting membrane; IS/OS, junction between the inner and outer segment of the photoreceptors; RPE, retinal pigment epithelium complex. B, Mean retinal thickness in retinal areas as defined by a circular grid with concentric retinal areas centered on the optic nerve were computed. Mean retinal thickness in areas between 100 and 300 μm radial to the optic nerve (pink areas) and between 300 and 600 μm radial to the optic nerve (yellow areas) were similar between TG Control and TG Depleted, considering all four quadrants (superior, inferior, temporal, and nasal; data are represented as mean ± SEM; n = 12 eyes in 6 female TG Control animals, 16 eyes in 8 TG Depleted female animals; p = 0.18, two-way ANOVA). C, Comparison of DAPI-labeled retinal sections from adult (2- to 3-month-old) female WT C57BL6 mice, control TG mice (TG Control), and TG mice depleted of microglia for 30 d (TG Depleted 30 d) demonstrated no general atrophy of nuclear layers between groups. Retinal cell apoptosis was assessed in retinal sections using a TUNEL assay (red); TUNEL-positive cells were absent in all retinal layers in all experimental groups. Retina sections from a postnatal day (P)25 rd10 mouse retina containing apoptotic rod photoreceptors were used as a positive control. Scale bar, 50 μm. D, Labeling of retinal vasculature using isolectin-B4 (IB4) demonstrated no significant changes in TG Depleted retinas relative to WT and TG control retinas in terms of: (1) vascular patterning in retinal flat-mounts (top; insets show boxed areas at higher-magnification), and (2) laminar distribution of retinal vasculature in vibratome retinal sections (bottom). Scale bars: top, 1 mm; bottom, 50 μm.
In addition, retinal sections of TG mice depleted of microglial for 30 d were compared with those of age-matched TG nondepleted control and WT (C57BL6) mice. Overt generalized atrophy was not observed in any of the DAPI-labeled nuclear layers in depleted retinas (Fig. 3C); TUNEL failed to detect an emergence of apoptotic cells in any retinal location or layer following depletion. Whereas in the developing retina, microglia had been shown to support retinal vessel growth (Checchin et al., 2006) and guide vascular patterning (Stefater et al., 2011), we did not detect in the adult retina any changes in the general organization, branching structure, or laminar distribution of retinal blood vessels following microglial depletion compared with WT and TG nondepleted controls (Fig. 3D).
Sustained microglia depletion does not result in changes in the numbers and organization of retinal second- and third-order neurons
During development, microglia have been found to play a role in guiding the outgrowth of axons and the positioning of specific subsets of neocortical interneurons in the forebrain (Squarzoni et al., 2014). However, the influence of microglia on the maintenance of interneuron positioning and process distribution in different regions of the adult CNS is less well understood. To examine whether microglia influence somatic and process positioning of neurons in the adult retina, we compared the laminar distribution, dendritic stratification, and density of retinal second- and third-order neurons in depleted retinas with WT and nondepleted TG controls. Retinal ganglion cells, immunolabeled for Brn3a, were correctly localized to the ganglion cell layer following microglial depletion, and were unchanged in cell density relative to WT and TG controls (Fig. 4A,B). In microglial-depleted retinas, starburst amacrine cells immunolabeled with choline acetyltransferase (ChAT) were also similar in their somatic density and distribution in both the GCL and INL, and demonstrated proper lamination of their processes in the ON- and OFF-sublamina of the inner plexiform layer (IPL; Fig. 4C–E). Similar findings were also made for calbindin-immunopositive amacrine cells whose processes retained their sublamination patterns in the IPL (Fig. 4F). Horizontal cells, visualized by calbindin-immunopositivity, demonstrated normal dendritic stratification, somatic density, and dendritic structure (Fig. 4F,G). In PKCα-immunopositive rod bipolar cells of microglial-depleted retina, evidence of abnormal outgrowth or retraction of dendritic or axonal compartments (Fig. 4H) or changes in overall cell density (Fig. 4I) were not detected.
Figure 4.
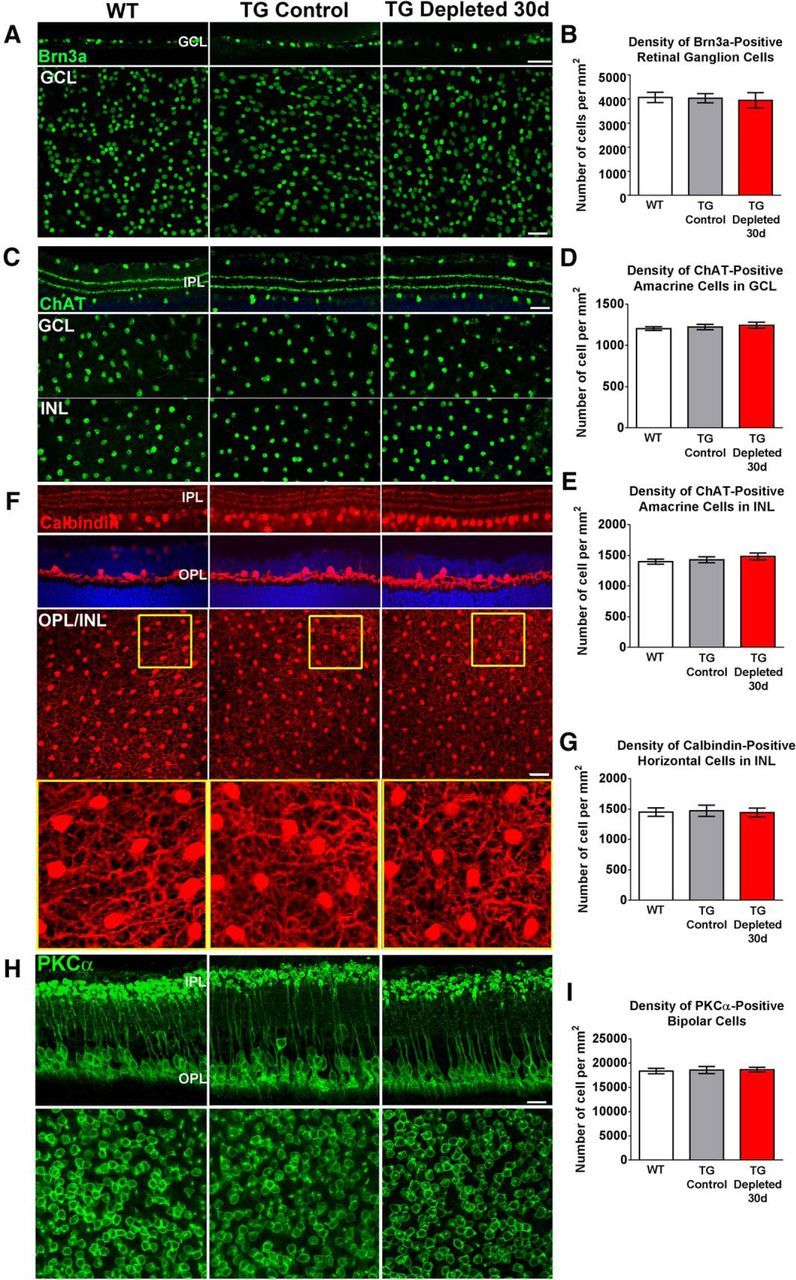
Effect of retinal microglial depletion on density and morphology of retinal neurons: retinal ganglion cells, amacrine cells, horizontal cells, and bipolar cells. A, Brn3a-immunopositive retinal ganglion cells (RGCs) in TG-depleted retinas, relative to WT and TG controls, demonstrated: (1) similar laminar positions in the ganglion cell layer (GCL) in retinal sections (top), and (2) similar somatic densities in flat-mounted retina (bottom). Densities of Brn3a+ RGCs are quantified in B. C, ChAT-immunopositive cholinergic amacrine cells in TG-depleted retinas maintained: (1) normal sublamination in the ON and OFF sublamina of the IPL (top), and (2) similar somatic densities in the GCL and inner nuclear layer (INL) relative to WT and TG controls (bottom). Densities of ChAT+ cells in the GCL and INL are quantified in D and E, respectively. F, Calbindin-immunopositive amacrine cells in all three groups demonstrate preserved sublaminar dendritic stratification in the IPL (top). Calbindin-immunopositive horizontal cells in all three groups show dendritic processes that are confined to the OPL (middle) and have similar somatic densities and dendritic arborizations (bottom; insets show magnified views). Densities of calbindin+ horizontal cells are quantified in G. H, PKCα-immunopositive ON-rod bipolar cells in TG Depleted retinas show similar somatic, dendritic, and axonal morphologies structures relative to WT and nondepleted TG controls. Density of PKCα+ bipolar somata in the ONL (bottom) is quantified in I. Column heights indicate distribution means and error bars indicate SE; n = 12 imaging fields from four animals (2 male and 2 female animals, 8 weeks old) in each of the WT, TG, and TG Depleted 30 d groups. Pairwise comparisons of cell densities between groups for all cell types compared did not reveal significant differences (p > 0.05 for all comparisons, one-way ANOVA with Tukey's multiple-comparisons test). Scale bars, 30 μm.
Sustained microglia depletion does not result in changes in general photoreceptor structure
Retinal microglia, by virtue of their inner retinal distribution, contact photoreceptors primarily via their axonal compartment; in the young adult uninjured retina, the outer region of the retina where photoreceptor somata and outer segments are located is largely devoid of microglia. To discover whether microglial absence influences photoreceptor organization, the structures of rod and cone photoreceptors were examined following microglia depletion for 30 d. Immunohistochemistry for Reep6, a specific marker for rod photoreceptors (Keeley et al., 2013; Hao et al., 2014), demonstrated that TG-depleted retinas showed similar overall rod numbers and organization, as well as outer segment and axonal structures, relative to TG control and WT retinas (Fig. 5A). In cone photoreceptors, outer segment matrix sheaths labeled with the lectin PNA demonstrated normal structures in microglia-depleted retina (Fig. 5B). Cone photoreceptors, whose morphology is shown by cone arrestin immunolabeling, were also unchanged in overall structure and somatic density (Fig. 5C,D) following depletion.
Figure 5.

Effect of retinal microglial depletion on photoreceptor structure. A, Photoreceptor rods, labeled with anti-Reep6 antibody, demonstrated similar numbers and organization across groups. B, Anti-PNA-labeling of cone outer matrix sheaths in the outer nuclear layer (ONL) demonstrated structural similarities in the cone outer segments in all three groups. C, The structures of cone outer segments, somata, and axons, as revealed by immunolabeling with cone arrestin, were also unchanged in TG depleted retinas relative to controls (top). Confocal imaging in a single horizontal plane in the ONL (dotted line) demonstrated similar distribution and density of cone somata (bottom). Density of arrestin+ cone soma is quantified in D. Column heights indicate distribution means and error bars indicate SE; n = 12 imaging fields from four animals (2 male and 2 female animals) in each of the WT, TG, and TG depleted 30 d groups. Pairwise comparisons between groups did not reveal significant differences (p > 0.05 for all comparisons, one-way ANOVA with Tukey's multiple-comparisons test). Scale bar, 20 μm.
Effect of microglial depletion on retinal macroglial populations
Although cellular and molecular interactions between retinal microglia and macroglia populations, consisting of astrocytes and Müller cells, have been characterized following microglial activation (Wang et al., 2011, 2014), the nature of constitutive interactions between these cell populations in the adult uninjured retina is unknown. NGS sequencing demonstrates that mRNA expression of glial fibrillary acidic protein (GFAP), a molecule associated with macroglial gliosis, was significantly increased 1.3- and 1.6-fold at days 15 and 30 of depletion (all p < 0.0001, n = 3 animals); qRT-PCR showed a similar trend (Fig. 6A). mRNA expression of S100A6 and vimentin, markers of astrocytic and Müller cell activation, were also slightly but significantly increased, whereas that of S100B was unchanged. However, immunohistochemical analysis at Day 30 of GFAP-labeled retinal astrocytes in the retinal ganglion cell layer demonstrated little change in overall cellular density or in the morphologic structure of their processes. Labeling of Müller cells with glutamine synthetase also did not demonstrate depletion-related changes in the structure and density of Müller cell end-feet in the inner limiting membrane (Fig. 6A) or in the overall structure of their radial processes (Fig. 6B). There was also no upregulation of GFAP immunopositivity in the radial processes of Müller cells typically of Müller cell gliosis. mRNA expression of proinflammatory cytokines, IL-1β, IL-6, and TNFα, also were not significantly altered (p > 0.05 for all comparisons, one-way ANOVA, n = 3 male 8-week-old animals).
Figure 6.
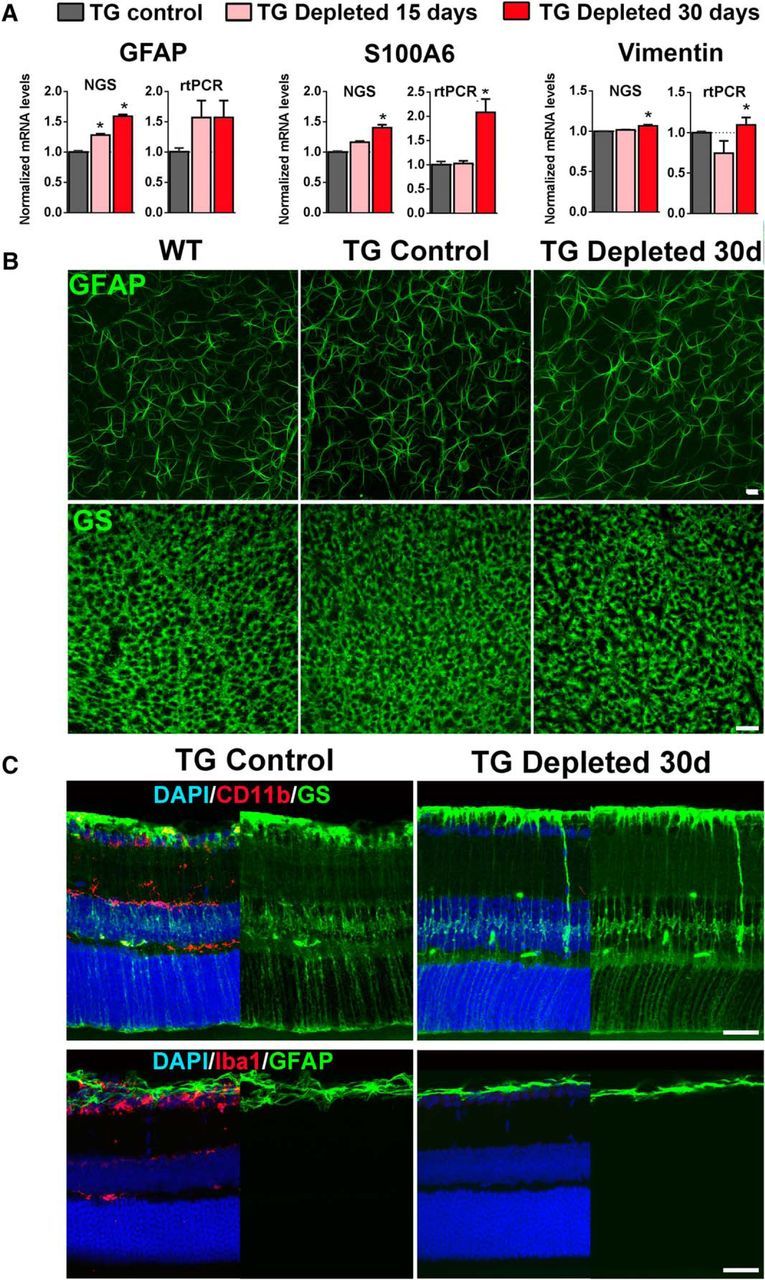
Effect of retinal microglial depletion on Müller cells and retina astrocytes. A, mRNA expression levels were assessed using NGS and rtPCR. Comparisons were made between TG mice gavaged with corn oil without tamoxifen (TG Control), and animals depleted of microglia with continuous administration of TAM in corn oil for 15 and 30 d. Levels of Müller cell-expressed genes that are typically upregulated in the context of activation (GFAP, S100A6, vimentin) were increased with microglial depletion. (pairwise comparisons made with one-way ANOVA; *indicates comparisons relative to TG control for which p < 0.05, n = 3 male, 8-week-old animals per group). B, Immunolabeling of retinal astrocyte processes for GFAP and Müller cell end-feet processes for glutamine synthetase (GS) in the ganglion cell layer of retinal flat-mounts demonstrated a similar density and organization of processes in microglia-depleted retinas (TG Depleted) relative to controls. C, GS-immunopositive Müller cells, as viewed in retinal sections, have similar morphologies in TG-depleted retinas (with ablated CD11b immunostaining following microglial depletion) compared with TG Control (top). Müller cells also failed to upregulate GFAP expression in their cellular processes following microglial depletion in TG-depleted retinas (with ablated Iba1 immunostaining), similar to that in TG control retinas (bottom). Scale bars, 30 μm.
Effect of microglial depletion on visual function
In the mature brain, microglial processes found in close proximity to synapses demonstrate prominent and dynamic contacts on presynaptic and postsynaptic components (Wake et al., 2009; Tremblay et al., 2010), and can alter synaptic structure and physiology via microglial-derived factors (Paolicelli et al., 2011; Rogers et al., 2011; Parkhurst et al., 2013). In the mature retina, microglial processes are similarly intimately juxtaposed with presynaptic and postsynaptic structures in the outer plexiform layer (OPL; data not shown). However, whether retinal synaptic function and structure require constitutive maintenance by microglia in adult systems is unknown. To investigate the impact of microglial depletion on visual function, we monitored in vivo electroretinographic responses to flash illumination in animals continuously depleted of microglia for 5 and 30 d, and compared them to those in nondepleted controls. Following 5 d of microglial depletion, a-wave amplitudes of both dark- and light-adapted responses were minimally changed, whereas b-wave amplitudes showed modest but significant decrements relative to control at higher flash intensities (Fig. 7A,B). Following 30 d of depletion, a-wave amplitudes of both dark- and light-adapted responses demonstrated decrements at higher flash intensities, whereas b-wave amplitudes demonstrated pronounced declines that were generalized for all flash intensities. These findings indicate that the b-wave response, originating from retinal cells postsynaptic to the photoreceptors, is compromised soon after microglial depletion and decreases progressively with the duration of depletion, with a smaller and slower effect on photoreceptor-derived a-wave responses. These effects were also evident in declining b–a amplitude ratios with increasing duration of microglial depletion. Separate depletion experiments conducted in age-matched female and male animals confirmed that animals of both sexes demonstrate similar decrements in ERG response amplitudes following microglial depletion (data not shown). Control experiments in which WT mice were similarly administered TAM for 30 d did not demonstrate any significant a- or b-wave amplitude changes under dark- or light-adapted conditions with the exception of a smaller but significant decrease in light-adapted b-wave amplitudes at higher flash intensities (Fig. 7C), indicating that the major extent of the ERG changes observed can be attributed to microglial depletion, rather than to TAM per se. These findings indicate that electrophysiological responses in the retina, in particular those resulting from synaptic transmission from photoreceptors, require constitutive influences from retinal microglia for maintenance.
Figure 7.

Effect of retinal microglial depletion on functional electroretinographic responses. ERG recordings were obtained from adult (2- to 3-month-old) female: (1) nondepleted TG mice (TG control; n = 17 animals), (2) mice depleted of microglia for 5 d (TG Depleted 5 d; n = 5 animals), and (3) mice depleted of microglia for 30 d (TG Depleted 30 d; n = 13 animals). A, Dark-adapted a-wave responses were nonsignificantly changed at 5 d (p = 0.12) but significantly decreased at 30 d (p < 0.0001). Dark-adapted b-wave responses were progressively decreased at both 5 and 30 d (p < 0.0001). B, Light-adapted responses: a-wave responses were unchanged at 5 d (p = 0.87) but decreased at 30 d (p < 0.0001); b-wave responses were progressively decreased at 5 d and further at 30 d (p < 0.0001). In both light- and dark-adapted responses, b–a wave amplitude ratios are progressively decreased with duration of depletion. C, ERG recordings were obtained from adult (2- to 3-month-old) C57BL6 WT mice that were either tested without TAM administration or tested followed 30 d of TAM administration (n = 6 female 8-week-old animals in each group). Comparison of dark-adapted a- and b-wave responses revealed no changes secondary to TAM administration. Comparison of light-adapted a-wave response showed no significant changes but slightly and significantly decreased b-wave responses after TAM administration (graphical data in B and C are represented as mean ± SEM; *indicates comparisons relative to baseline using multiple t tests, corrected for multiple comparisons using the Holm–Sidak method, for α < 0.05). D, Visual acuity capabilities of age-matched adult (2- to 3-month-old) TG versus TG-depleted 30 d mice were evaluated by automated assessment of optomotor responses (n = 4 female 8-week-old animals in each group). Sinusoidal gratings, rotating in a virtual cylinder at 12°/s, were presented at different spatial frequencies to each awake and unrestrained animal tested, and resulting optomotor responses were quantitated from the tracking of head movements as the ratio of the time during which head movement occurred in the same direction with stimulus movement to the time during which it occurred in the opposite direction (Tcorrect/Tincorrect). Data points indicate median ratios at each grating spatial frequency with the color areas indicating the upper and lower quartiles of the dataset. Measurements from functionally blind 6-month-old rd10 mice (yellow areas) served as a negative control. Under scotopic conditions (left), the response curve of TG Control mice (pink symbols) at lower frequencies matched that of TG-depleted mice (green symbols) closely, whereas at higher frequencies (>0.15 cycles/°), the response curve for TG Depleted 30 d mice was slightly and nonsignificantly lower than that of TG Control mice. Under photopic conditions (right), the response curve of the response curve for TG Depleted 30 d mice was slightly, and nonsignificantly lower, than that of TG Control mice. Estimations of visual threshold, defined as the spatial frequency corresponding to 25% of the maximum optomotor response, was similar between depleted and nondepleted animals, for both scotopic and photopic conditions (p > 0.05, t test; bottom).
In addition, we performed in vivo assessments of optomotor responses to presentations of visual stimuli following 30 d of microglial depletion (Kretschmer et al., 2013). Under both scotopic and photopic conditions, the optomotor response curves demonstrated by microglial-depleted mice followed the same general profile as that demonstrated by nondepleted controls, with their responses being were slightly but nonsignificantly lower relative to controls (Fig. 7D). Visual thresholds, which approximate the minimum spacing in the visual stimuli grating sufficient to elicit an optomotor response, were not significantly different between the groups. This indicated that mice following sustained retinal microglia depletion were visually able and had nondistinct levels of visual acuity relative to nondepleted controls.
Effect of microglial depletion on synaptic structure
To discover the effect on sustained microglial depletion on the photoreceptor presynaptic structures, we examined the terminals of cone photoreceptors in the OPL by immunolabeling for cone arrestin. We found that the general appearance of cone pedicles, in terms of their density in the OPL in flat-mounted retina, as well as their morphology and localization within the OPL in retinal sections, were unchanged in the depleted retina relative to nondepleted and WT controls (Fig. 8A). Immunostaining for PNA to label the invaginating synaptic regions or “active sites” of cone pedicles (Blanks and Johnson, 1983; Haverkamp et al., 2001) also showed a preserved pattern in depleted retina as in controls (Fig. 8B). Photoreceptor synaptic ribbons, marked by immunolabeling for ribeye, a ribbon-associated protein (Schmitz et al., 2000), were also similar in density and distribution between groups (Fig. 8C). Consistent with this, immunostaining for postsynaptic density-95 (PSD-95), a scaffolding protein associated with rod spherules and cone pedicles (Koulen et al., 1998), as well as vesicular glutamate transporter 1 (VGLUT1), a marker of photoreceptor and bipolar ribbon terminals (Johnson et al., 2003), were similar in localization and in intensity in the OPL (Fig. 8D,E). Immunostaining patterns for NMDAR2A in the postsynaptic bipolar dendrites were also unchanged with microglial depletion (Fig. 8F). Additionally, immunostaining patterns of synaptic markers VGLUT1 and NMDAR1 demonstrated similar patterns in the IPL (Fig. 8E,F).
Figure 8.
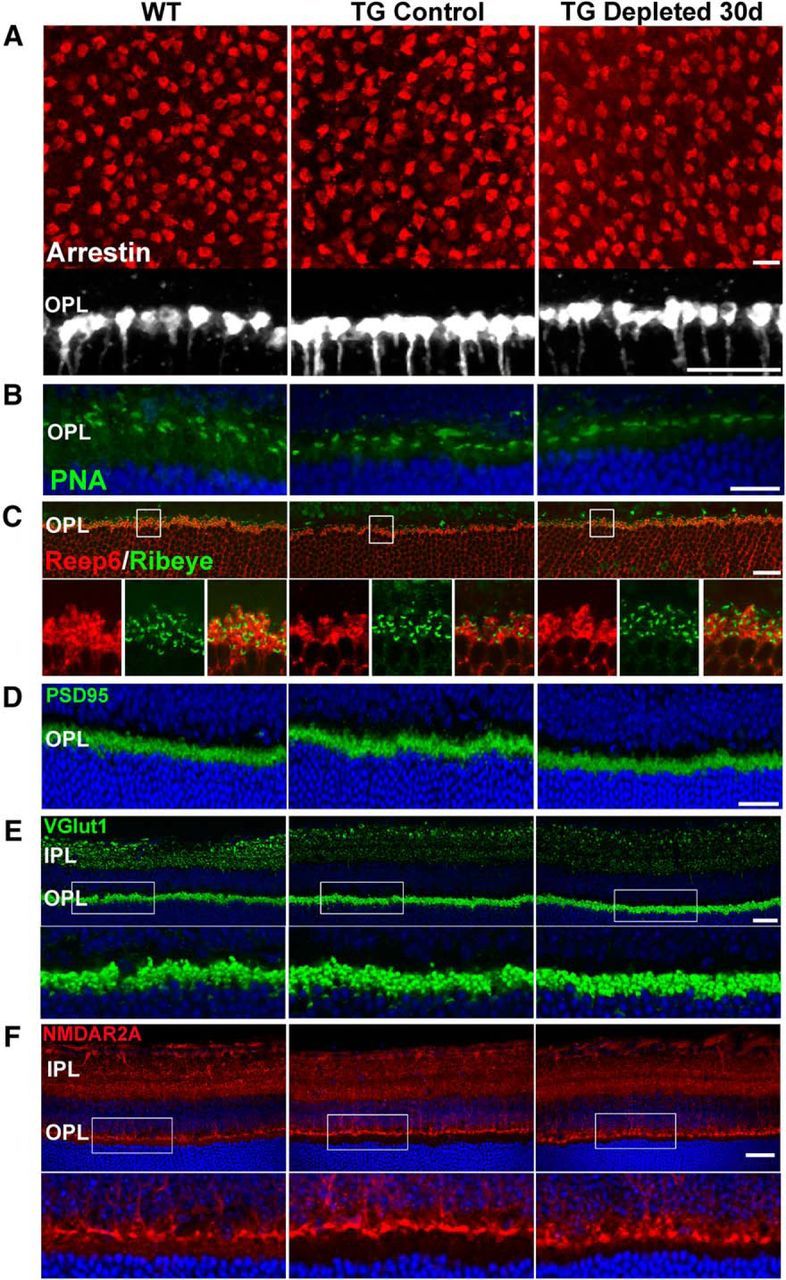
Effect of retinal microglial depletion on synaptic organization in the plexiform layers as visualized by light microscopy. A, Visualization of cone pedicles in the OPL by arrestin immunolabeling demonstrated that cone pedicles were of similar horizontal density (as viewed in retina flat-mounts in top) and morphology (as viewed in retina sections in bottom) in WT, TG control, and TG-depleted groups. B, PNA-labeled cone pedicle active site areas also demonstrated preserved structures and distributions in all three groups. C, Ribeye-immunopositive photoreceptor ribbon synapses, in conjunction with Reep6-labeled rod spherules, were also similar in density and distribution in all three groups. D, Immunolocalization of the synaptic marker PSD-95 protein in rod spherules and cone pedicles showed a normal distribution and intensity in TG and TG-depleted retinas. E, Immunolocalization of VGLUT1, a protein located in synaptic vesicles in ribbon synapses of photoreceptors and bipolar cells of the OPL and IPL respectively, were unchanged in distribution with microglial depletion. F, Immunolocalization of the NMDA receptor subunit A (NMDAR2A) also demonstrates normal patterns of localization in the postsynaptic sites in the IPL and the OPL. Scale bars: A (top), C–F, 20 μm; A (bottom), B, 10 μm.
Although general alterations in synaptic structure were not observed in microglia-depleted retinas on immunohistochemical analysis on the level of light microscopy, we examined depleted retinas for alterations at a higher resolution using electron microscopy. We hypothesized that synaptic alterations in the OPL in depleted retinas may give rise to progressive decrements in b-wave amplitudes on ERG. We observed that while the number of presynaptic termini in the OPL was similar in the depleted retina relative to nondepleted and WT controls, the majority of presynaptic termini in the depleted retinas demonstrated a dystrophic, irregular morphology with increased osmiophilic cytoplasm and indistinct vesicles, which are rarely seen or absent in WT and nondepleted controls (Fig. 9A,B). Synaptic ribbons in these abnormal termini were also appeared thickened and irregular. These ultrastructural changes in presynaptic termini indicated a breakdown in their structural integrity, akin to those described in models of synaptic degeneration as “dark degeneration” (Somogyi et al., 1977; Linder et al., 1987). We also noted degenerative changes in the ultrastructure of IPL synapses, which consisted of abnormal rod bipolar cell synapses containing presynaptic vacuolation and altered vesicular distribution and as well as abnormalities in amacrine cell dendrites in the forms of postsynaptic vacuolation and mitochondrial swelling (Fig. 9C).These findings, emerging after sustained microglial depletion, indicated that microglia play a constitutive role in maintaining the fine structure and function of synapses in the mature retina.
Figure 9.
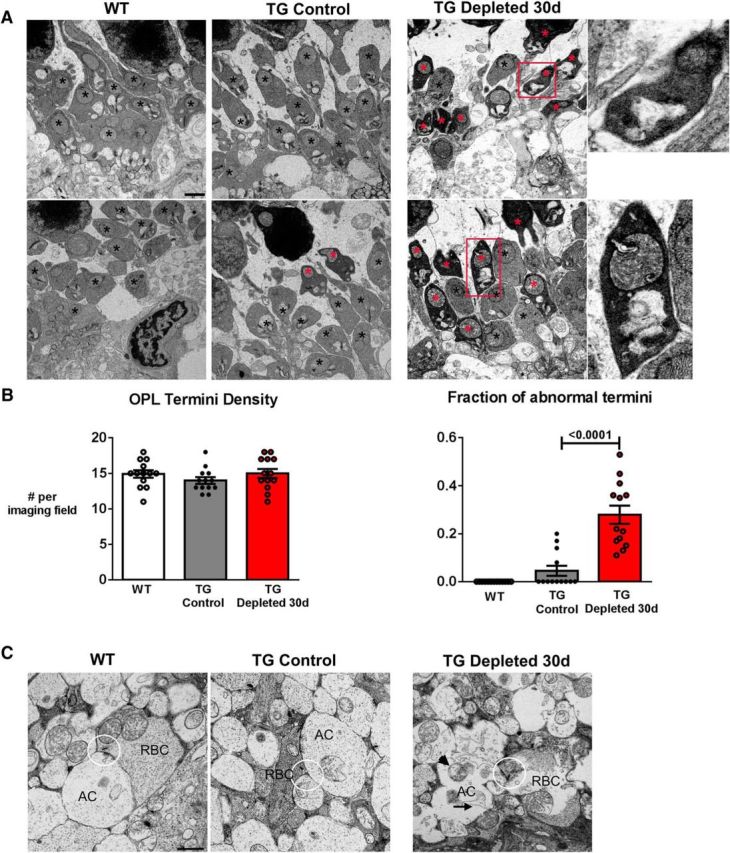
Sustained depletion of retinal microglia is associated with synaptic degeneration and atrophy. A, Synaptic ultrastructure in the OPL as revealed by transmission electron microscopy demonstrated normal presynaptic termini structures (black *) in both WT and TG control retinas, but the frequent presence of irregularly shaped termini with electron-dense, osmiophilic cytoplasm with thickened and irregular ribbons in the TG-depleted retina (red *), indicative of synaptic degeneration; magnified view of degenerating synapses shown in insets. B, Quantitative analysis demonstrates that in microglia-depleted retinas, OPL termini density was similar to WT and nondepleted TG controls (left). However, analysis of the fraction of OPL termini with electron-dense cytoplasm (right) showed a general increase in the proportion of degenerating termini with electron-dense cytoplasm in microglia-depleted retina (data are represented as mean ± SEM; p values reported for one-way ANOVA with multiple comparisons, n = 3 female, 8-week-old animals per group and 13 imaging fields per condition). C, Synaptic ultrastructure in the IPL demonstrated altered distribution of synaptic vesicles surrounding the ribbons (highlighted in circles) of rod bipolar cells (RBCs). Postsynaptically, the dendrites of amacrine cells (ACs) showed increased vacuolation (arrow) and mitochondrial swelling (arrowhead). Scale bars, 1 μm.
Discussion
To deplete microglia from the retina in a sustained manner, we used CX3CR1CreER:Rosa26-flox-STOP-flox-DTA transgenic mice to induce specific Cre-mediated DNA recombination (Parkhurst et al., 2013) and DTA expression in microglia. Following short-term microglial depletion induced by an initial dose of TAM, we found microglial repopulation to occur in the retina shortly after cessation of tamoxifen (data not shown), as previously described for other CNS regions (Varvel et al., 2012; Elmore et al., 2014; Bruttger et al., 2015). By maintaining tamoxifen administration, we continued the elimination of any repopulating microglia in the retina, enabling the consequences of long-term microglia absence in the retina to be examined. Microglial depletion using this model system was maintained at >95% across the entire period examined, a level that is comparable or higher than those achieved in other depletion studies (Parkhurst et al., 2013; Elmore et al., 2014). A few isolated Iba1+ cells had been still observed in the depleted retina in the ganglion cell layer and the IPL, particularly at the Day 30 time-point, and were probably constituted by repopulating microglia. However, microglia–neuron contacts, which are highly prevalent in the adult retina, were markedly reduced across the entire period of depletion, and are unlikely to exert an influence comparable to that at baseline. In this transgenic model, TAM administration involved the additional depletion of other systemic CX3CR1-expressing cell types, such as peripheral myeloid cells and subsets of lymphocytes; however, as these cell types do not enter the retina in the absence of injury or disease, their depletion was unlikely to influence the development of phenotypes described in the retina.
We found on histologic examination that sustained microglial depletion in the retina was not associated with the overt loss of retinal cells or the disruption of retinal organization. The preservation of retinal thickness and organization in depleted retinas was documented additionally by in vivo quantitative OCT imaging, which is not susceptible to postmortem- and fixation-associated artifacts. TUNEL-positive apoptotic cells, whose presence can signal a low level of cell death not amounting to overt tissue atrophy, were also not detected. Whereas microglia–neuron interactions mediated through trophic factor signaling are required in developing systems to maintain neuronal survival (Ueno et al., 2013) and to guide the laminar positioning of differentiating neurons (Squarzoni et al., 2014), they appeared dispensable for these functions in the adult retina. Consistent with this, microglial ablation In the adult brain failed to change the density of NeuN-positive cells or induce the appearance of cleaved-caspase 3-positive neurons over the short-term (7 d; Parkhurst et al., 2013), or alter levels of NeuN protein over the longer-term (21 d; Elmore et al., 2014). Analogously, although microglia regulate vascular growth and patterning in the developing retina (Checchin et al., 2006; Stefater et al., 2011), they appeared dispensable for the maintenance of the structure, lamination, and patterning of vasculature in the adult retina.
In the developing brain, microglia have been implicated in guiding the extension and positioning of axons, thus regulating the wiring of neural systems (Squarzoni et al., 2014). In the mature CNS, microglial interactions with neuronal axonal, dendritic, and synaptic compartments via stable (Baalman et al., 2015) and dynamic contacts (Wake et al., 2009; Tremblay et al., 2010) persist, and are suggestive of a continuing role for microglia in neuronal maintenance. This role is also suggested in the adult retina by the coincident spatial positioning of axonal, dendritic, and synaptic compartments of neurons and dynamic microglial processes in the plexiform layers (Lee et al., 2008). In this study, our findings demonstrated that although microglial processes are intimately intercalated with axons and dendrites in the plexiform layers, their elimination did not result in abnormal neurite retraction or outgrowth, or loss of organization in retinal sublamina. In this respect, the structure of neuronal processes in the forms of dendritic and axonal structure appears more robust to microglia ablation than to the ablation of Müller cells or subsets of retinal interneurons (Shen et al., 2012; Keeley et al., 2013).
As microglia have been demonstrated to sculpt synapse patterns and modulate synapse maturation during brain development (Paolicelli et al., 2011; Schafer et al., 2012), they have been hypothesized to exert a continuing influence on neuronal circuitry in adulthood. There is evidence that neuronal activity in adult systems regulates the dynamism of microglial processes, altering the frequency of microglia–neuron contact (Wake et al., 2009; Tremblay et al., 2010; Fontainhas et al., 2011; Li et al., 2012; Eyo et al., 2015). These microglial contacts can in turn regulate electrical activity in neurons, possibly through the modulation of synapses (Li et al., 2012; Chen et al., 2014). Microglial depletion and deletion of microglial BDNF in the late postnatal brain have been described to decrease the rate of dendritic spine turnover and alter glutamatergic synaptic function (Parkhurst et al., 2013). In other studies, microglial depletion has been reported to increase neuronal activity and dendritic spine density (Ji et al., 2013; Rice et al., 2015). The in vivo functional implications of these findings have been varied; learning deficits were associated with synaptic changes in one study (Parkhurst et al., 2013), but were not however detected in another study (Elmore et al., 2014). Also, transgenic mice lacking the expression of microglia-expressed Hoxb8 demonstrated abnormal behavioral phenotypes that were ameliorated by the transplantation of WT microglia (Chen et al., 2010), supporting the involvement of microglia in shaping neural circuits underlying behavior in the mature CNS (Miyamoto et al., 2013).
In the current study, we investigated the relationship between microglia and synapses in the adult retina and found that the b-wave of the ERG, which reflects neurotransmission across the first retinal synapse, was progressively reduced during microglial depletion. Although widespread synaptic changes were not obvious on the light microscopic level, we observed on electron microscopy that degenerative changes in OPL synapses were highly prevalent. The appearance of the abnormal, irregularly shaped presynaptic termini with osmiophilic cytoplasm was similar to previous descriptions of dark degeneration of synapses (Somogyi et al., 1977; Linder et al., 1987) which have been described in models of synaptic degeneration induced by prion disease (Sisková et al., 2009), diabetes (Schmidt et al., 2008), and synaptic blockade (Caleo et al., 2012). The progressive loss of retinal synaptic transmission and the emergence of synaptic degeneration with microglial depletion indicate a requirement for microglial presence for the healthy sustenance of mature synapses. The mechanisms underlying this requirement may potentially take the form of trophic signaling mediated by cell–cell contact between microglial processes and synaptic processes and/or the secretion of a diffusible factor from microglia. Molecular candidates for trophic signaling include growth factors, such as BDNF and IGF1, which are expressed by microglia that have been demonstrated to exert synaptic change (Parkhurst et al., 2013; Ueno et al., 2013), as well as cytokines, such as CX3CL1 and IL10, that can regulate synapse formation and maturation (Lim et al., 2013; Paolicelli et al., 2014). Alternatively, the depletion of microglia may result in the loss of homeostatic regulation of synaptic activity, which may culminate in dysregulated synaptic transmission and progressive synaptic degeneration. Potential molecular mechanisms are currently under active investigation in our laboratory.
We did not find evidence in the retina that microglial depletion resulted in the induction of overt inflammatory changes in the form of upregulation of inflammatory cytokines as previously reported in the brain (Bruttger et al., 2015). As such, functional loss and synaptic degeneration in this context are unlikely to be induced by proinflammatory changes. Our system for microglial depletion did not involve the systemic administration of diphtheria toxin, and we verified that WT animals administered tamoxifen did not demonstrate comparable ERG changes, thus ruling out possible toxic, microglia-independent influences as a cause for the phenotype observed. Although we did not observe changes to the morphology or the number of retinal macroglia, we detected a progressive increase in GFAP/S100/vimentin mRNA levels during microglial depletion, suggesting that physiological changes in Müller cells and/or retinal astrocytes can result from an interruption in constitutive macroglia–microglia signaling (Wang and Wong, 2014). These changes in GFAP mRNA and protein levels, in the absence of morphological evidence for astrogliosis, have been also noted in other models of microglial depletion in the brain (Parkhurst et al., 2013; Elmore et al., 2014). These trends indicate that macroglial populations can sense and respond to the absence of microglia in the CNS, although the functional significance of these changes is currently obscure.
In conclusion, using a model of sustained microglial depletion, we found that unlike in the degenerating retina (Zhao et al., 2015), microglia in the healthy mature retina do not contribute to the survival of retinal neurons or to the maintenance of retinal architecture. Long-term absence of retinal microglia however results in the gradual degeneration of retinal synapses and the deterioration of the retina's functional response to light. These findings demonstrate a requirement for microglia in maintenance of synapses in the healthy adult retina, and indicate that a loss of microglia function can be deleterious to visual function. These results are practically relevant to the ongoing consideration of microglial-targeted treatments for retinal degenerative diseases involving the modulation of microglial presence and/or activation (Karlstetter et al., 2015; Zhao et al., 2015). The current work provides a foundation for the further elucidation of the underlying mechanisms governing microglia–synapse interactions that can aid in the design of microglial-based therapeutic strategies.
Footnotes
This work was supported by funds from the National Eye Institute Intramural Research Program (W.T.W., R.N.F., H.h.Q., T.C.B.), the National Institute of Neurological Disorders and Stroke (J.S.D.) and by the US National Institutes of Health Grants 1R01NS087198 (W.-B.G.). We thank Jan Singaravelu for assistance in image analysis.
The authors declare no competing financial interests.
References
- Baalman K, Marin MA, Ho TS, Godoy M, Cherian L, Robertson C, Rasband MN. Axon initial segment-associated microglia. J Neuroscience. 2015;35:2283–2292. doi: 10.1523/JNEUROSCI.3751-14.2015. [DOI] [PMC free article] [PubMed] [Google Scholar]
- Blanks JC, Johnson LV. Selective lectin binding of the developing mouse retina. J Comp Neurol. 1983;221:31–41. doi: 10.1002/cne.902210103. [DOI] [PubMed] [Google Scholar]
- Bruttger J, Karram K, Wörtge S, Regen T, Marini F, Hoppmann N, Klein M, Blank T, Yona S, Wolf Y, Mack M, Pinteaux E, Müller W, Zipp F, Binder H, Bopp T, Prinz M, Jung S, Waisman A. Genetic cell ablation reveals clusters of local self-renewing microglia in the mammalian central nervous system. Immunity. 2015;43:92–106. doi: 10.1016/j.immuni.2015.06.012. [DOI] [PubMed] [Google Scholar]
- Caleo M, Restani L, Vannini E, Siskova Z, Al-Malki H, Morgan R, O'Connor V, Perry VH. The role of activity in synaptic degeneration in a protein misfolding disease, prion disease. PloS One. 2012;7:e41182. doi: 10.1371/journal.pone.0041182. [DOI] [PMC free article] [PubMed] [Google Scholar]
- Cartier N, Lewis CA, Zhang R, Rossi FM. The role of microglia in human disease: therapeutic tool or target? Acta Neuropathologica. 2014;128:363–380. doi: 10.1007/s00401-014-1330-y. [DOI] [PMC free article] [PubMed] [Google Scholar]
- Checchin D, Sennlaub F, Levavasseur E, Leduc M, Chemtob S. Potential role of microglia in retinal blood vessel formation. Invest Ophthalmol Vis Sci. 2006;47:3595–3602. doi: 10.1167/iovs.05-1522. [DOI] [PubMed] [Google Scholar]
- Chen SK, Tvrdik P, Peden E, Cho S, Wu S, Spangrude G, Capecchi MR. Hematopoietic origin of pathological grooming in Hoxb8 mutant mice. Cell. 2010;141:775–785. doi: 10.1016/j.cell.2010.03.055. [DOI] [PMC free article] [PubMed] [Google Scholar]
- Chen Z, Jalabi W, Hu W, Park HJ, Gale JT, Kidd GJ, Bernatowicz R, Gossman ZC, Chen JT, Dutta R, Trapp BD. Microglial displacement of inhibitory synapses provides neuroprotection in the adult brain. Nat Commun. 2014;5:4486. doi: 10.1038/ncomms5486. [DOI] [PMC free article] [PubMed] [Google Scholar]
- Davalos D, Grutzendler J, Yang G, Kim JV, Zuo Y, Jung S, Littman DR, Dustin ML, Gan WB. ATP mediates rapid microglial response to local brain injury in vivo. Nat Neurosci. 2005;8:752–758. doi: 10.1038/nn1472. [DOI] [PubMed] [Google Scholar]
- Elmore MR, Najafi AR, Koike MA, Dagher NN, Spangenberg EE, Rice RA, Kitazawa M, Matusow B, Nguyen H, West BL, Green KN. Colony-stimulating factor 1 receptor signaling is necessary for microglia viability, unmasking a microglia progenitor cell in the adult brain. Neuron. 2014;82:380–397. doi: 10.1016/j.neuron.2014.02.040. [DOI] [PMC free article] [PubMed] [Google Scholar]
- Eyo UB, Gu N, De S, Dong H, Richardson JR, Wu LJ. Modulation of microglial process convergence toward neuronal dendrites by extracellular calcium. J Neurosci. 2015;35:2417–2422. doi: 10.1523/JNEUROSCI.3279-14.2015. [DOI] [PMC free article] [PubMed] [Google Scholar]
- Fontainhas AM, Wang M, Liang KJ, Chen S, Mettu P, Damani M, Fariss RN, Li W, Wong WT. Microglial morphology and dynamic behavior is regulated by ionotropic glutamatergic and GABAergic neurotransmission. PloS One. 2011;6:e15973. doi: 10.1371/journal.pone.0015973. [DOI] [PMC free article] [PubMed] [Google Scholar]
- Hao H, Veleri S, Sun B, Kim DS, Keeley PW, Kim JW, Yang HJ, Yadav SP, Manjunath SH, Sood R, Liu P, Reese BE, Swaroop A. Regulation of a novel isoform of receptor expression enhancing protein REEP6 in rod photoreceptors by bZIP transcription factor NRL. Hum Mol Genet. 2014;23:4260–4271. doi: 10.1093/hmg/ddu143. [DOI] [PMC free article] [PubMed] [Google Scholar]
- Haverkamp S, Grünert U, Wässle H. The synaptic architecture of AMPA receptors at the cone pedicle of the primate retina. J Neurosci. 2001;21:2488–2500. doi: 10.1523/JNEUROSCI.21-07-02488.2001. [DOI] [PMC free article] [PubMed] [Google Scholar]
- Hellwig S, Heinrich A, Biber K. The brain's best friend: microglial neurotoxicity revisited. Front Cell Neurosci. 2013;7:71. doi: 10.3389/fncel.2013.00071. [DOI] [PMC free article] [PubMed] [Google Scholar]
- Ji K, Akgul G, Wollmuth LP, Tsirka SE. Microglia actively regulate the number of functional synapses. PloS One. 2013;8:e56293. doi: 10.1371/journal.pone.0056293. [DOI] [PMC free article] [PubMed] [Google Scholar]
- Johnson J, Tian N, Caywood MS, Reimer RJ, Edwards RH, Copenhagen DR. Vesicular neurotransmitter transporter expression in developing postnatal rodent retina: GABA and glycine precede glutamate. J Neurosci. 2003;23:518–529. doi: 10.1523/JNEUROSCI.23-02-00518.2003. [DOI] [PMC free article] [PubMed] [Google Scholar]
- Karlstetter M, Scholz R, Rutar M, Wong WT, Provis JM, Langmann T. Retinal microglia: just bystander or target for therapy? Prog Retin Eye Res. 2015;45:30–57. doi: 10.1016/j.preteyeres.2014.11.004. [DOI] [PubMed] [Google Scholar]
- Keeley PW, Luna G, Fariss RN, Skyles KA, Madsen NR, Raven MA, Poché RA, Swindell EC, Jamrich M, Oh EC, Swaroop A, Fisher SK, Reese BE. Development and plasticity of outer retinal circuitry following genetic removal of horizontal cells. J Neurosci. 2013;33:17847–17862. doi: 10.1523/JNEUROSCI.1373-13.2013. [DOI] [PMC free article] [PubMed] [Google Scholar]
- Koulen P, Fletcher EL, Craven SE, Bredt DS, Wässle H. Immunocytochemical localization of the postsynaptic density protein PSD-95 in the mammalian retina. J Neurosci. 1998;18:10136–10149. doi: 10.1523/JNEUROSCI.18-23-10136.1998. [DOI] [PMC free article] [PubMed] [Google Scholar]
- Kretschmer F, Kretschmer V, Kunze VP, Kretzberg J. OMR-arena: automated measurement and stimulation system to determine mouse visual thresholds based on optomotor responses. PloS One. 2013;8:e78058. doi: 10.1371/journal.pone.0078058. [DOI] [PMC free article] [PubMed] [Google Scholar]
- Kretschmer F, Sajgo S, Kretschmer V, Badea TC. A system to measure the Optokinetic and Optomotor response in mice. J Neurosci Methods. 2015;256:91–105. doi: 10.1016/j.jneumeth.2015.08.007. [DOI] [PMC free article] [PubMed] [Google Scholar]
- Lalancette-Hébert M, Gowing G, Simard A, Weng YC, Kriz J. Selective ablation of proliferating microglial cells exacerbates ischemic injury in the brain. J Neurosci. 2007;27:2596–2605. doi: 10.1523/JNEUROSCI.5360-06.2007. [DOI] [PMC free article] [PubMed] [Google Scholar]
- Lee JE, Liang KJ, Fariss RN, Wong WT. Ex vivo dynamic imaging of retinal microglia using time-lapse confocal microscopy. Invest Ophthalmol Vis Sci. 2008;49:4169–4176. doi: 10.1167/iovs.08-2076. [DOI] [PMC free article] [PubMed] [Google Scholar]
- Li Y, Du XF, Liu CS, Wen ZL, Du JL. Reciprocal regulation between resting microglial dynamics and neuronal activity in vivo. Dev Cell. 2012;23:1189–1202. doi: 10.1016/j.devcel.2012.10.027. [DOI] [PubMed] [Google Scholar]
- Lim SH, Park E, You B, Jung Y, Park AR, Park SG, Lee JR. Neuronal synapse formation induced by microglia and interleukin 10. PloS One. 2013;8:e81218. doi: 10.1371/journal.pone.0081218. [DOI] [PMC free article] [PubMed] [Google Scholar]
- Linder JC, Klemfuss H, Groves PM. Acute ultrastructural and behavioral effects of 1-methyl-4-phenyl-1,2,3,6-tetrahydropyridine (MPTP) in mice. Neurosci Lett. 1987;82:221–226. doi: 10.1016/0304-3940(87)90134-0. [DOI] [PubMed] [Google Scholar]
- Mattapallil MJ, Wawrousek EF, Chan CC, Zhao H, Roychoudhury J, Ferguson TA, Caspi RR. The Rd8 mutation of the Crb1 gene is present in vendor lines of C57BL/6N mice and embryonic stem cells, and confounds ocular induced mutant phenotypes. Invest Ophthalmol Vis Sci. 2012;53:2921–2927. doi: 10.1167/iovs.12-9662. [DOI] [PMC free article] [PubMed] [Google Scholar]
- Mirrione MM, Konomos DK, Gravanis I, Dewey SL, Aguzzi A, Heppner FL, Tsirka SE. Microglial ablation and lipopolysaccharide preconditioning affects pilocarpine-induced seizures in mice. Neurobiol Dis. 2010;39:85–97. doi: 10.1016/j.nbd.2010.04.001. [DOI] [PMC free article] [PubMed] [Google Scholar]
- Miyamoto A, Wake H, Moorhouse AJ, Nabekura J. Microglia and synapse interactions: fine tuning neural circuits and candidate molecules. Front Cell Neurosci. 2013;7:70. doi: 10.3389/fncel.2013.00070. [DOI] [PMC free article] [PubMed] [Google Scholar]
- Montero M, González B, Zimmer J. Immunotoxic depletion of microglia in mouse hippocampal slice cultures enhances ischemia-like neurodegeneration. Brain Res. 2009;1291:140–152. doi: 10.1016/j.brainres.2009.06.097. [DOI] [PubMed] [Google Scholar]
- Nimmerjahn A, Kirchhoff F, Helmchen F. Resting microglial cells are highly dynamic surveillants of brain parenchyma in vivo. Science. 2005;308:1314–1318. doi: 10.1126/science.1110647. [DOI] [PubMed] [Google Scholar]
- Paolicelli RC, Bolasco G, Pagani F, Maggi L, Scianni M, Panzanelli P, Giustetto M, Ferreira TA, Guiducci E, Dumas L, Ragozzino D, Gross CT. Synaptic pruning by microglia is necessary for normal brain development. Science. 2011;333:1456–1458. doi: 10.1126/science.1202529. [DOI] [PubMed] [Google Scholar]
- Paolicelli RC, Bisht K, Tremblay MÈ. Fractalkine regulation of microglial physiology and consequences on the brain and behavior. Front Cell Neurosci. 2014;8:129. doi: 10.3389/fncel.2014.00129. [DOI] [PMC free article] [PubMed] [Google Scholar]
- Parkhurst CN, Yang G, Ninan I, Savas JN, Yates JR, 3rd, Lafaille JJ, Hempstead BL, Littman DR, Gan WB. Microglia promote learning-dependent synapse formation through brain-derived neurotrophic factor. Cell. 2013;155:1596–1609. doi: 10.1016/j.cell.2013.11.030. [DOI] [PMC free article] [PubMed] [Google Scholar]
- Rice RA, Spangenberg EE, Yamate-Morgan H, Lee RJ, Arora RP, Hernandez MX, Tenner AJ, West BL, Green KN. Elimination of microglia improves functional outcomes following extensive neuronal loss in the hippocampus. J Neurosci. 2015;35:9977–9989. doi: 10.1523/JNEUROSCI.0336-15.2015. [DOI] [PMC free article] [PubMed] [Google Scholar]
- Roger JE, Hiriyanna A, Gotoh N, Hao H, Cheng DF, Ratnapriya R, Kautzmann MA, Chang B, Swaroop A. OTX2 loss causes rod differentiation defect in CRX-associated congenital blindness. J Clin Invest. 2014;124:631–643. doi: 10.1172/JCI72722. [DOI] [PMC free article] [PubMed] [Google Scholar]
- Rogers JT, Morganti JM, Bachstetter AD, Hudson CE, Peters MM, Grimmig BA, Weeber EJ, Bickford PC, Gemma C. CX3CR1 deficiency leads to impairment of hippocampal cognitive function and synaptic plasticity. J Neurosci. 2011;31:16241–16250. doi: 10.1523/JNEUROSCI.3667-11.2011. [DOI] [PMC free article] [PubMed] [Google Scholar]
- Schafer DP, Lehrman EK, Kautzman AG, Koyama R, Mardinly AR, Yamasaki R, Ransohoff RM, Greenberg ME, Barres BA, Stevens B. Microglia sculpt postnatal neural circuits in an activity and complement-dependent manner. Neuron. 2012;74:691–705. doi: 10.1016/j.neuron.2012.03.026. [DOI] [PMC free article] [PubMed] [Google Scholar]
- Schmidt RE, Parvin CA, Green KG. Synaptic ultrastructural alterations anticipate the development of neuroaxonal dystrophy in sympathetic ganglia of aged and diabetic mice. J Neuropathol Exp Neurol. 2008;67:1166–1186. doi: 10.1097/NEN.0b013e318190d6db. [DOI] [PMC free article] [PubMed] [Google Scholar]
- Schmitz F, Königstorfer A, Südhof TC. RIBEYE, a component of synaptic ribbons: a protein's journey through evolution provides insight into synaptic ribbon function. Neuron. 2000;28:857–872. doi: 10.1016/S0896-6273(00)00159-8. [DOI] [PubMed] [Google Scholar]
- Shen W, Fruttiger M, Zhu L, Chung SH, Barnett NL, Kirk JK, Lee S, Coorey NJ, Killingsworth M, Sherman LS, Gillies MC. Conditional Müller cell ablation causes independent neuronal and vascular pathologies in a novel transgenic model. J Neurosci. 2012;32:15715–15727. doi: 10.1523/JNEUROSCI.2841-12.2012. [DOI] [PMC free article] [PubMed] [Google Scholar]
- Sierra A, Encinas JM, Deudero JJ, Chancey JH, Enikolopov G, Overstreet-Wadiche LS, Tsirka SE, Maletic-Savatic M. Microglia shape adult hippocampal neurogenesis through apoptosis-coupled phagocytosis. Cell Stem Cell. 2010;7:483–495. doi: 10.1016/j.stem.2010.08.014. [DOI] [PMC free article] [PubMed] [Google Scholar]
- Sisková Z, Page A, O'Connor V, Perry VH. Degenerating synaptic boutons in prion disease: microglia activation without synaptic stripping. Am J Pathol. 2009;175:1610–1621. doi: 10.2353/ajpath.2009.090372. [DOI] [PMC free article] [PubMed] [Google Scholar]
- Somogyi G, Hajdu F, Hassler R. Electron microscopic study of terminal degeneration in the anterodorsal thalamic nucleus of the cat. Cell Tissue Res. 1977;182:455–467. doi: 10.1007/BF00219829. [DOI] [PubMed] [Google Scholar]
- Squarzoni P, Oller G, Hoeffel G, Pont-Lezica L, Rostaing P, Low D, Bessis A, Ginhoux F, Garel S. Microglia modulate wiring of the embryonic forebrain. Cell Rep. 2014;8:1271–1279. doi: 10.1016/j.celrep.2014.07.042. [DOI] [PubMed] [Google Scholar]
- Stefater JA, 3rd, Lewkowich I, Rao S, Mariggi G, Carpenter AC, Burr AR, Fan J, Ajima R, Molkentin JD, Williams BO, Wills-Karp M, Pollard JW, Yamaguchi T, Ferrara N, Gerhardt H, Lang RA. Regulation of angiogenesis by a non-canonical Wnt-Flt1 pathway in myeloid cells. Nature. 2011;474:511–515. doi: 10.1038/nature10085. [DOI] [PMC free article] [PubMed] [Google Scholar]
- Trapnell C, Pachter L, Salzberg SL. TopHat: discovering splice junctions with RNA-Seq. Bioinformatics. 2009;25:1105–1111. doi: 10.1093/bioinformatics/btp120. [DOI] [PMC free article] [PubMed] [Google Scholar]
- Trapnell C, Williams BA, Pertea G, Mortazavi A, Kwan G, van Baren MJ, Salzberg SL, Wold BJ, Pachter L. Transcript assembly and quantification by RNA-Seq reveals unannotated transcripts and isoform switching during cell differentiation. Nat Biotechnol. 2010;28:511–515. doi: 10.1038/nbt.1621. [DOI] [PMC free article] [PubMed] [Google Scholar]
- Trapnell C, Roberts A, Goff L, Pertea G, Kim D, Kelley DR, Pimentel H, Salzberg SL, Rinn JL, Pachter L. Differential gene and transcript expression analysis of RNA-seq experiments with TopHat and Cufflinks. Nat Protoc. 2012;7:562–578. doi: 10.1038/nprot.2012.016. [DOI] [PMC free article] [PubMed] [Google Scholar]
- Tremblay MÈ, Lowery RL, Majewska AK. Microglial interactions with synapses are modulated by visual experience. PLoS Biol. 2010;8:e1000527. doi: 10.1371/journal.pbio.1000527. [DOI] [PMC free article] [PubMed] [Google Scholar]
- Ueno M, Fujita Y, Tanaka T, Nakamura Y, Kikuta J, Ishii M, Yamashita T. Layer V cortical neurons require microglial support for survival during postnatal development. Nat Neurosci. 2013;16:543–551. doi: 10.1038/nn.3358. [DOI] [PubMed] [Google Scholar]
- Varvel NH, Grathwohl SA, Baumann F, Liebig C, Bosch A, Brawek B, Thal DR, Charo IF, Heppner FL, Aguzzi A, Garaschuk O, Ransohoff RM, Jucker M. Microglial repopulation model reveals a robust homeostatic process for replacing CNS myeloid cells. Proc Natl Acad Sci U S A. 2012;109:18150–18155. doi: 10.1073/pnas.1210150109. [DOI] [PMC free article] [PubMed] [Google Scholar]
- Vinet J, Weering HR, Heinrich A, Kälin RE, Wegner A, Brouwer N, Heppner FL, Rooijen N, Boddeke HW, Biber K. Neuroprotective function for ramified microglia in hippocampal excitotoxicity. J Neuroinflammation. 2012;9:27. doi: 10.1186/1742-2094-9-27. [DOI] [PMC free article] [PubMed] [Google Scholar]
- Voehringer D, Liang HE, Locksley RM. Homeostasis and effector function of lymphopenia-induced “memory-like” T cells in constitutively T cell-depleted mice. J Immunol. 2008;180:4742–4753. doi: 10.4049/jimmunol.180.7.4742. [DOI] [PMC free article] [PubMed] [Google Scholar]
- Wake H, Moorhouse AJ, Jinno S, Kohsaka S, Nabekura J. Resting microglia directly monitor the functional state of synapses in vivo and determine the fate of ischemic terminals. J Neurosci. 2009;29:3974–3980. doi: 10.1523/JNEUROSCI.4363-08.2009. [DOI] [PMC free article] [PubMed] [Google Scholar]
- Wang M, Wong WT. Microglia-Müller cell interactions in the retina. Adv Exp Med Biol. 2014;801:333–338. doi: 10.1007/978-1-4614-3209-8_42. [DOI] [PMC free article] [PubMed] [Google Scholar]
- Wang M, Ma W, Zhao L, Fariss RN, Wong WT. Adaptive Müller cell responses to microglial activation mediate neuroprotection and coordinate inflammation in the retina. J Neuroinflammation. 2011;8:173. doi: 10.1186/1742-2094-8-173. [DOI] [PMC free article] [PubMed] [Google Scholar]
- Wang M, Wang X, Zhao L, Ma W, Rodriguez IR, Fariss RN, Wong WT. Macroglia-microglia interactions via TSPO signaling regulates microglial activation in the mouse retina. J Neurosci. 2014;34:3793–3806. doi: 10.1523/JNEUROSCI.3153-13.2014. [DOI] [PMC free article] [PubMed] [Google Scholar]
- Zhao L, Zabel MK, Wang X, Ma W, Shah P, Fariss RN, Qian H, Parkhurst CN, Gan WB, Wong WT. Microglial phagocytosis of living photoreceptors contributes to inherited retinal degeneration. EMBO Mol Med. 2015;7:1179–1197. doi: 10.15252/emmm.201505298. [DOI] [PMC free article] [PubMed] [Google Scholar]