

Abstract
Rapid methods to determine antimicrobial susceptibility would assist in the timely distribution of effective treatment or postexposure prophylaxis in the aftermath of the release of bacterial biothreat agents such as Bacillus anthracis, Yersinia pestis, or Burkholderia pseudomallei. Conventional susceptibility tests require 16 to 48 h of incubation, depending on the bacterial species. We evaluated a method that is based on laser light scattering technology that measures cell density in real time. We determined that it has the ability to rapidly differentiate between growth (resistant) and no growth (susceptible) of several bacterial threat agents in the presence of clinically relevant antimicrobials. Results were available in <4 h for B. anthracis and <6 h for Y. pestis and B. pseudomallei. One exception was B. pseudomallei in the presence of ceftazidime, which required >10 h of incubation. Use of laser scattering technology decreased the time required to determine antimicrobial susceptibility by 50% to 75% for B. anthracis, Y. pestis, and B. pseudomallei compared to conventional methods.
INTRODUCTION
In the event of a deliberate release of or accidental exposure to potential bacterial agents of bioterrorism, determining phenotypic susceptibility to antimicrobials is essential for the selection of effective treatment or postexposure prophylaxis (1). Several methods can be used to determine antimicrobial susceptibility, although the gold standard is the conventional broth microdilution (BMD) method. Based on guidelines from the Clinical and Laboratory Standards Institute (CLSI), this method requires an incubation period of 16 to 20 h for Bacillus anthracis and Burkholderia pseudomallei and 24 to 48 h for Yersinia pestis (2). Other commonly used methods for antimicrobial susceptibility testing (AST) of bacteria are agar dilution, Etest, and disc diffusion. There are several peer-reviewed publications that describe the use of these methods for biothreat (BT) bacteria (3–6). However, these alternative methods require incubation times that are similar to those of the BMD test since visible growth is required for interpretation of results (3–6).
Rapid methods to determine antimicrobial susceptibility of BT bacteria are highly desirable to reduce the morbidity and mortality associated with the diseases caused by B. anthracis (anthrax), B. pseudomallei (melioidosis), and Y. pestis (plague). While genetic susceptibility tests have been described as more rapid than conventional methods, the genetic approaches have disadvantages since the presence of a resistant gene or a mutation does not necessarily result in phenotypic resistance (7). For example, B. anthracis has two β-lactamase genes, bla1 and bla2, on the chromosome, but this species is rarely resistant to β-lactam antimicrobials such as penicillin. Phenotypic susceptibility of most strains is due to a mutation(s) in the regulatory genes that prevent induction of β-lactamase gene expression (8, 9). Another issue associated with the use of genetic analysis to predict antimicrobial resistance is the inability to detect all possible mechanisms of resistance to the antimicrobials of interest. Due to the numerous sequence variations in each of the many classes of antimicrobial resistance genes, the possibly synergistic effects of previously undescribed mutations, the hyperexpression of efflux pumps, or the presence of one or more previously unknown resistance genes, a susceptibility report based on genetic analysis of an isolate may result in the use of an inappropriate antimicrobial agent and, subsequently, treatment failure. In the event of a deliberate release of a BT agent, these results could affect the treatment of large populations. Therefore, to ensure an effective public health response, a rapid method for phenotypic susceptibility testing is essential.
To avoid the issues associated with genetic predictions, several phenotypic methods for rapidly assessing antimicrobial resistance in BT bacteria have been developed. These include assays based on real-time PCR to detect growth in the presence of antimicrobials (10), reporter phage detection using bioluminescence or mass spectrometry (11–13), or flow cytometry (14). These assays take less time to determine susceptibility than conventional methods. However, they usually are more labor-intensive and may require expensive reagents or equipment. Therefore, the search for a rapid antimicrobial susceptibility method that is automated and cost-effective continues.
An AST method based on the measurement of laser light scattering in bacterial suspensions was previously evaluated for mycobacteria (15). Laser light scattering measures the angular variation in the intensity of light scattered as a laser beam passes through a liquid sample containing bacteria. This variation is proportional to the number and size of the bacteria. The investigators found that the technology was potentially useful, but the design of the instrument, its software, and its testing protocols were not user-friendly and needed major improvements (15). Both technology and software have improved significantly since then. In this work, we investigated the feasibility of a rapid antimicrobial susceptibility test for several bacterial BT agents using laser light scattering technology with an updated instrument that quantitates bacteria in real time.
MATERIALS AND METHODS
Bacterial strains.
The strains and phenotypic antimicrobial susceptibility characteristics of B. anthracis, Y. pestis, and B. pseudomallei tested in this work are listed in Table 1. All strains were attenuated and are excluded from the Select Agents list, allowing this study to be conducted in a biosafety level 2 (BSL-2) laboratory. Nonsusceptible (NS) derivatives of the attenuated strains were generated in the laboratory with prior review and approval from the CDC Institutional Biosafety Committee. The medium for B. pseudomallei Bp82 was supplemented with 5 µg/ml adenine (16).
TABLE 1.
Bacterial strains used in this work and their antimicrobial susceptibilitya
| Species and strain | Description | Reference or source | MIC (µg/ml) (strain susceptibility) |
|||||||
|---|---|---|---|---|---|---|---|---|---|---|
| AMC | CAZ | CIP | DOX | GEN | IPM | PEN | SXT | |||
| B. anthracis | ||||||||||
| Sterne 34F2 | 31 | — | — | 0.03 (S) | ≤0.03 (S) | — | — | 0.06 (S) | — | |
| JB031 | Derivative of UT308 | 9, this study | — | — | 0.12 (S) | — | — | — | — | — |
| JB032 | Derivative of UT308 | 9, this study | — | — | 0.5 (NS) | — | — | — | — | — |
| JB033 | Derivative of UT308 | 9, this study | — | — | 2 (NS) | — | — | — | — | — |
| JB034 | Derivative of UT308 | 9, this study | — | — | 4 (NS) | >32 (NS) | — | — | >32 (R) | — |
| Y. pestis | ||||||||||
| A1122 | 32 | — | — | 0.03 (S) | ≤1 (S) | ≤1 (S) | — | — | — | |
| DSJB001 | Derivative of A1122 | This study | — | — | 4 (NS) | >32 (R) | 32 (R) | — | — | — |
| B. pseudomallei | ||||||||||
| Bp82 | 16 | ≤4/2 (S) | ≤4 (S) | — | ≤1 (S) | — | ≤2 (S) | — | ≤0.5/9.5 (S) | |
| JB039 | Derivative of Bp82 | This study | 32/16 (R) | >64 (R) | — | 32 (R) | — | 64 (R) | — | >16/304 (R) |
Antimicrobial susceptibility was determined by conventional BMD testing. —, not applicable (these antimicrobials were not tested for the corresponding bacterial strain); S, susceptible; NS, nonsusceptible; R, resistant (2).
Antimicrobials.
The following antimicrobial agents were selected for this study based on guidelines published by CLSI: penicillin (PEN), doxycycline (DOX), and ciprofloxacin (CIP) for B. anthracis; gentamicin (GEN), DOX, and CIP for Y. pestis; and amoxicillin-clavulanic acid (AMC), ceftazidime (CAZ), imipenem (IPM), DOX, and trimethoprim-sulfamethoxazole (SXT) for B. pseudomallei (2). Amoxicillin, CAZ, CIP, DOX, GEN, PEN, sulfamethoxazole, and trimethoprim were purchased from Sigma-Aldrich (St. Louis, MO); clavulanate and IPM were purchased from USP (Rockville, MD). Prior to use in the laser scatter instrument, the prepared antimicrobial solutions were verified by BMD testing of routine quality control (QC) strains recommended by CLSI (2) using cation-adjusted Mueller-Hinton broth with N-tris(hydroxymethyl)methyl-2-aminoethanesulfonic acid (TES) (CAMHBT; Remel Inc., Lenexa, KS) in 96-well plates as described below in “Antimicrobial susceptibility testing.” In the laser scatter instrument, each bacterial strain from Table 1 was tested with three concentrations of each antimicrobial relevant to that species. The lowest concentration of each antimicrobial was equivalent to the CLSI breakpoint for susceptibility (2), followed by two consecutive 2-fold-increasing concentrations. If an intermediate breakpoint and a resistant breakpoint are specified by CLSI for the species/antimicrobial agent combination to be tested, both are captured by the selected concentrations of antimicrobials. The concentrations of each antimicrobial agent tested are described for each species in the legends of the corresponding figures in Results. Each experiment also included bacterial cells in the medium without an antimicrobial agent (no-drug control), as well as the uninoculated medium without an antimicrobial agent or inoculum (no-cell control).
Antimicrobial susceptibility testing.
CLSI guidelines for BMD testing (2) were followed for appropriate medium, inoculum, and incubation temperature unless noted otherwise. The MICs of each antimicrobial agent for the strains listed in Table 1 were determined by conventional BMD using antimicrobial susceptibility testing panels prepared in-house with cation-adjusted Mueller-Hinton broth as recommended by CLSI or with custom-manufactured Sensititre antimicrobial susceptibility testing panels (TREK Diagnostic Systems, Cleveland, OH) and CAMHBT as recommended by the manufacturer. Antimicrobial susceptibility testing with the laser scatter instrument was performed as follows: for each species, cells from at least six isolated colonies of an overnight culture grown for 16 to 24 h at 35°C on tryptic soy agar II (TSAII) with 5% sheep blood (Becton, Dickinson and Company, Sparks, MD) were suspended in CAMHBT to a concentration equivalent to a 0.5 McFarland turbidity standard (measured with the MicroScan turbidity meter; Siemens). Each suspension was then diluted 1:100 for B. anthracis, 1:200 for Y. pestis, and 1:50 for B. pseudomallei in sterile CAMHBT containing each concentration of antimicrobial agent. These dilutions had been confirmed to result in cell concentrations that were within the CLSI-recommended range for the BMD inoculum: 2 × 10⁵ to 8 × 10⁵ CFU/ml. Based on colony counts for the susceptible strain of the corresponding species, the concentrations in the final inoculum were ∼3 × 10⁵ CFU/ml for Y. pestis and ∼5 × 10⁵ CFU/ml for B. pseudomallei. The final inoculum for B. anthracis was ∼3 × 10⁴ CFU/ml. It was previously reported that B. anthracis yields plate counts that are lower than the CLSI-recommended cell counts for the BMD inoculum since a CFU for this bacterium corresponds to a chain consisting of multiple cells rather than to a single cell (3). Each cell/antimicrobial mixture was transferred to a cuvette (BacterioScan Inc., St. Louis, MO) in final volumes of 1.5 to 2.5 ml/sample. The different volumes were required due to modifications of the cuvettes by the manufacturer during the study. All cuvettes in each run were from the same lot and contained the same volume. The cuvettes containing cultures were incubated in the BacterioScan 216R instrument (BacterioScan Inc., St. Louis, MO) at 35°C for up to 10 h. The instrument was programmed to measure the cell density in each cuvette every 5 min. Cuvettes with B. anthracis were agitated manually by gently swirling the liquid every hour to redistribute chains of cells that had settled to the bottom of the cuvette. Three independent tests were performed for each strain and antimicrobial combination.
Calibration of the laser scattering instrument was performed for each bacterial species using susceptible strains. Bacterial suspensions at a turbidity equivalent to a 0.5 McFarland standard were serially diluted 3-fold in sterile CAMHBT and vortexed to ensure homogeneous suspensions. From each diluted cell suspension, 1.5 to 2.5 ml was transferred to a cuvette and tested in duplicate using the instrument measurement setting of “fastest,” which records the cell density values approximately five times during the 15-min time calibration procedure. Colony counts were determined with serial 10-fold dilutions of each cell suspension by spread plating on TSAII with 5% sheep blood. At least three separate plating experiments were performed for each bacterial species. Average cell density values determined by the laser scatter instrument were plotted against the average CFU/ml determined by colony counts for the corresponding dilution of the cell suspension to generate a formula to convert laser scatter cell density reads into CFU/ml counts, which we named “calibrated concentrations.”
Growth rate.
Doubling times for strains that were grown without an antimicrobial agent were determined from the linear portion of the exponential phase of growth in the growth curves generated by the laser scatter instrument in the antimicrobial susceptibility testing experiments.
Statistical analysis.
Statistical analysis by t test (paired, 2 tailed) for Y. pestis and B. pseudomallei and by Wilcoxon test for B. anthracis was used to compare the calibrated concentration in CFU/ml counts derived from the laser scatter instrument for a bacterial strain grown in the presence of an antimicrobial to the CFU/ml counts for the same strain grown without an antimicrobial within the same 30-min intervals. Results from each concentration of antimicrobial agent and each experiment were analyzed separately.
RESULTS
We performed rapid BMD AST using a laser light scattering instrument with susceptible and nonsusceptible strains of B. anthracis, Y. pestis, and B. pseudomallei with antimicrobial agents that have susceptibility breakpoints established by CLSI (2). Antimicrobial susceptibility results for each strain determined by the laser scatter method were compared with results from the conventional BMD test (Table 1). Laser scatter readings were also acquired from cell-free media containing each antimicrobial agent at the highest concentration used in this work. These data revealed that the presence of an antimicrobial did not affect readings (data not shown). Therefore, we compared the growth of bacteria with and without antimicrobials without adjusting for antimicrobial-produced background. However, vortex mixing, which is required to prepare homogeneous cell suspensions, increased laser scatter readings approximately 5-fold (data not shown). The increase may be due to the air bubbles created by use of the vortex mixer. Based on this observation, every sample, including no-cell controls, was mixed by the vortex before being transferred to cuvettes.
The linear range of detection of B. anthracis, Y. pestis, and B. pseudomallei in the laser scatter instrument was determined to be 104 to 108 CFU/ml, based on colony counts on agar media (Fig. 1). Without calibration, the cell density values from the laser scatter instrument differed from spread plate colony counts (Fig. 1). The CFU per milliliter determined by colony counts were lower for B. anthracis and higher for Y. pestis and B. pseudomallei than the cell density values from the laser scatter instrument (Fig. 1). This difference may be explained by the fact that B. anthracis grows in chains, and each colony on an agar plate may originate either from a chain of cells or from an individual cell. We applied the formula generated from the data in Fig. 1 to convert the laser scatter cell density values into calibrated CFU per milliliter concentrations that correspond to the colony counts for each bacterial species tested. A species-specific calibration was warranted since it is not realistic to generate a calibration curve for every bacterial strain in a timely manner.
FIG 1.

Linear range of bacterial cell concentrations used for calibration of the laser scatter instrument. Bacterial suspensions for B. anthracis Sterne, B. pseudomallei Bp82, or Y. pestis A1122 were serially diluted (3-fold) and measured as described in Materials and Methods. Average cell density values measured by laser scattering (x axis) were plotted versus average CFU/ml derived from colony counts (y axis). Horizontal error bars represent standard deviations (SD) from average cell density from laser scattering; vertical error bars represent SD from average colony counts from three plating experiments. R-squared values and the equations used to calculate the calibrated cell concentration are shown for each species.
The results of antimicrobial susceptibility testing based on calibrated CFU per milliliter readings are shown in Fig. 2 for B. anthracis, Fig. 3 for Y. pestis, and Fig. 4 for B. pseudomallei. Each graph represents one of three independent experiments performed for each strain with each antimicrobial agent tested. One susceptible (S) strain and one nonsusceptible (NS) strain of each bacterial species were tested. The susceptible strains were B. anthracis Sterne, Y. pestis A1122, and B. pseudomallei Bp82. Nonsusceptible strains were B. anthracis JB034, Y. pestis DSJB001, and B. pseudomallei JB039. A maximum of 16 samples can be tested in the instrument at one time. Therefore, two strains of the same species and two antimicrobial agents (three concentrations of each antimicrobial agent) were analyzed in each run in addition to a no-cell control and a no-drug control. One cell-free medium control was used for both the AMC and the CAZ tests for B. pseudomallei in Fig. 4. Similarly, a single no-drug (positive growth) control could be used for each strain that was tested with different antimicrobials in a single experiment. Therefore, the AMC and CAZ graphs for the susceptible strain of B. pseudomallei in Fig. 4 share the same no-drug control.
FIG 2.

Antimicrobial susceptibility testing of susceptible (Sterne) and nonsusceptible (JB034) strains of B. anthracis using laser light scattering technology. The curves for each antimicrobial agent tested are designated as follows: no-cell control (black bar), no-drug control (×), the lowest concentration of antimicrobial (△, blue), the middle concentration of antimicrobial (□, green), and the highest concentration of antimicrobial (○, red). Concentrations of antimicrobials were as follows: CIP at 0.25, 0.5, and 1 μg/ml; DOX at 1, 2, and 4 μg/ml; and PEN at 0.125, 0.25, and 0.5 μg/ml.
FIG 3.

Antimicrobial susceptibility testing of susceptible (A1122) and nonsusceptible (DSJB001) strains of Y. pestis using laser light scattering technology. The curves for each antimicrobial agent tested are designated as follows: no-cell control (black bar), no-drug control (×), the lowest concentration of antimicrobial (△, blue), the middle concentration of antimicrobial (□, green), and the highest concentration of antimicrobial (○, red). Concentrations of antimicrobials were as follows: CIP at 0.25, 0.5, and 1 μg/ml; DOX at 4, 8, and 16 μg/ml; and GEN at 4, 8, and 16 μg/ml.
FIG 4.

Antimicrobial susceptibility testing of susceptible (Bp82) and nonsusceptible (JB039) strains of B. pseudomallei using laser light scattering technology. The curves for each antimicrobial agent tested are designated as follows: no-cell control (black bar), no-drug control (×), the lowest concentration of antimicrobial (△, blue), the middle concentration of antimicrobial (□, green), and the highest concentration of antimicrobial (○, red). Concentrations of antimicrobials were as follows: AMC at 8/4, 16/8, and 32/16 μg/ml; CAZ at 8, 16, and 32 μg/ml; IPM at 4, 8, and 16 μg/ml; DOX at 4, 8, and 16 μg/ml; and SXT at 2/38, 4/76, and 8/152 μg/ml.
In growth curves generated from laser scatter measurements over time, there was an obvious inhibition of growth for the susceptible strain of B. anthracis in the presence of the antimicrobial agents CIP, DOX, and PEN compared to growth without antimicrobial agents (Fig. 2). The CFU per milliliter counts were more than 100-fold greater in the absence than in the presence of antimicrobial agents after 4 h of incubation. For the nonsusceptible strain of B. anthracis, the growth curves generated from media with and without antimicrobials were essentially the same throughout the incubation time, and growth inhibition was not detected (Fig. 2). To obtain these results, it was necessary to gently mix the contents of the cuvettes every hour as described in Materials and Methods. This mixing was different from the vigorous vortex mixing used to prepare initial cell suspensions and was performed in a manner that did not create bubbles, which would have affected the laser scatter reads. Without manual mixing of the B. anthracis samples, we observed decreased cell density measurements by the instrument for the susceptible strain of B. anthracis in the no-drug control after 6 h of incubation (data not shown). In the presence of PEN concentrations below the MIC, the nonsusceptible strain of B. anthracis appeared to have decreased cell density after about 5 h of incubation without mixing (data not shown). The decreased cell density detected by laser scatter was determined to result from chains of cells settling to the bottom of the cuvettes, where they would not be detected by the horizontal laser light scan that enters through a clear window in the middle of the cuvette. This apparent decrease in cell density was eliminated by manually resuspending the cells in the cuvettes for this bacterial species. Cell sedimentation did not occur throughout 10 h of incubation for either Y. pestis or B. pseudomallei (Fig. 3 and 4), as these species do not form chains under normal growth conditions, and the B. pseudomallei strains used in this work are motile. Even with manual resuspension of the cells in the cuvettes, cell density reads for B. anthracis, especially for the susceptible strain incubated without a drug, were more variable than the reads for Y. pestis or B. pseudomallei. This variability was likely due to the uneven scattering of laser light by the variable chain lengths of B. anthracis cells.
Growth inhibition of the susceptible strain of Y. pestis was evident after 6 h of incubation in the presence of all antimicrobial agents tested (Fig. 3). At this time point, the difference in CFU per milliliter counts of the susceptible strain with and without antimicrobials was approximately 10-fold. Similarly, growth inhibition of the susceptible strain of B. pseudomallei was detected after 6 h of incubation in the presence of AMC, DOX, IPM, and SXT, but not when this strain was incubated in the presence of CAZ (Fig. 4). Inhibition of growth by CAZ was not evident even after 10 h of incubation. The difference in CFU/ml numbers for the susceptible strain of B. pseudomallei grown with and without antimicrobials for 6 h varied from about 10-fold for AMC and SXT to about 100-fold for DOX and IPM. No growth inhibition by any of the antimicrobial agents tested was detected for the nonsusceptible strains of Y. pestis and B. pseudomallei (Fig. 3 and 4, respectively).
The average doubling times in the exponential phase of growth were about 30 min for B. anthracis, 60 min for B. pseudomallei and Y. pestis A1122, and 105 min for Y. pestis DSJB001. The potential effect of various growth rates on the performance of the laser scatter-based rapid susceptibility test is discussed below.
We performed statistical analyses to determine the earliest time during the incubation period that significant differences occurred between growth curves of susceptible strains with and without antimicrobials. The t test could not be applied to B. anthracis data because of the relatively wide variability in CFU per milliliter readings for the susceptible strain of B. anthracis grown without antimicrobials. Therefore, B. anthracis data were analyzed by the Wilcoxon test, which compares the ranks assigned to the values and is an alternative to the paired t test when the population is not normally distributed (17). The Wilcoxon test showed a statistically significant difference in CFU per milliliter at the incubation time of 1.5 to 2 h for the susceptible strain of B. anthracis grown in the presence of each antimicrobial agent tested compared to the same strain grown without an antimicrobial (P ≤ 0.05). By the t test, growth curves were determined to be significantly different (P ≤ 0.05) for the susceptible strain of Y. pestis within 2 h 30 min of incubation in the presence of any of the antimicrobial agents tested compared to growth without an antimicrobial agent. Growth of the susceptible strain of B. pseudomallei in the presence of AMC, DOX, IPM, and SXT was significantly different (t test, P ≤ 0.05) from growth without an antimicrobial agent after 3 h 40 min in all three experiments performed.
To determine if the laser scattering technology could distinguish between susceptible strains and strains with reduced susceptibility or low levels of resistance, additional strains of B. anthracis for which the MIC of CIP was close to the CLSI breakpoint for susceptibility (≤0.25 μg/ml) were tested. Strains JB031, JB032, and JB033, with the MICs of CIP at 0.12, 0.5, and 2 μg/ml, respectively (Table 1), were analyzed. Inhibition of growth was detected by laser scatter when the concentration of CIP was at or above the conventional MICs for each strain, and differences between cell density curves for growth and no growth could be established at 4 h of growth (Fig. 5) as with strains Sterne and JB034. Statistically significant differences between growth with and without CIP were determined to occur at the following times: for strain JB031, at 2 to 2.5 h in 0.25 μg/ml CIP and at 1.5 to 2 h in 0.5 μg/ml and 1 μg/ml CIP; for strain JB032, at 2 to 2.5 h in the presence of 0.5 μg/ml and 1 μg/ml CIP (Wilcoxon test, P ≤ 0.05). Thus, it required an additional 30 min of incubation to establish statistically significant differences between cell density results for B. anthracis strains with and without an antimicrobial when the concentration of CIP was near the MIC. There was no inhibition of growth of strain JB032 by 0.25 μg/ml CIP or of strain JB033 by CIP at any of the concentrations tested since these concentrations were below the MICs for these strains.
FIG 5.
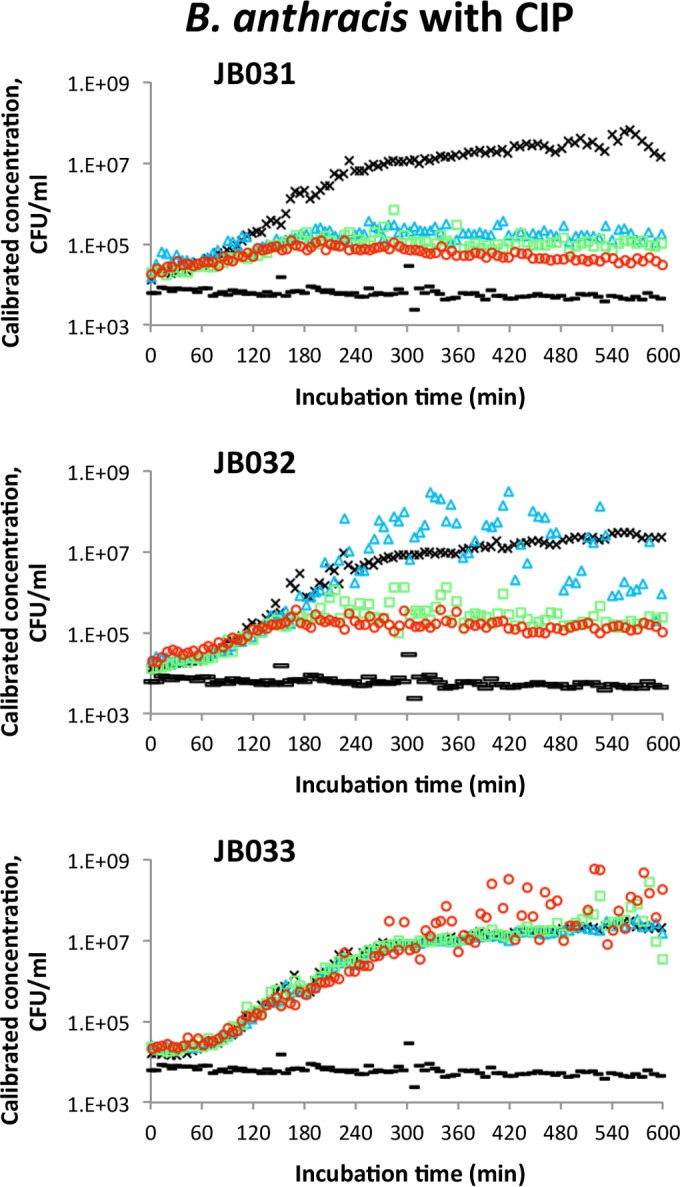
Antimicrobial susceptibility testing by laser light scattering of B. anthracis strains that have MICs of CIP near the CLSI breakpoint for susceptibility. The growth curves for strains JB031 (CIP MIC = 0.12 μg/ml), JB032 (CIP MIC = 0.5 μg/ml), and JB033 (CIP MIC = 2 μg/ml) are designated as follows: no-cell control (black bar), no-drug control (×), CIP = 0.25 μg/ml (△, blue), CIP = 0.5 μg/ml (□, green), and CIP = 1 μg/ml (○, red).
DISCUSSION
Rapid characterization of antimicrobial resistance of a bacterial BT agent is necessary to ensure an effective public health response. The laser light scattering technology evaluated in this study provided a simple, rapid method for assessing phenotypic antimicrobial resistance with a high level of confidence. Discrimination between susceptible and nonsusceptible strains of B. anthracis, Y. pestis, and B. pseudomallei was determined rapidly with this technology compared to the time required to perform conventional AST methods for most of the antimicrobials tested. As with other AST methods, a pure culture is required. However, the cell density range of detection with the laser scatter instrument allowed data collection to begin immediately when the inoculum was at the CLSI-recommended concentration of 2 × 10⁵ to 8 × 10⁵ CFU/ml (18). This is a 100-fold-greater sensitivity in detecting bacterial cells in suspension than that achieved by typical spectrophotometers and is comparable to the sensitivity of a flow cytometer (19). The laser scatter-based susceptibility test may be useful as a rapid screening test to detect antimicrobial resistance hours to days before conventional test results are available, providing data that is necessary to ensure that appropriate antimicrobial agents are distributed for treatment or postexposure prophylaxis.
Biosafety is a major concern when working with biothreat agents. This technology has the added benefit of requiring minimal manipulation of the bacterial isolate, which decreases biosafety risks. Once the bacterial suspensions are prepared and transferred to the cuvettes, no additional manipulation of the BT agent occurs, unlike other rapid methods that require subsequent steps, such as cell lysis and real-time PCR, and additional reagents. The exception was the necessity to mix to resuspend cells every hour in cuvettes with B. anthracis. Since this technology detects bacterial cells by measuring the scattering of a laser beam sent horizontally through the middle of the cuvette, the growth characteristics of each bacterial species tested must be considered when interpreting antimicrobial susceptibility results. The formation of chains of cells resulted in variable and/or decreased reads, and the user must differentiate this growth characteristic from cell sedimentation, as we observed with B. anthracis. In our experience with this instrument, manual mixing of the cell suspension prior to measuring the estimated cell density resolved the cell settling issue but did not completely eliminate the read variability for B. anthracis. The addition of an automated mixing platform inside this instrument may be beneficial both for decreasing variability in laser scattering reads by ensuring a homogeneous cell suspension and for biosafety since this would decrease the need for handling the samples. Cuvettes used in this study were equipped with built-in lids to minimize the risk of spills and instrument contamination.
As expected, the time required to determine susceptibility depended on the mechanism of action of the antimicrobial agent tested. We observed that the decrease in cell density measurements for the susceptible strain of B. pseudomallei in the presence of CAZ after 7 h of incubation was associated with a pronounced variability in the instrument readings (Fig. 4). These observations were likely due to the slow kinetics of bactericidal activity by CAZ on B. pseudomallei (20) due to this drug's mechanism of action. The target of CAZ is penicillin-binding protein 3 (PBP3). The inhibition of PBP3 activity prevents the separation of B. pseudomallei daughter cells, resulting in the formation of filamentous cells (21). The presence of filamentous cells of the CAZ-susceptible strain after 7 h of exposure to CAZ is likely responsible for the variation in CFU per milliliter data in a manner similar to that seen with B. anthracis after chains of cells formed and started to settle to the bottom of the cuvette.
The incubation time for conventional AST is specified by CLSI for each species of bacteria. Even though different strains within a species may have different growth rates, the recommended time of incubation for the species is usually sufficient to produce enough growth to visually determine susceptibility or resistance for most, if not all, strains. For a rapid phenotypic test that relies on a decreased incubation time in the presence of antimicrobials, determining the minimum incubation time that provides unambiguous, reproducible results is critically important. This decision is based on the growth characteristics of strains included in test development and evaluation. The growth rates of the strains used in this study were similar to previously reported doubling times for B. anthracis (22) and B. pseudomallei (16) growing in rich media at similar temperatures. The growth rate for Y. pestis strain DSJB001 was comparable to the previously reported rate for Y. pestis, although the doubling time for strain A1122 was more rapid (23). While most of the strains tested in this work had growth properties that are similar to those of at least some of the wild-type strains for their corresponding species, further studies using a diverse set of wild-type strains of each species will be required to ensure that the variability in growth characteristics among strains within a species is taken into consideration before establishing a minimum incubation time.
Resistance profiles of the strains used for developing a rapid phenotypic AST also have a major impact since it may be difficult to determine if a strain is susceptible or resistant to an antimicrobial when the MIC for this antimicrobial is near the breakpoint for susceptibility. Fortunately, the number of resistant strains of B. anthracis and Y. pestis that occur naturally is limited. Naturally occurring resistance to CIP has not been reported in B. anthracis. There has been a report of a DOX-resistant B. anthracis strain (24) and several reports on PEN-resistant B. anthracis strains (8, 24, 25). All clinical isolates of Y. pestis reported so far in the literature were susceptible to CIP, DOX, and GEN (26), except one isolate that was recovered from a patient in Madagascar in 1995 that was resistant to tetracycline but still susceptible to CIP and GEN (27, 28). Even B. pseudomallei, which has inherent resistance to many antimicrobials, has a low rate of resistance to AMC, CAZ, DOX, IPM, and SXT (6, 29, 30). However, although we would not expect many naturally occurring resistant strains with an MIC of an antimicrobial agent that is near the breakpoint for susceptibility, they may occur, especially if the decrease in susceptibility is due to a stepwise accumulation of mutations or to increased efflux. Laboratory-generated resistant strains of biothreat agents are unfortunately a possibility and have been reported for research purposes (1). The level of engineered resistance may vary. The introduction of an antimicrobial resistance gene will likely generate a relatively high MIC of the relevant antimicrobial agent. However, resistance that evolves from a gradual accumulation of mutations due to selective pressure from growth in the presence of low drug concentrations occurs in incrementally increased levels, which are dependent upon the position of the mutation and the resulting amino acid substitution. The laser scatter technology employed in this study was capable of distinguishing between CIP-susceptible and nonsusceptible strains of B. anthracis for which the MICs of CIP were near the CLSI-established breakpoint for susceptibility. Although a slightly longer incubation time was required to reach statistically significant differences in cell density growth curves, the susceptibility results were still available more than 12 h before conventional AST results.
The time required to ensure statistically significant differences in growth of susceptible strains with and without antimicrobials (t test and Wilcoxon test) elapsed before this difference could be visualized on the growth curve graphs. Additional studies with numerous wild-type strains of each biothreat agent are necessary to establish the minimum incubation time for each species using this technology. To make a confident decision, the fold differences in test results for growth with and without the relevant antimicrobial agents may be queried as previously described for a rapid AST method based on real-time PCR (10). Statistical likelihood modeling may also help to decide on the optimal incubation time for determining susceptibility.
In summary, antimicrobial susceptibility testing with the current format of the laser light scattering technology could be useful for phenotypic characterization of clinical and environmental bacterial isolates when few samples and antimicrobials need to be analyzed rapidly. The ease of using a laser scatter instrument and its software has greatly improved since the previous report from more than 20 years ago (15). This technology could provide a rapid screen to detect resistance by as much as 1 to 2 days before results are available from conventional methods.
ACKNOWLEDGMENTS
We thank Theresa Koehler, University of Texas Health Science Center, for providing B. anthracis strain UT308, Herbert Schweizer, University of Florida, for providing B. pseudomallei strain Bp82, Thomas Taylor, Centers for Disease Control and Prevention, for advice on statistical analysis, and Rhonda Soest and Ted McMinn, BacterioScan Inc., for assistance with the laser scatter instrument and software.
The findings and conclusions in the manuscript are those of the authors and do not necessarily represent the views of the Centers for Disease Control and Prevention. The mention of company names or products does not constitute endorsement by the CDC.
REFERENCES
- 1.Weigel LM, Morse SA. 2009. Implications of antibiotic resistance in potential agents of bioterrorism, p 1315–1338. In Mayers DL. (ed), Antimicrobial drug resistance, vol 2 Humana Press, Totowa, NJ. [Google Scholar]
- 2.Clinical and Laboratory Standards Institute. 2015. Methods for antimicrobial dilution and disc susceptibility testing of infrequently isolated or fastidious bacteria, 3rd ed M45. Clinical and Laboratory Standards Institute, Wayne, PA. [DOI] [PubMed] [Google Scholar]
- 3.Mohammed MJ, Marston CK, Popovic T, Weyant RS, Tenover FC. 2002. Antimicrobial susceptibility testing of Bacillus anthracis: comparison of results obtained by using the National Committee for Clinical Laboratory Standards broth microdilution reference and Etest agar gradient diffusion methods. J Clin Microbiol 40:1902–1907. doi: 10.1128/JCM.40.6.1902-1907.2002. [DOI] [PMC free article] [PubMed] [Google Scholar]
- 4.Inglis TJ, Rodrigues F, Rigby P, Norton R, Currie BJ. 2004. Comparison of the susceptibilities of Burkholderia pseudomallei to meropenem and ceftazidime by conventional and intracellular methods. Antimicrob Agents Chemother 48:2999–3005. doi: 10.1128/AAC.48.8.2999-3005.2004. [DOI] [PMC free article] [PubMed] [Google Scholar]
- 5.Lonsway DR, Urich SK, Heine HS, McAllister SK, Banerjee SN, Schriefer ME, Patel JB. 2011. Comparison of Etest method with reference broth microdilution method for antimicrobial susceptibility testing of Yersinia pestis. J Clin Microbiol 49:1956–1960. doi: 10.1128/JCM.00142-11. [DOI] [PMC free article] [PubMed] [Google Scholar]
- 6.Wuthiekanun V, Cheng AC, Chierakul W, Amornchai P, Limmathurotsakul D, Chaowagul W, Simpson AJ, Short JM, Wongsuvan G, Maharjan B, White NJ, Peacock SJ. 2005. Trimethoprim/sulfamethoxazole resistance in clinical isolates of Burkholderia pseudomallei. J Antimicrob Chemother 55:1029–1031. doi: 10.1093/jac/dki151. [DOI] [PubMed] [Google Scholar]
- 7.Cockerill FR., III 1999. Genetic methods for assessing antimicrobial resistance. Antimicrob Agents Chemother 43:199–212. [DOI] [PMC free article] [PubMed] [Google Scholar]
- 8.Chen Y, Tenover FC, Koehler TM. 2004. Beta-lactamase gene expression in a penicillin-resistant Bacillus anthracis strain. Antimicrob Agents Chemother 48:4873–4877. doi: 10.1128/AAC.48.12.4873-4877.2004. [DOI] [PMC free article] [PubMed] [Google Scholar]
- 9.Ross CL, Thomason KS, Koehler TM. 2009. An extracytoplasmic function sigma factor controls beta-lactamase gene expression in Bacillus anthracis and other Bacillus cereus group species. J Bacteriol 191:6683–6693. doi: 10.1128/JB.00691-09. [DOI] [PMC free article] [PubMed] [Google Scholar]
- 10.Weigel LM, Sue D, Michel PA, Kitchel B, Pillai SP. 2010. A rapid antimicrobial susceptibility test for Bacillus anthracis. Antimicrob Agents Chemother 54:2793–2800. doi: 10.1128/AAC.00247-10. [DOI] [PMC free article] [PubMed] [Google Scholar]
- 11.Vandamm JP, Rajanna C, Sharp NJ, Molineux IJ, Schofield DA. 2014. Rapid detection and simultaneous antibiotic susceptibility analysis of Yersinia pestis directly from clinical specimens by use of reporter phage. J Clin Microbiol 52:2998–3003. doi: 10.1128/JCM.00316-14. [DOI] [PMC free article] [PubMed] [Google Scholar]
- 12.Schofield DA, Sharp NJ, Vandamm J, Molineux IJ, Spreng KA, Rajanna C, Westwater C, Stewart GC. 2013. Bacillus anthracis diagnostic detection and rapid antibiotic susceptibility determination using ‘bioluminescent’ reporter phage. J Microbiol Methods 95:156–161. doi: 10.1016/j.mimet.2013.08.013. [DOI] [PubMed] [Google Scholar]
- 13.Cox CR, Saichek NR, Schweizer HP, Voorhees KJ. 2014. Rapid Burkholderia pseudomallei identification and antibiotic resistance determination by bacteriophage amplification and MALDI-TOF MS. Bacteriophage 4:e29011. doi: 10.4161/bact.29011. [DOI] [PMC free article] [PubMed] [Google Scholar]
- 14.Steinberger-Levy I, Zahavy E, Cohen S, Flashner Y, Mamroud E, Aftalion M, Gur D, Ber R. 2007. Enrichment of Yersinia pestis from blood cultures enables rapid antimicrobial susceptibility determination by flow cytometry. Adv Exp Med Biol 603:339–350. doi: 10.1007/978-0-387-72124-8_31. [DOI] [PubMed] [Google Scholar]
- 15.Conville PS, Witebsky FG, MacLowry JD. 1994. Antimicrobial susceptibilities of mycobacteria as determined by differential light scattering and correlation with results from multiple reference laboratories. J Clin Microbiol 32:1554–1559. [DOI] [PMC free article] [PubMed] [Google Scholar]
- 16.Propst KL, Mima T, Choi KH, Dow SW, Schweizer HP. 2010. A Burkholderia pseudomallei deltapurM mutant is avirulent in immunocompetent and immunodeficient animals: candidate strain for exclusion from select-agent lists. Infect Immun 78:3136–3143. doi: 10.1128/IAI.01313-09. [DOI] [PMC free article] [PubMed] [Google Scholar]
- 17.Wilcoxon F. 1945. Individual comparisons by ranking methods. Biometrics Bull 1:80–83. doi: 10.2307/3001968. [DOI] [Google Scholar]
- 18.Clinical and Laboratory Standards Institute 2015. Methods for dilution antimicrobial susceptibility tests for bacteria that grow aerobically; approved standard M07-A10, 10th ed Clinical and Laboratory Standards Institute, Wayne, PA. [Google Scholar]
- 19.Broeren MA, Maas Y, Retera E, Arents NL. 2013. Antimicrobial susceptibility testing in 90 min by bacterial cell count monitoring. Clin Microbiol Infect 19:286–291. doi: 10.1111/j.1469-0691.2012.03800.x. [DOI] [PMC free article] [PubMed] [Google Scholar]
- 20.Madhongsa K, Pasan S, Phophetleb O, Nasompag S, Thammasirirak S, Daduang S, Taweechaisupapong S, Lomize AL, Patramanon R. 2013. Antimicrobial action of the cyclic peptide bactenecin on Burkholderia pseudomallei correlates with efficient membrane permeabilization. PLoS Negl Trop Dis 7:e2267. doi: 10.1371/journal.pntd.0002267. [DOI] [PMC free article] [PubMed] [Google Scholar]
- 21.Chantratita N, Rholl DA, Sim B, Wuthiekanun V, Limmathurotsakul D, Amornchai P, Thanwisai A, Chua HH, Ooi WF, Holden MT, Day NP, Tan P, Schweizer HP, Peacock SJ. 2011. Antimicrobial resistance to ceftazidime involving loss of penicillin-binding protein 3 in Burkholderia pseudomallei. Proc Natl Acad Sci U S A 108:17165–17170. doi: 10.1073/pnas.1111020108. [DOI] [PMC free article] [PubMed] [Google Scholar]
- 22.Koehler TM. 2009. Bacillus anthracis physiology and genetics. Mol Aspects Med 30:386–396. doi: 10.1016/j.mam.2009.07.004. [DOI] [PMC free article] [PubMed] [Google Scholar]
- 23.Chauvaux S, Rosso ML, Frangeul L, Lacroix C, Labarre L, Schiavo A, Marceau M, Dillies MA, Foulon J, Coppee JY, Medigue C, Simonet M, Carniel E. 2007. Transcriptome analysis of Yersinia pestis in human plasma: an approach for discovering bacterial genes involved in septicaemic plague. Microbiology 153:3112–3124. doi: 10.1099/mic.0.2007/006213-0. [DOI] [PubMed] [Google Scholar]
- 24.Ortatatli M, Karagoz A, Percin D, Kenar L, Kilic S, Durmaz R. 2012. Antimicrobial susceptibility and molecular subtyping of 55 Turkish Bacillus anthracis strains using 25-loci multiple-locus VNTR analysis. Comp Immunol Microbiol Infect Dis 35:355–361. doi: 10.1016/j.cimid.2012.02.005. [DOI] [PubMed] [Google Scholar]
- 25.Caplan DM, Ivana S, Caplan ME. 2009. Susceptibility to antibiotics of Bacillus anthracis strains isolated in Romania. Roum Arch Microbiol Immunol 68:106–110. [PubMed] [Google Scholar]
- 26.Urich SK, Chalcraft L, Schriefer ME, Yockey BM, Petersen JM. 2012. Lack of antimicrobial resistance in Yersinia pestis isolates from 17 countries in the Americas, Africa, and Asia. Antimicrob Agents Chemother 56:555–558. doi: 10.1128/AAC.05043-11. [DOI] [PMC free article] [PubMed] [Google Scholar]
- 27.Galimand M, Guiyoule A, Gerbaud G, Rasoamanana B, Chanteau S, Carniel E, Courvalin P. 1997. Multidrug resistance in Yersinia pestis mediated by a transferable plasmid. N Engl J Med 337:677–680. doi: 10.1056/NEJM199709043371004. [DOI] [PubMed] [Google Scholar]
- 28.Guiyoule A, Gerbaud G, Buchrieser C, Galimand M, Rahalison L, Chanteau S, Courvalin P, Carniel E. 2001. Transferable plasmid-mediated resistance to streptomycin in a clinical isolate of Yersinia pestis. Emerg Infect Dis 7:43–48. http://wwwnc.cdc.gov/eid/article/7/1/70-0043. [DOI] [PMC free article] [PubMed] [Google Scholar]
- 29.Wuthiekanun V, Amornchai P, Saiprom N, Chantratita N, Chierakul W, Koh GC, Chaowagul W, Day NP, Limmathurotsakul D, Peacock SJ. 2011. Survey of antimicrobial resistance in clinical Burkholderia pseudomallei isolates over two decades in Northeast Thailand. Antimicrob Agents Chemother 55:5388–5391. doi: 10.1128/AAC.05517-11. [DOI] [PMC free article] [PubMed] [Google Scholar]
- 30.Crowe A, McMahon N, Currie BJ, Baird RW. 2014. Current antimicrobial susceptibility of first-episode melioidosis Burkholderia pseudomallei isolates from the Northern Territory, Australia. Int J Antimicrob Agents 44:160–162. doi: 10.1016/j.ijantimicag.2014.04.012. [DOI] [PubMed] [Google Scholar]
- 31.Sterne M. 1939. The use of anthrax vaccines prepared from avirulent (uncapsulated) variants of Bacillus anthracis. Onderspoort J Vet Sci Anim Ind 13:307–312. [Google Scholar]
- 32.Jawetz E, Meyer KF. 1943. Avirulent strains of Pasteurella pestis. J Infect Dis 73:124–143. doi: 10.1093/infdis/73.2.124. [DOI] [Google Scholar]