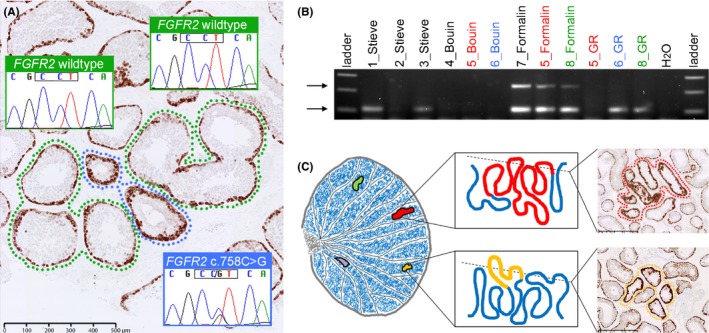
Figure 1.

Selfish spermatogonial selection at the cellular level: confirmation, investigation and modelling. (A) This MAGEA4‐stained section of formalin‐fixed testis, removed from a 39‐year‐old man because of an inguinal hernia, shows two adjacent tubular cross‐sections (blue surround) displaying consistently increased immunopositivity at the tubular periphery, compared to the normal appearance of the neighbouring tubular cross‐sections (green or no surround). Adjacent sections stained with FGFR3 and phospho‐AKT also exhibited increased immunopositivity (not shown), ruling out the possibility of a staining artefact. Genetic analysis of microdissected tubules showed that the FGFR2 c.758C>G (p.P253R) substitution, which causes Apert syndrome in the germline and occurs in endometrial cancer as a somatic mutation, was present in the immunopositive tubules, but not in the adjacent normally stained tubules, confirming the correlation between the immunopositive appearance and the presence of a selfish pathogenic mutation. Scale bar: 500 μm. Full details are provided in Fig. S7 of Maher et al. (2016). (B) Commonly used fixatives for testicular biopsies result in DNA degradation. DNA extraction was performed on 12 testicular biopsies processed in four different fixatives for similar durations. Multiple biopsies from three testes (5, 6, and 8, colour‐coded red, blue and green respectively) were immersed in different fixatives, enabling direct comparison of their impact on DNA degradation. Here, 35 cycles of PCR were performed, using 20 ng of DNA as template, with multiplexed GAPDH primers and cycling conditions as outlined by Agilent Technologies FFPE‐Derived DNA Quality Assessment guide (G9900‐90050). In all three formalin‐fixed samples both the larger (236 bp) and smaller (105 bp) fragments (arrows) were readily amplified, but in Stieve‐ and GR‐fixed samples only the smaller fragment could be amplified (in two of three samples in each case) indicating poorer DNA preservation. No DNA amplification was detected in any of the Bouin‐fixed samples, consistent with Qubit fluorometer measurements, suggesting DNA degradation. (C) Diagrammatic illustration of a testis containing multiple independent mutant clones, the geographical course of clonal expansions within seminiferous tubules (red, yellow) and examples of tubular cross‐sections of immunopositive clones containing pathogenic mutations. Scale bars: 500 μm. See Maher et al. (2014) for further discussion.
