Abstract
Objectives
When the recurrent laryngeal nerve (RLN) is injured, functional recovery may be limited by the number of axons that regrow across the site of injury, and by the proportions of these axons that reinnervate the antagonistic muscle (synkinesis). This process was investigated in a computer model of RLN recovery.
Methods
The developed computer program accepted as inputs: number of RLN axons; proportions of axons originally innervating adductor vs. abductor; fraction of axons transected; fraction of axons that grow back; and width of one standard deviation about the mean. The program employed random sampling from a normal distribution to model various degrees of recovery, using random numbers to assign each axon to the correct muscle, an incorrect muscle, or no recovery. Each simulation was run 1000x and the mean, highest and lowest degrees of synkinesis were determined.
Results
More severe injuries were associated with greater degrees of synkinesis. Extremes of synkinesis were possible, but were rare. One example result, for a 50% injury with a 50% recovery rate, found: in the adductor muscles, 74.8% of axons will be innervated, of which 49.2% are the original uninjured axons, 19.4% are recovered adductor axons, and 6.2% are misdirected abductor axons. In the posterior cricoarytenoid (PCA), these values were 75.7%, 50.8%, 6.1%, and 18.8%, respectively. Results of many such simulations are plotted.
Conclusions
Laryngeal synkinesis can be simulated based on known anatomic ratios and estimated recovery rates. The PCA is invariably much more affected by synkinetic reinnervation than are the adductor muscles.
Keywords: Recurrent laryngeal nerve, vocal cord paralysis, computer simulation, synkinesis
INTRODUCTION
Laryngeal synkinesis refers to aberrant reinnervation that occurs following injury to the recurrent laryngeal nerve (RLN), in which adductor axons find their way into the abductor muscle (posterior cricoarytenoid, PCA) and/or the abductor axons reinnervate the adductor muscles (thyroarytenoid, TA, lateral cricoarytenoid, LCA, and interarytenoid, IA).{1} It has been demonstrated by laryngeal electromyographic (EMG) studies in patients{2–4} and in laboratory animal preparations.{5–6} When a significant number of PCA fibers aberrantly reinnervate the adductor muscles, the vocal fold may adduct on inspiratory effort, resulting in airway obstruction.{7,8} Crumley has written much about laryngeal synkinesis, including a proposed classification system.{8}
The RLN contains about 1000 axons,{8–10} possibly with a higher number on the left side.{10} These are thought to be approximately 75% adductor fibers and 25% abductor fibers, based on the muscle masses that are innervated. The adductor and abductor axons are not topographically oriented along the length of the RLN, but instead appear to be randomly distributed after it branches from the vagus and remain so until its most distal branching region.{11–12} Thus, the traumatized axons of a partially or fully transected RLN, even when precisely aligned, have little chance of finding their original partners, and instead may match up to any available axonal tubule across the injury site. This process appears to be random,{5} which would explain the high incidence of synkinesis following most RLN injuries.
Grossly, microscopically, and histologically, one cannot discern which RLN axons are adductor (AD) or abductor (AB), except by retrograde labeling.{11–12} A method of quantifying synkinesis has not been firmly established,{6} but it would be quite useful in order to develop treatments for new patients with unilateral vocal fold paralysis (UVFP) that might prevent synkinesis or modulate it. Laryngeal EMG, which can be semiquantitative, was used by Nishimoto et al. to demonstrate simultaneous TA and PCA activity during inspiration in a rat model of complete RLN transection and re-anastomosis.{13} Zealear et al. showed “reversal” of EMG ratios between TA and PCA in a similar canine model.{14} Smith et al. used EMG turns analysis to determine abductor activity in the adductor muscles in human patients with UVFP; however, the degree of RLN injury was not known and thus could not be correlated to the synkinesis measure.{15}
When considering this problem, the question arises as to how much synkinesis might occur under various states of RLN injury, i.e., what sorts of injuries might lead to more severe synkinesis problems? This question can be approached with a computer simulation, using certain assumptions (such as a random process of axons finding one another) and defining certain parameters based on known anatomic relationships (number of axons, etc.). A computer simulation program enables one to quickly consider many combinations of initial conditions, and to repeat the process many thousands of times in a short time frame to yield some insight into this process. This study attempted to accomplish this goal.
METHODS & MATERIALS
A program was written using BASIC programming language software on a personal computer. The following were used as input variables:
number of RLNs to be simulated with same starting parameters. Most simulations were run with 1000 RLNs.
number of motor axons per nerve (mean and standard deviation(SD)). A typical number to model the human RLN is 1000 axons, but any number can be input. Most simulations used a SD of 5% (50 out of 1000 axons, or 150 for 3 SDs). The SD was used to determine the width of the bell-curve of a normal distribution (see below).
proportion of RLN axons for adductor vs abductor muscles (with SD). Most simulations assumed 75% adductor axons and 25% abductor axons, with SD of 2%; but any numbers may be entered.
percentage of axons injured. Injury models of 50% were used most often, but any fraction may be chosen.
proportion of adductor axons that successfully cross injury site and reinnervate distal muscle(s) (with SD). Data from animal experiments suggest this figure may be as high as 90% or more,{16} but any value may be entered. Most simulations used 80%.
proportion of abductor axons that successfully cross injury site and reinnervate distal muscle(s) (with SD). This need not be the same as the value used for the adductors, but for most simulations, both were set at 80%.
Assumptions
1. The adductor and abductor axons are randomly distributed within the RLN at the site of injury
This follows the work of Gacek et al.,{11–12} who performed retrograde labeling of thyroarytenoid or posterior cricoarytenoid muscles and found the axons have no topographic organization within the RLN throughout most of its length. Flint et al.{5} also used retrograde labeling and indicated the recovery patterns appeared to be random. Thus, if we use an adductor fraction of 75%, for example, then the recovering axons (of both types) will have a 75% chance of growing across the injury site into adductor channels and a 25% chance of reinnervating the PCA.
2. Biologic processes tend to follow a normal distribution
Thus, for a typical simulation comparing results for 1000 RLNs, rather than assigning them all the same total axon count of 1000, it made more sense to draw randomly from a bell-shaped curve in which the mean was 1000 axons. The program was written to allow flexibility in the shape of this curve by inputting the SD. We know from statistics that in a normal distribution, 68% of values will fall within one standard deviation of the mean, 95% within two, and 99.7% within three SDs. The spread of possible values can be adjusted by the user choosing a smaller or larger SD. In the simulation program, this option was made available for several of the variables. If desired, the user can choose an SD of zero and there will be no spread.
The built-in (pseudo)-random number generators in most computers return a decimal number from 0–1, with each value having equal probability (i.e., a linear scale). In order to produce a normal distribution of random numbers, a Box-Muller transformation was performed.{17} This method converts a linear distribution into a normal distribution using the equations
and
Here, U1 and U2 are random numbers selected from a linear scale, and Z1 and Z2 are the corresponding numbers generated on the normally distributed scale.
3. Sensory fibers in the RLN were ignored
The RLN carries a small population, perhaps 10% of its axons, as sensory afferents from the mucosa of the vocal fold and immediate subglottis, and possibly from muscle spindles in the intrinsic laryngeal muscles.{11,12} These sensory axons are subjected to the same injury as the rest of the RLN, although Gacek at el.’s data suggest that they are bundled at one edge of the RLN. It is not known what happens if a motor neuron grows distally into a sensory afferent, but most likely it will be a nonfunctional connection. For purposes of this simulation, the sensory fibers were completely left out.
Algorithm
After the required input variables are collected, the program starts with axon #1 and, using the random number generator, determines:
what type of axon was this originally (AD or AB)?
was it damaged in the injury?
if damaged, did it recover? (did it grow back across the injury site and reach a laryngeal muscle)?
if it recovered, did it recover into an adductor muscle or into the PCA?
The final result for axon #1 is stored, and the program repeats this process independently for another axon, until the number of axons previously selected for that RLN has been reached. The results are stored, the counters are reset to zero, and the process starts over for the next RLN, repeating until all RLNs requested have been simulated.
Software Verification
If all of the random components in the algorithm are removed, it can be reduced to a series of algebraic equations with exact solutions that do not require a computer. The software was tested by setting all random variables to constants and setting all standard deviations to zero. The results obtained in this way are a perfect match for the exact solutions. This indicates that the program does what it is supposed to do.
The subroutine for the Box-Muller transformation was tested as stand-alone code to create a curve of random data between ±1 and a SD of 0.25. With 100000 samples, it resulted in a bell-shaped curve with mean of 0.0006 and standard deviation 0.2505, compared with values of 0.0000 and 0.2500 for a true normal distribution. Also, the fraction of values within 1, 2, or 3 SDs of the mean was 68.25%, 95.45%, and 99.74%, respectively, compared with expected values of 68.27%, 95.45%, and 99.73% in a true normal distribution. This shows the subroutine does a nearly-perfect job of converting a linearly distributed series of random numbers into a normally distributed set of numbers.
Data Analysis
The program determines the mean and standard deviation for all the RLNs simulated, and also tracks the maximum and minimum values, for all of the parameters listed in Table 1. Two types of laryngeal synkinesis may be defined based on the proportion of aberrant axons in the adductor or abductor target muscle:
Table 1.
List of computer program output variables, and sample results for one simulation. This sample generated with the following input: 1000 RLNs, 1000±50 axons per RLN, adductor fraction 75±2%, 50% RLN injury, AD and AB recovery fraction 80±0%. Note that AD-to-AD axon count includes the 49.5% of adductor axons that were not injured (372.1) plus the injured adductor axons that recovered into distal adductor targets (230.1). Similar for AB-to-AB (124.8 and 24.4, respectively).
| Parameter | Definition | Sample Data Set | |||
|---|---|---|---|---|---|
| Mean | SD | Min | Max | ||
| # axons | # axons in current RLN | 1000.2 | 48.4 | 855 | 1185 |
| AD | # adductor axons | 752.1 | 41.6 | 605 | 931 |
| AB | # abductor axons | 248.1 | 23.2 | 189 | 321 |
| AD INJ | # AD axons injured | 380.0 | 24.9 | 305 | 482 |
| AD INJ % | % of AD axons injured | 50.5 | 1.8 | 45.1 | 56.2 |
| AB INJ | # AB axons injured | 123.3 | 13.9 | 81 | 169 |
| AB INJ % | % of AB axons injured | 49.7 | 3.1 | 38.9 | 60.6 |
| AD-to-AD | # distal AD axons from AD source | 602.2 | 36.7 | 483 | 735 |
| AD-to-AB | # PCA axons now from AD source | 75.1 | 9.7 | 47 | 115 |
| AB-to-AD | # distal AD axons from AB source | 74.5 | 9.6 | 47 | 108 |
| AB-to-AB | # PCA axons now from AB source | 149.2 | 16.7 | 100 | 206 |
| % AB in AD | % of AD axons now from AB source | 11.0 | 1.3 | 6.9 | 15.1 |
| % AD in AB | % of PCA axons now from AD source | 33.5 | 3.3 | 24.6 | 46.5 |
For these purposes, all of the intrinsic adductor muscles (TA, LCA, IA) are considered as a single group. It is possible (and very likely) that inter-adductor synkinesis also occurs (e.g., TA axons innervating LCA muscle), but the clinical significance of this is unknown. (It would be possible to modify the simulation program to consider this in a future version).
In order to consider the impact of each variable on total synkinesis, the simulation program was run multiple times holding all other variables constant. The output was entered in a spreadsheet program and plotted to create the graphs below.
RESULTS
A sample data set is shown in Table 1. The total synkinesis values are given in the last two rows. It can be seen that, in this example, the AD into AB synkinesis is about three times higher than AB into AD synkinesis, with average values of 33.5% vs. 11%. This relates primarily to the severity of injury (50% in this case), and to the choice of an original adductor-abductor ratio of 75:25%. The ratio is not exact due to the use of a random number generator. This likely simulates the data that would be collected if we could carry out a “real” experiment of this type.
Effect of Injury Severity
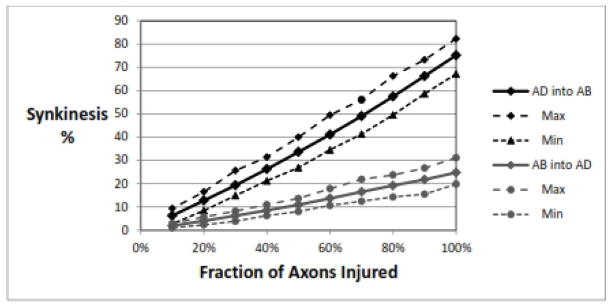
This is shown in Figure 1. Clearly a more severe injury leads to more synkinesis. The AD-into-AB synkinesis is greater than the AB-into-AD synkinesis at all levels of injury, at about the same 3:1 ratio as seen in the previous example. It can be seen that after a complete transection (100%) injury, about 75% of the fibers that reinnervate the PCA muscle come from adductor axons. The maximum and minimum values demonstrate the variability in the data based on the random number generator and the normal distribution from which it draws. This range shows that a complete transection injury would be expected to have at least 67%, and perhaps as much as 82%, of fibers reinnervating the PCA muscle that were originally adductor fibers.
Figure 1.
Effect of injury severity. For both types of synkinesis, AD into AB (top) and AB into AD (bottom), the amount of synkinesis increases with severity of injury. Parameters: 1000 RLNs, 1000±50 axons/RLN, adductor fraction 75%, recovery rate for AD=AB= 80±0%. AD, adductor; AB, abductor.
Effect of Adductor Fraction
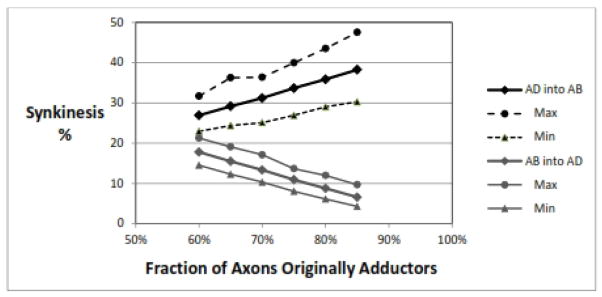
Figure 2 shows how increasing the fraction of RLN axons that are presumed to originally innervate the adductor muscles causes an increase in AD-into-AB synkinesis. This is logical, as a higher adductor fraction would mean more of the injured axons are adductor type and thus more adductor axons are available to fill the empty distal axons going to the PCA. The AB-into-AD synkinesis decreases proportionally.
Figure 2.
Effect of adductor fraction. As the proportion of RLN axons that are represented as originally innervating adductor muscles increases, there is more AD-into-AB synkinesis and less AB-into-AD synkinesis. Parameters: 1000 RLNs, 1000±50 axons/RLN, 50% nerve injury, recovery rate for AD=AB= 80±0%.
Effect of Rate of Axon Recovery
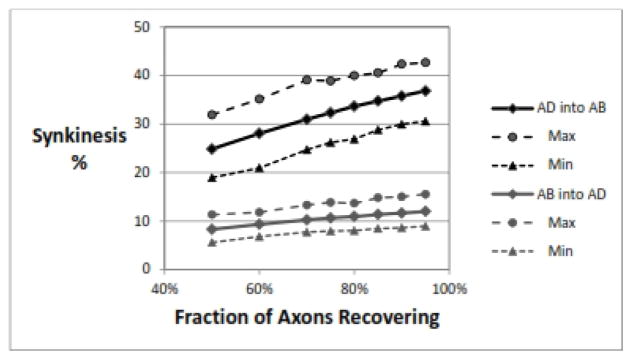
The number of injured axons that successfully grow across the injury site and find their way into a distal laryngeal muscle may vary, and likely depends on several factors. The RLN in general seems to have a strong tendency to recover,{8} and axonal recovery rates of 80–90% are commonly reported in animal experiments.{16} In Figure 3, it can be seen that higher numbers of axons growing back lead to higher levels of synkinesis of both types. This makes sense, as the population of axons available to reinnervate the PCA will always be predominantly AD axons, and randomly adding them to the PCA will increase the proportion of wrong-innervation. The same argument holds for reinnervation of the adductors. In this simulation, the recovery rates for AD and AB axons were held equivalent.
Figure 3.
Effect of fraction of axons recovering. As more axons successfully cross the injury site to innervate random distal axons, there are more incorrect reinnervations and the rate of synkinesis of both types goes up. Parameters: 1000 RLNs, 1000±50 axons/RLN, adductor fraction 75±2%, 50% nerve injury, recovery rate for AD=AB.
Effect of Adductor Recovery Rate Higher Than Abductor Recovery Rate
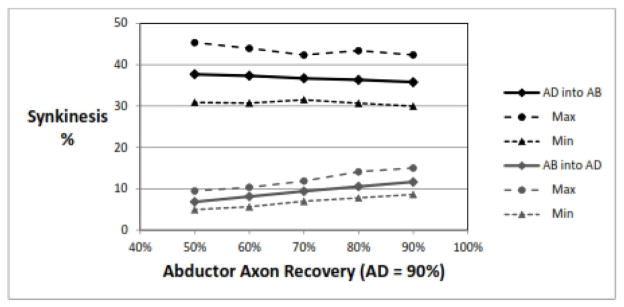
Semon’s law has sometimes been interpreted as stating that following a RLN injury, the adductor muscles will recover faster and more completely than the abductor muscle.{18} There may very well be intrinsic differences in the ability of AD vs AB axons to recover that have yet to be determined. Figure 4 shows that a difference in recovery rate would only contribute minimally to the rate of synkinesis of both types.
Figure 4.
Effect of of adductor recovery rate higher than abductor recovery rate. For this simulation, the adductor recovery rate was held constant at 90% while the abductor rate was varied from 90% to 50% (moving right-to-left on the plot). As the difference in recovery rates increases, the rate of AD-into-AB synkinesis also increases, while AB-into-AD synkinesis decreases; but even at large differences the change is small. Parameters: 1000 RLNs, 1000±50 axons/RLN, adductor fraction 75±2%, 50% nerve injury, recovery rate for AD= 90±0%.
Effect of Number of Axons
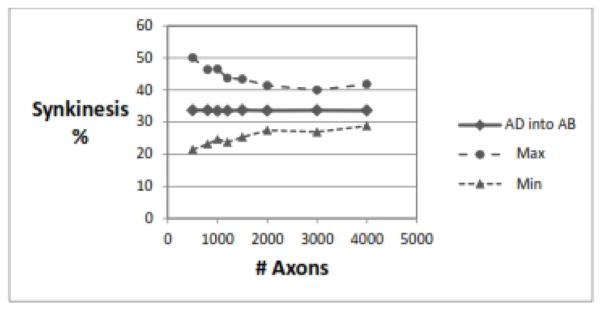
The simulation program allows the user to select any average number of axons in the RLN and to set the normal distribution to be narrow or broad by adjusting the standard deviation. Figure 5 shows that having more axons in each nerve leads to a lower degree of variability in the simulation results, but does not change the average amount of synkinesis of either type. As with most statistical analyses, a higher number of measurements leads to a lower standard deviation.
Figure 5.
Effect of number of axons. As the number of axons increases, there is more homogeneity (less variability) in the extreme, but the rate of synkinesis does not change. Shown is AD-into-AB synkinesis, but AB-into-AD results were similar. Parameters: 1000 RLNs, SD for number of axons ±5%, adductor fraction 75±2%, 50% nerve injury, recovery rate for AD=AB= 80±0%.
Other Variables
The effect of broadening the normal distribution by increasing the standard deviation was examined, varying the SD for the AD or AB recovery rates, for the adductor fraction, and for the number of axons. None of these effects was statistically significant, although higher SDs led to a slightly higher range of maximal and minimal values.
The number of RLNs used in most simulations was 1000; but for comparison, this was varied from 500 to 100,000, with no statistically significant effect on the amount of synkinesis of either type. Apparently 1000 iterations are enough to reach stable results.
DISCUSSION
This project did provide some insights into the synkinesis process. Although frequently discussed, it was never clear to this author just how severe synkinesis can be. This simulation suggests that in the worst case, as many as 82% of the fibers that reinnervate the PCA could be adductor fibers. The antagonism of the PCA muscle with such innervation could certainly prevent effective adduction. Of course, the conclusions based on a computer simulation are only as good as the assumptions and conditions that went into creating the model.
This simulation did not include any consideration of the sizes of the reinnervated motor units (number of muscle fibers innervated by a single axon, or MF/A). Available data suggest that the normal intrinsic laryngeal muscles do not have uniform motor unit sizes. Santo Neto and Marques found an average motor unit size of 9.2 MF/A for TA, about 17.5 MF/A for LCA, IA and PCA, and 20.5 MF/A for CT muscles.{19} The vocalis (medial) portion of the TA may have even smaller motor units, for fine motor control. Following nerve injury and reinnervation, motor unit sizes may change,{20} but this process has not been well-characterized in the larynx. It would be possible to add estimates of motor unit sizes to the computer simulation algorithm, but without additional data, the results would be highly speculative.
The optimal treatment of UVFP will likely include some means for minimizing or reducing synkinesis. Presently, botulinum toxin injections may be used to prevent antagonism of a synkinetically innervated muscle.{7–8} An alternate approach using microtubule inhibitors to block PCA reinnervation has recently been proposed.{21–22} Zealear et al. reported less synkinesis occurred in the PCA when it was continuously stimulated electrically at 10 pulses per second.{14} A clinical means for accurately quantifying the degrees of RLN injury and synkinesis will also be useful to determine which patients would benefit from these interventions; additional refinement of quantitative EMG is presently the most promising methodology.{15} It appears that someday, control of laryngeal synkinesis may be possible. This computer simulation provided some insight into how severe, or mild, synkinesis can be.
CONCLUSIONS
This project demonstrated that the process of laryngeal synkinesis may be modeled and studied with a computer model. Within the limitations of the underlying assumptions, it also showed that 1) synkinesis increases with severity of RLN injury; 2) AD-into-AB synkinesis is always greater than AB-into-AD synkinesis, approximately three-fold; 3) with a maximal (complete transection) RLN injury, AD-into-AB synkinesis may reach 82%; 4) an increase in the number of axons that successfully recover brings with it an increase in the degree of synkinesis. Further refinements in the computer program can be made when additional data become available to verify or alter its underlying assumptions.
Acknowledgments
Supported by grant #R01DC010884 from the National Institutes of Health.
Footnotes
Presented at the 118th meeting of The Triological Society, April 24, 2015, Boston, MA.
Conflicts of Interest: None
Financial Disclosures: None
LEVEL OF EVIDENCE: n/a (computer simulation)
ONLINE RESOURCE
Readers interested in running the simulation for themselves, entering their own choices for the simulation parameters, may access the software developed for this project as “freeware” at: http://oto.wustl.edu/portals/0/synksim.zip
References
- 1.Crumley RL. Laryngeal synkinesis revisited. Ann Otol Rhinol Laryngol. 2000;109:365–71. doi: 10.1177/000348940010900405. [DOI] [PubMed] [Google Scholar]
- 2.Blitzer A, Jahn AF, Keidar A. Semon’s law revisited: an electromyographic analysis of laryngeal synkinesis. Ann Otol Rhinol Laryngol. 1996;105:764–9. doi: 10.1177/000348949610501002. [DOI] [PubMed] [Google Scholar]
- 3.Maronian NC, Robinson L, Waugh P, Hillel AD. A new electromyographic definition of laryngeal synkinesis. Ann Otol Rhinol Laryngol. 2004;113:877–86. doi: 10.1177/000348940411301106. [DOI] [PubMed] [Google Scholar]
- 4.Statham MM, Rosen CA, Smith LJ, Munin MC. Electromyographic laryngeal synkinesis alters prognosis in vocal fold paralysis. Laryngoscope. 2010;120:285–90. doi: 10.1002/lary.20629. [DOI] [PubMed] [Google Scholar]
- 5.Flint PW, Downs DH, Coltrera MD. Laryngeal synkinesis following reinnervation in the rat. Neuroanatomic and physiologic study using retrograde fluorescent tracers and electromyography. Ann Otol Rhinol Laryngol. 1991;100:797–806. doi: 10.1177/000348949110001003. [DOI] [PubMed] [Google Scholar]
- 6.Paniello RC, West SE. Laryngeal adductory pressure as a measure of post-reinnervation synkinesis. Ann Otol Rhinol Laryngol. 2000;109:447–51. doi: 10.1177/000348940010900502. [DOI] [PubMed] [Google Scholar]
- 7.Azadarmaki R, Mirza N, Soliman AM. Unilateral true vocal fold synkinesis presenting with airway obstruction. Ann Otol Rhinol Laryngol. 2009;118:587–91. doi: 10.1177/000348940911800810. [DOI] [PubMed] [Google Scholar]
- 8.Crumley RL. Laryngeal synkinesis: its significance to the laryngologist. Ann Otol Rhinol Laryngol. 1989;98:87–92. doi: 10.1177/000348948909800201. [DOI] [PubMed] [Google Scholar]
- 9.Chen D, Chen S, Wang W, Zhang C, Zheng H. Spontaneous regeneration of recurrent laryngeal nerve following long-term vocal fold paralysis in humans: histologic evidence. Laryngoscope. 2011;121:1035–9. doi: 10.1002/lary.21739. [DOI] [PubMed] [Google Scholar]
- 10.Jotz GP, de Campos D, Rodrigues MF, Xavier LL. Histological asymmetry of the human recurrent laryngeal nerve. J Voice. 2011;25:8–14. doi: 10.1016/j.jvoice.2009.06.007. [DOI] [PubMed] [Google Scholar]
- 11.Gacek RR, Malmgren LT, Lyon MJ. Localization of adductor and abductor motor nerve fibers to the larynx. Ann Otol Rhinol Laryngol. 1977;86:771–6. [PubMed] [Google Scholar]
- 12.Malmgren LT, Lyon MJ, Gacek RR. Localization of abductor and adductor fibers in the kitten recurrent laryngeal nerve: use of a variation of the horseradish peroxidase tracer technique. Exp Neurol. 1977;55:187–98. doi: 10.1016/0014-4886(77)90169-8. [DOI] [PubMed] [Google Scholar]
- 13.Nishimoto K, Kumai Y, Yumoto E. Paradoxical movement of rat vocal folds following recurrent laryngeal nerve injury. Acta Otolaryngol. 2014;134:1164–71. doi: 10.3109/00016489.2014.936625. [DOI] [PubMed] [Google Scholar]
- 14.Zealear DL, Mainthia R, Li Y, Kunibe I, Katada A, Billante C, Nomura K. Stimulation of denervated muscle promotes selective reinnervation, prevents synkinesis, and restores function. Laryngoscope. 2014;124:E180–7. doi: 10.1002/lary.24454. [DOI] [PubMed] [Google Scholar]
- 15.Smith LJ, Rosen CA, Niyonkuru C, Munin MC. Quantitative electromyography improves prediction in vocal fold paralysis. Laryngoscope. 2012;122:854–9. doi: 10.1002/lary.21884. [DOI] [PubMed] [Google Scholar]
- 16.Shin RH, Friedrich PF, Crum BA, Bishop AT, Shin AY. Treatment of a segmental nerve defect in the rat with use of bioabsorbable synthetic nerve conduits: a comparison of commercially available conduits. J Bone Joint Surg Am. 2009 Sep;91(9):2194–204. doi: 10.2106/JBJS.H.01301. [DOI] [PubMed] [Google Scholar]
- 17.Box GEP, Muller ME. A note on the generation of random normal deviates. Annals Mathemat Statist. 1958;29:610–611. [Google Scholar]
- 18.Kuczkowski J, Plichta L, Stankiewicz C. Sir Felix Semon (1849–1921): Pioneer in neurolaryngology. J Voice. 2012;26:87–89. doi: 10.1016/j.jvoice.2010.10.015. [DOI] [PubMed] [Google Scholar]
- 19.Santo Neto H, Marques MJ. Estimation of the number and size of motor units in intrinsic laryngeal muscles using morphometric methods. Clin Anat. 2008;21:301–6. doi: 10.1002/ca.20624. [DOI] [PubMed] [Google Scholar]
- 20.Rafuse VF, Gordon T. Incomplete rematching of nerve and muscle properties in motor units after extensive nerve injuries in cat hindlimb muscle. J Physiol. 1998;509:909–26. doi: 10.1111/j.1469-7793.1998.909bm.x. [DOI] [PMC free article] [PubMed] [Google Scholar]
- 21.McRae BR, Kincaid JC, Illing EA, Hiatt KK, Hawkins JF, Halum SL. Local neurotoxins for prevention of laryngeal synkinesis after recurrent laryngeal nerve injury. Ann Otol Rhinol Laryngol. 2009;118:887–93. doi: 10.1177/000348940911801210. [DOI] [PubMed] [Google Scholar]
- 22.Paniello RC. Vocal fold paralysis: improved adductor recovery by vincristine blockade of posterior cricoarytenoid. Laryngoscope. 2015;125:655–60. doi: 10.1002/lary.24951. [DOI] [PMC free article] [PubMed] [Google Scholar]


