

Abstract
Purpose
To construct and validate among patients with multiple myeloma (MM) who were treated with intensive therapy a prognostic index of early MM progression–related death.
Patients and Methods
Patient-level data from the Intergroupe Francophone du Myélome (IFM) 2005-01 trial (N = 482) were used to construct the prognostic index. The event was MM progression–related death within 2 years from treatment initiation. The index was validated using data from three other trials: the Gruppo Italiano Malattie Ematologiche dell' Adulto (GIMEMA) 26866138-MMY-3006 trial (N = 480), the Programa para el Estudio de la Terapéutica en Hemopatía Maligna (PETHEMA)–GEMMENOS65 trial (N = 390), and the Hemato-Oncologie voor Volwassenen Nederland (HOVON) –65/German-Speaking Myeloma Multicenter Group (GMMG) –HD4 trial (N = 827).
Results
The risk of early MM progression–related death was related to three independent prognostic variables: lactate dehydrogenase (LDH) higher than than normal, International Staging System 3 (ISS3), and adverse cytogenetics [t(4;14) and/or del(17p)]. These three variables enabled the definition of an ordinal prognostic classification composed of four scores (0 to 3). Patients with a score of 3, defined by the presence of t(4;14) and/or del(17p) in addition to ISS3 and/or high LDH, comprised 5% (20 of 387 patients) to 8% (94 of 1,139 patients) of the patients in the learning and validation samples, respectively, and they had a very poor prognosis. When applied to the population of 855 patients who had received bortezomib-based induction therapy in the four trials, the prognostic classification was also able to segregate patients into four categories, with a very poor prognosis attributed to patients with a score of 3.
Conclusion
Our model allows the simple definition of a subgroup of MM patients at high risk of early MM progression–related death despite the use of the most modern and effective strategies.
INTRODUCTION
The course of multiple myeloma (MM) is highly variable. Though some patients may survive more than 10 years, others succumb to highly refractory disease within a few months. Many studies have identified prognostic factors capable of predicting this heterogeneity in survival. A major advance was the development of the International Staging System (ISS) in 2005, which combines serum β2-microglobulin and albumin levels within a powerful and reproducible three-stage classification.1 The ISS was developed using survival data from patients treated from 1981 through 2002 and was validated both in patients younger than and at least 65 years old. In patients younger than 65 years, who present with ISS stage 3 disease at diagnosis, the median overall survival (OS) was found to be 33 months compared with 50 and 69 months in patients with ISS2 and ISS1, respectively. Over the last decade, it has also been shown that recurrent genetic abnormalities present in the malignant cells carry a strong prognostic power. Among them, the most important are the translocation of chromosomes 4 and 14 [t(4;14)] and deletion in the short arm of chromosome 17 [del(17p)].2–3 Recently, an analysis conducted by the International Myeloma Working Group demonstrated that combining both t(4;14) and deletion (17p), along with ISS stage, significantly improved the prognostic value in terms of progression-free survival (PFS) and OS.4 The additional impact of patient age and use of high-dose therapy (HDT) was also demonstrated. Nevertheless, in these two large series analyzed for prognostic classification, none of the patients had received bortezomib or lenalidomide as part of front-line therapy.1,4 Moreover, OS curves including all causes of death were plotted, including not only progressive disease, but also toxic death or death as a result of comorbidities. Therefore, there is a lack of data on prognostic factors of early MM progression–related death only, especially in the context of the most recent therapies that include novel agents upfront. The aim of our study was to define a simple prognostic index predicting early MM progression–related death with data derived from four recent phase III trials involving patients younger than 66 years treated with novel agent-based induction and autologous stem-cell transplantation (ASCT).
PATIENTS AND METHODS
Study Design
The purpose of our study was to construct a prognostic index of early MM progression–related death among MM patients receiving front-line ASCT. This work was based on data derived from four recently conducted randomized phase III trials, which assessed the impact of novel agent-based front-line therapy and ASCT. This index was constructed from data of the IFM 2005-01 trial,5 ie, the learning sample. It was subsequently validated using the data of the three other trials (Gruppo Italiano Malattie Ematologiche dell' Adulto [GIMEMA] 26866138-MMY-3006,6 Programa para el Estudio de la Terapéutica en Hemopatía Maligna [PETHEMA]–GEMMENOS657 and HOVON-65/GMMG-HD48), ie, the validation sample.
Data Source
The full details of these four trials have been published previously. Their principal characteristics are summarized in the Appendix (online only), stressing differences that could influence the results of our study.
Statistical Methods
Inclusion and 3-year follow-up data from treatment initiation, including data on all causes of death, were collected from biostatistical centers in charge of each trial analysis. Cause of death was reclassified by one of the authors as a result of MM progression, to another cause (toxicity, infection without progressive disease, comorbidities), or to an unknown or disputed cause.
Score Construction
Logistic regression was used to construct the index.9 The event was MM progression–related death within 2 years from treatment initiation. Patients who were alive after a follow-up period of less than 2 years were excluded from the study. Patients who died within 2 years from treatment initiation as a result of a cause other than MM progression or from an unknown or disputed cause were considered as not having died from MM progression before two years, as is done when dealing with survival and competing events. Independent variables were the following: age, sex, isotype, hemoglobin, platelet, creatinine levels, β2-microglobulin and albumin levels, and lactate dehydrogenase (LDH) relative to normal levels, ISS, and adverse cytogenetics defined as t(4;14) or del(17p) by fluorescent in situ hybridization. Independent variables were first tested separately using a univariable logistic regression model. Each continuous variable was divided into 10 categories corresponding to approximately each decile. If the relative death rates (ratio of the observed number of deaths to the expected number of deaths in each category, assuming no variation of death rate across categories) in two or more adjacent categories were not substantially different, these categories were combined.10,11 If no clear pattern was observed, the median was used as the cutoff point. Usual limits were also tested. As a consequence, two to three categories were used for each continuous variable. After univariable analysis, all variables with a P value of less than .20 were entered into multivariable analyses in several steps; the first included all variables with no missing values and then successively added variables with an increasing number of missing values. At each step, the stability of the previously derived model was checked and no further analysis was performed in case of instability. When applied to the French IFM 2005-01 trial data, this method allowed us to construct the prognostic index, to select its components, to estimate their coefficients, to derive through a weighted approach of these coefficients a simple ordinal prognostic classification consisting of a few classes, and to define a very poor prognostic group with the worst outcome.
Score Validation
Using the data of the three other trials, we tested whether prognostic index components and prognostic classification could be applied in the same way across the trials, by using interaction terms in the multivariable logistic model.
The quality of the prognostic classification to define a very poor prognostic group was assessed through the evaluation of sensitivity, specificity, positive and negative likelihood ratios, all characteristics known to be independent of event prevalence, and positive and predictive values assuming a 10% prevalence of early MM progression–related death.12 These quantities were estimated with a 95% CI from the validation sample to obtain an unbiased estimate of the prognostic classification qualities, and from the learning sample, the French trial data, for illustration.
The cumulative incidence of death per cause and the influence of the prognostic classification on the cumulative incidence of MM progression–related death during the first 2 years was assessed through the proportional hazards model for subdistribution using competing risks, death as a result of MM progression, death as a result of other causes, or death as a result of unknown or disputed causes, in both the learning and validation samples.13
Finally, to illustrate the use of the prognostic classification in a population of newly diagnosed patients, the Kaplan-Meier method14 was used to estimate OS from treatment initiation in the four trials and the proportional hazards model15 was used to estimate hazard ratios associated with the prognostic classification.
In addition, we tested whether the proposed prognostic classification and definition of the very poor prognostic group could be applied to patients who had received bortezomib-containing induction therapy using the data of all four trials and an interaction term in the logistic regression. The same approach was used for OS within the 2 first years after treatment initiation, using an interaction term in the proportional hazards model. Because of the important role of interaction tests in our study, a rough power estimation for the detection of an interaction between the definition of the very poor prognostic group and bortezomib use in induction treatment is included in the Appendix.
All analyses were performed using the SPSS 19.1 statistical software package (SPSS, Chicago, IL), except proportional hazards model analyses for subdistributions using competing risks, which were performed using R programming language (R 2.15.0, Vienna, Austria).
RESULTS
The main characteristics of the 482 patients included in the IFM 2005-01 trial are listed in Table 1. Twenty patients were alive but lost to follow-up and 42 patients died from progressive disease within the first 2 years of treatment initiation.
Table 1.
Baseline Patient Demographic and Disease Characteristics
| Characteristic | IFM 2005-01 Learning Sample (n = 482) |
GIMEMA/PETHEMA/HOVON-GMMG Validation Sample (n = 1,687) |
P* | GIMEMA (n = 474) |
PETHEMA (n = 386) |
HOVON-GMMG (n = 827) |
P† | |||||
|---|---|---|---|---|---|---|---|---|---|---|---|---|
| No. of Patients | % | No. of Patients | % | No. of Patients | % | No. of Patients | % | No. of Patients | % | |||
| Male patients | 266 of 482 | 55.2 | 980 of 1,687 | 58.1 | .26 | 273 of 474 | 57.6 | 207 of 386 | 53.6 | 500 of 827 | 60.4 | .078 |
| Age, years | .23 | .80 | ||||||||||
| Median | 57.1 | 57.5 | 57.6 | 57.4 | 57.5 | |||||||
| IQR | 51.0-61.4 | 51.5-61.7 | 51.7-61.8 | 51.5-61.7 | 51.4-61.5 | |||||||
| ISS stage | .11 | .0017 | ||||||||||
| I | 199 of 472 | 42.2 | 634 of 1,602 | 39.6 | 209 of 474 | 44.1 | 142 of 381 | 37.3 | 283 of 747 | 37.9 | ||
| II | 163 of 472 | 34.5 | 638 of 1,602 | 39.8 | 90 of 474 | 40.1 | 167 of 381 | 43.8 | 281 of 747 | 37.6 | ||
| III | 110 of 472 | 23.3 | 330 of 1,602 | 20.6 | 75 of 474 | 15.8 | 72 of 381 | 18.9 | 183 of 747 | 24.5 | ||
| β2-microglobulin, mg/L | .010 | .027 | ||||||||||
| Median | 3.5 | 3.3 | 3.1 | 3.3 | 3.4 | |||||||
| IQR | 2.4-5.3 | 2.3-5.1 | 2.3-4.6 | 2.3-5.1 | 2.3-5.4 | |||||||
| t(4;14) | 30 of 465 | 6.5 | 195 of 1,339 | 14.6 | < .001 | 87 of 441 | 19.7 | 38 of 386 | 9.8 | 70 of 512 | 13.7 | < .001 |
| del(17p) | 46 of 465 | 9.9 | 119 of 1,429 | 8.3 | .30 | 33 of 441 | 7.5 | 21 of 386 | 5.4 | 65 of 602 | 10.8 | .0089 |
| t(4;14) or del(17p) | 69 of 465 | 14.8 | 289 of 1,294 | 22.3 | < .001 | 110 of 441 | 24.9 | 55 of 386 | 14.2 | 124 of 467 | 26.6 | < .001 |
| Hemoglobin, g/dL | .023 | .047 | ||||||||||
| Median | 10.8 | 10.8 | 11.2 | 10.8 | 10.8 | |||||||
| IQR | 9.4-12.3 | 9.5-12.5 | 9.8-12.6 | 9.6-12.5 | 9.3-12.4 | |||||||
| Creatinine, mg/L | .050 | .030 | ||||||||||
| Median | 0.98 | 0.96 | 0.98 | 0.94 | 0.98 | |||||||
| IQR | 0.81-1.21 | 0.80-1.20 | 0.80-1.11 | 0.80-1.11 | 0.80-1.27 | |||||||
| Albumin, g/dL | .082 | < .001 | ||||||||||
| Median | 4.0 | 3.8 | 3.9 | 3.7 | 3.7 | |||||||
| IQR | 3.5-4.4 | 3.3-4.2 | 3.4-4.3 | 3.1-4.1 | 3.3-4.2 | |||||||
| LDH > normal value | 83 of 430 | 19.3 | 243 of 1,610 | 15.1 | .034 | 43 of 429 | 10.0 | 58 of 386 | 15.0 | 142 of 795 | 17.9 | .0013 |
Abbreviations: GIMEMA, Gruppo Italiano Malattie Ematologiche dell' Adulto; GMMG, German-Speaking Myeloma Multicenter Group; HOVON, Hemato-Oncologie voor Volwassenen Nederland; IFM, Intergroupe Francophone du Myélome; IQR, interquartile range; ISS, International Staging System; LDH, lactate dehydrogenase; PETHEMA, Programa para el Estudio de la Terapéutica en Hemopatía Maligna.
Comparison between learning and validation samples using Mann-Whitney and χ2 tests.
Comparison across trials of the validation sample using Kruskal-Wallis and χ2 tests.
Score Construction
Analysis of the association of the various factors evaluated at inclusion with early MM progression–related death as explored using the univariable linear logistic regression method is listed in Appendix Table A1. The multivariable regression logistic analysis showed that the risk of early MM progression–related death was related to three independent prognostic variables: LDH higher than normal (P = .012), ISS3 (P = .020), and t(4;14) and/or del(17p) (P = .0004). Coefficients of these variables in the multiple linear logistic model are listed in Appendix Table A2.
According to their relative weight in the model (Appendix), these three variables enabled the definition of a prognostic classification consisting of four prognostic categories for 387 patients with a score available (Table 2). Twenty patients with a score of 3 made up the very poor prognostic group, with a 50% rate of early MM progression–related death within the first 2 years, and these patients represented 5.2% (95% CI, 3.0 to 7.4) of the whole population enrolled onto the trial.
Table 2.
Prognostic Classification Consisting of Four Categories Based on Three Variables: High LDH, ISS3, and Presence of t(4;14) and/or del(17p)
| Score | IFM 2005-01 |
GIMEMA/PETHEMA/HOVON-GMMG |
GIMEMA |
PETHEMA |
HOVON-GMMG |
||||||||||||||||||||
|---|---|---|---|---|---|---|---|---|---|---|---|---|---|---|---|---|---|---|---|---|---|---|---|---|---|
| No. of Events* or Patients† | % | Percent of Patients | Odds Ratio Estimate | 95% CI | No. of Events* or Patients‡ | % | Percent of Patients | Odds Ratio Estimate | 95% CI | No. of Events* or Patients§ | % | Percent of Patients | Odds Ratio Estimate | 95% CI | No. of Events* or Patients¶ | % | Percent of Patients | Odds Ratio Estimate | 95% CI | No. of Events* or Patients‖ | % | Percent of Patients | Odds Ratio Estimate | 95% CI | |
| 0 | 9 of 225 | 4.0 | 58 | 1 | 24 of 633 | 4 | 56 | 1 | 6 of 225 | 3 | 58 | 1 | 8 of 221 | 4 | 63 | 1 | 10 of 187 | 5 | 47 | 1 | |||||
| 1 | 13 of 121 | 11 | 31 | 2.9 | 1.2 to 7.0 | 29 of 368 | 8 | 32 | 2.2 | 1.2 to 3.8 | 7 of 132 | 5 | 34 | 2.0 | 0.7 to 6.2 | 12 of 98 | 12 | 28 | 3.7 | 1.5 to 9.4 | 10 of 138 | 7 | 34 | 1.4 | 0.6 to 3.4 |
| 2 | 4 of 21 | 19 | 5 | 5.7 | 1.6 to 20.3 | 9 of 44 | 20 | 4 | 6.5 | 2.8 to 15.1 | 1 of 8 | 12 | 2 | 5.2 | 0.6 to 49.3 | 4 of 16 | 25 | 5 | 8.9 | 2.3 to 33.7 | 4 of 20 | 20 | 5 | 4.4 | 1.3 to 15.7 |
| 3 | 10 of 20 | 50 | 5 | 24.0 | 8.0 to 72.2 | 23 of 94 | 25 | 8 | 8.2 | 4.4 to 15.3 | 4 of 25 | 16 | 6 | 7.0 | 1.8 to 26.6 | 7 of 18 | 39 | 5 | 18.7 | 5.7 to 61.0 | 12 of 51 | 24 | 13 | 5.5 | 2.2 to 13.5 |
NOTE. Score definition: 0, absence of adverse factor; 1, only one adverse factor; 2, presence of high LDH and ISS3 in the absence of t(4;14) and del(17p); 3, t(4;14) and/or 17p in addition to ISS3 and/or high LDH.
Abbreviations: GIMEMA, Gruppo Italiano Malattie Ematologiche dell' Adulto; GMMG, German-Speaking Myeloma Multicenter Group; HOVON, Hemato-Oncologie voor Volwassenen Nederland; IFM, Intergroupe Francophone du Myélome; ISS, International Staging System; LDH, lactate dehydrogenase; MM, multiple myeloma; PETHEMA, Programa para el Estudio de la Terapéutica en Hemopatía Maligna.
Event is an MM progression–related death within 2 years from treatment initiation.
A score was available for 387 patients; they were alive and not lost to follow-up at 2 years.
A score was available for 1,139 patients; they were alive and not lost to follow up at 2 years.
A score was available for 390 patients; they were alive and not lost to follow-up at 2 years.
A score was available for 353 patients; they were alive and not lost to follow-up at 2 years.
A score was available for 396 patients; they were alive and not lost to follow-up at 2 years.
Score Validation
The derived prognostic variables, the prognostic classification, and the definition of the very poor prognostic group, as derived from the French trial data, were subsequently evaluated using data of patients enrolled onto three other recent randomized phase III trials (validation sample). Overall, 1,687 patients were enrolled onto these three trials and the patients' main characteristics are described globally and per trial in Table 1. Seventy patients were alive but lost to follow-up and 118 patients died as a result of disease progression within the first 2 years after treatment initiation.
The association of the risk of early MM progression–related death with the three prognostic variables, as obtained through the multiple logistic regression method using the data of the validation sample, are listed in Appendix Table A2, globally and per trial. The coefficients applied to each of the three prognostic variables when derived from the validation sample seemed similar when compared with those obtained with the French trial data, despite variations across individual trials within the validation sample.
The prognostic classification, as well as the definition of the very poor prognostic group, seemed to be efficient when applied globally to the validation set, as well as when applied to each trial individually, without evidence of variation across trials (interaction test: prognostic classification, P = .79; definition of the very poor prognostic group, P = .56; Table 2). Overall, 94 (8.3%) of 1,139 patients with a score available presented with a score of 3 (95% CI, 6.7 to 9.9) and, in this very poor prognostic group, the rate of early MM progression–related death within 2 years was 24.5%, approximately half the rate observed in the French trial.
How well the definition of the very poor prognostic group (score, 3) was able to detect patients at high risk of early death, evaluated using sensitivity, specificity, and negative and positive likelihood ratios in the validation sample and in the learning sample, are listed in Table 3. Assuming a 10% prevalence of early death within 2 years from MM progression, the negative predictive estimate was 92.0% (95% CI, 89.8 to 94.2) and the positive predictive estimate was 30.9% (95% CI, 18.6 to 43.1) in the validation sample. The positive predictive value estimate from the French trial data was 52.0% (95% CI, 17.6 to 86.4), reflecting an overestimation that was expected, but nevertheless with a similar lower limit of the 95% CI.
Table 3.
Ability of the Prognostic Classification to Detect Patients at Very High Risk of Early MM Progression–Related Death
| Classification | GIMEMA/PETHEMA/HOVON-GMMG | IFM 2005-01 |
|---|---|---|
| Sensitivity, % | ||
| No. of patients | 85 | 36 |
| Estimate | 27.1 | 27.8 |
| 95% CI | 17.6 to 36.5 | 13.1 to 42.4 |
| Specificity, % | ||
| No. of patients | 1,054 | 361 |
| Estimate | 93.3 | 97.2 |
| 95% CI | 91.8 to 94.8 | 95.4 to 98.9 |
| Positive likelihood ratio | ||
| Estimate | 4.02 | 9.75 |
| 95% CI | 2.35 to 5.68 | 1.89 to 17.61 |
| Negative likelihood ratio | ||
| Estimate | 0.78 | 0.74 |
| 95% CI | 0.68 to 0.89 | 0.59 to 0.90 |
Abbreviations: GIMEMA, Gruppo Italiano Malattie Ematologiche dell' Adulto; GMMG, German-Speaking Myeloma Multicenter Group; HOVON, Hemato-Oncologie voor Volwassenen Nederland; IFM, Intergroupe Francophone du Myélome; MM, multiple myeloma; PETHEMA, Programa para el Estudio de la Terapéutica en Hemopatía Maligna.
Taking into account competition between the different causes of death (MM progression, other causes [toxicity, infection without progressive disease, comorbidities), and unknown or disputed causes), the cumulative incidence of deaths per cause are described in the learning and validation samples (Appendix Fig A1). The cumulative incidence of MM progression–related death at 2 years was 8.8% (95% CI, 6.5 to 11.5) using the French trial data and 7.2% (95% CI, 6.0 to 8.5) using the validation sample data. Figure 1 illustrates this cumulative incidence rate according to the prognostic classification, as evaluated using the French trial data (Fig 1A) and the validation sample (Fig 1B), respectively. These results confirm the raw estimates of the early death rates from MM progression.
Fig 1.

Cumulative incidence of early multiple myeloma progression–related death according to the prognostic classification. (A) Intergroupe Francophone du Myélome (IFM) 2005-01 trial, learning sample; (B) validation trials (Gruppo Italiano Malattie Ematologiche dell' Adulto [GIMEMA], Programa para el Estudio de la Terapéutica en Hemopatía Maligna [PETHEMA], and Hemato-Oncologie voor Volwassenen Nederland/German-Speaking Myeloma Multicenter Group [HOVON/GMMG]).
The overall survival during the first 2 years according to the prognostic classification for all patients with a score available at diagnosis (n = 1,601), pooling learning and validation samples, is shown in Figure 2. The 2-year OS estimate was 54.6% (SE, 4.7) in the group of 115 patients with a score of 3.
Fig 2.

Overall survival for 1,601 patients with lactate dehydrogenase, International Staging System, and cytogenetic data available.
Concerning the use of our prognostic classification and the definition of a very poor prognostic group in patients who received bortezomib during induction, and in those who did not receive bortezomib, no interaction could be demonstrated in the logistic regression model (P = .94 and P = .42, respectively), as well as in the survival model within the first 2 years of treatment (P = .44 and P = .58, respectively), indicating that the prognostic classification and the definition of the very poor prognostic group could be applied in the same way to patients who had received bortezomib during their induction treatment and to those who had not. When applied to the population of 855 patients who had received bortezomib-based induction therapy in the four trials, the prognostic classification was again able to segregate patients into four categories, with the poorest outcome (2-year OS, 51.9%; SE, 6.9) attributed to patients with a score of 3 (Fig 3). As described in the Appendix, the power to detect an interaction between the definition of the very poor prognostic group and the use of bortezomib in the induction treatment was satisfactory.
Fig 3.

Overall survival for patients treated in the bortezomib-based arms of the four phase III randomized trials.
Response to induction therapy before ASCT was not treated as a variable to construct the index. Nevertheless, we evaluated this data, especially in the group of 42 and 118 patients who had died from progressive disease within the first two years of treatment initiation in the learning and validation samples, respectively. Overall, 25% and 53% of these patients reached at least very good partial response and partial response after induction and before ASCT, respectively, and 22% experienced disease progression despite induction (Appendix Table A3).
DISCUSSION
Since the mid-1990s, HDT with ASCT is considered the standard front-line treatment for younger patients with MM.16,17 The recent introduction of the novel agents, thalidomide, bortezomib, and lenalidomide, has changed the transplantation scenario in several ways. Indeed, these agents have been incorporated into the pretransplantation setting as part of induction regimens (with the objective of increasing the response rate before ASCT), as well as following the transplantation procedure as consolidation treatment (with the objective of increasing the depth of the response), or as maintenance (with the objective of prolonging the duration of response).18,19 Substantial improvements in the results after induction based on combining novel agents plus HDT with ASCT followed by systematic consolidation and maintenance are even leading some authors to consider that MM has become a potentially curable disease.20,21
Nevertheless, despite this optimal strategy, a small group of patients never reach prolonged PFS and typically struggle with resistant disease early on. This group of patients with high-risk disease may be identified using gene-expression profiling, a technique that is currently not routinely available in the majority of centers, or by a combination of other initial parameters, including ISS, cytogenetics, LDH, plasma-cell labeling index, or circulating plasma cells. Patients with poor-risk features may represent 20% of symptomatic cases at diagnosis but, up to now, no simple consensus definition has been proposed to characterize these patients.22
The goal of our study was to identify the subgroup of patients at high risk of early MM progression–related death within the first 2 years after diagnosis, using simple and widely available markers evaluated at the time of diagnosis. Our aim was not to propose a global classification of standard, intermediate, or high-risk disease. Using the data of a large prospective phase III trial, which was designed to compare induction therapy with VAD or bortezomib-dexamethasone before ASCT, we demonstrated that the combination of three simple parameters—ISS3, LDH, and adverse cytogenetics defined by fluorescent in situ hybridization—could easily select a small subgroup comprising approximately 5% of patients who die early as a result of disease progression. We subsequently validated this model on a larger data set derived from three recent phase III prospective trials that studied the impact of novel agent-based combinations in the setting of ASCT. Using this validation set, we confirmed that our model was accurate and that the percentage of patients at high risk of early MM progression–related death was roughly 8%. Indeed, the proportion of patients presenting with these high-risk features was similar across trials. These patients are likely to represent a subgroup of the so-called high-risk cases defined by several parameters, as mentioned earlier in Discussion. Of note, our prognostic classification is reliable despite differences observed in initial patient characteristics, especially those associated with a prognostic impact. Moreover, this model is simple and is based on easily available biologic tests that can be conducted in a multicenter setting. Of note, this index is not a surrogate marker of disease resistance to induction because less than one fourth of the patients who died owing to progressive disease within the first 2 years of treatment initiation were refractory to induction before ASCT, and more than 50% of them were able to achieve at least partial response after induction.
Importantly, our score was also useful and effective when applied to the population of patients in all four phase III trials randomly assigned to receive bortezomib-based induction, which is considered to be the most effective treatment at the current time. Indeed, despite differences in the design of these four trials incorporating either single or tandem ASCT, systematic consolidation or maintenance phases or not, a recent integrated analysis of data from these phase III studies showed that bortezomib-based induction resulted in significant improvements in PFS and OS versus nonbortezomib-based induction.23 Similarly, in a recent retrospective analysis, Bergsagel et al22 also highlighted that bortezomib was the drug of choice in the treatment of high-risk MM.
In conclusion, our model allows identification of a subgroup of patients presenting with severe disease, despite the use of the latest and most effective strategies. This group of patients with a score of 3, comprising 5% to 8% of de novo MM, could benefit from specifically designed trials, including experimental approaches, that aim to overcome disease resistance.
Appendix
Data source.
In the IFM 2005-01 trial,5 482 patients ages ≤ 65 years were randomly assigned using a 1:1:1:1 ratio to receive vincristine, doxorubicin, and dexamethasone (VAD) induction with or without intensification with dexamethasone, cyclophosphamide, etoposide, and cisplatin (DCEP) or bortezomib-dexamethasone induction with or without DCEP. Patients received autologous stem-cell transplantation (ASCT) and could then receive a second ASCT or reduced-intensity conditioning (RIC) allogeneic SCT (RIC alloSCT). Patients achieving at least a partial response after transplantation were intended to receive 2 months' consolidation with lenalidomide, followed by lenalidomide maintenance or placebo on a separate trial protocol (IFM 2005-02; Attal M, et al:\ N Engl J Med 366:1782-1791, 2012).
The GIMEMA 26866138-MMY-3006 trial randomy assigned in a 1:1 ratio 480 patients ages 18 to 65 years to induction therapy with bortezomib, thalidomide, and dexamethasone (VTD) or thalidomide and dexamethasone (TD).6 Patients were scheduled to receive double ASCT, followed by two cycles of consolidation therapy with VTD or TD, according to induction therapy received. Patients then received dexamethasone maintenance therapy until relapse or disease progression.
In the PETHEMA GEM05MENOS65 trial, 390 patients ages ≤ 65 years were randomly assigned in a 1:1:1 ratio to receive induction with VTD, TD, or VBMCP (vincristine, carmustine, melphalan, cyclophosphamide, and prednisone)/VBAD (vincristine, carmustine, doxorubicin, and dexamethasone) followed by bortezomib (two cycles).7 Patients then received a single ASCT and, 3 months after transplantation, were again randomly assigned at a 1:1:1 ratio to receive maintenance therapy with interferon alfa-2b, thalidomide, or bortezomib-thalidomide for up to 3 years.
In the HOVON-65/GMMG-HD4 trial, 827 patients ages 18 to 65 years were randomly assigned at a 1:1 ratio to receive induction therapy with VAD or bortezomib, doxorubicin, and dexamethasone (PAD).8 Patients then received single (HOVON) or double (GMMG) ASCT, according to each group's standard practice, followed by 2 years' maintenance therapy with thalidomide (VAD arm) or bortezomib (PAD arm); those patients with a human leukocyte antigen–identical siblings could instead receive RIC alloSCT.
Score construction.
We used a weighted approach with an index equal to 2 × (International Staging System 3 + lactate dehydrogenase [LDH] > normal) + 3 × [del17p or t(4;14)], reflecting the coefficients in the logistic regression model 0.92, 1.02, and 1.51 for International Staging System 3, LDH, higher than normal and [del17p or t(4;14)], respectively.
This approach lead to a six-class scoring system but, in the logistic regression model, the coefficients of class 2 and 3 were 1.07 and 1.02, respectively, and those of class 5 and 6 were 3.32 and 2.89, respectively, leading to the four-class scoring system, as described in the article.
Power calculations.
First, because our main objective was to derive a very poor risk group (early multiple myeloma–progression–related death), we have concentrated the study of power on the identification of this very poor prognosis group, defined in our study by a score of 3. Following the work by Hsieh et al (Hsieh FY, et al:\ Statist Med 17:1623-1634, 1998), we first calculated the power to detect a difference in death rate, Δp, according to prognosis group (very poor v not very poor), when the overall death rate is P and the proportion of very poor risk prognosis patients is B, as proposed by Hsieh et al. In agreement with our observed data in the different samples, the following parameters were chosen:
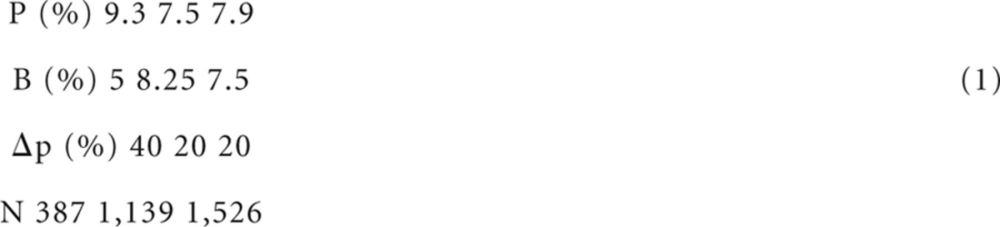 |
As expected, the power was high, over 99%. An interaction test consisted of the comparison with Δp1 in one group (the patients treated with bortezomib-containing induction), with Δp2 in the other group (the patients who received induction therapy not including bortezomib). First, this comparison included four groups instead of two in the power approach described in this Appendix and the corresponding group sample sizes are divided by two, taking into account that nearly as many patients received induction treatment with bortezomib and without bortezomib, leading to a variance multiplied by four. Thus, we used the same approach as discussed, but adding this correction factor for the variance and modifying the difference to be detected, a difference between two differences around the overall observed difference shown above. The following results were obtained:
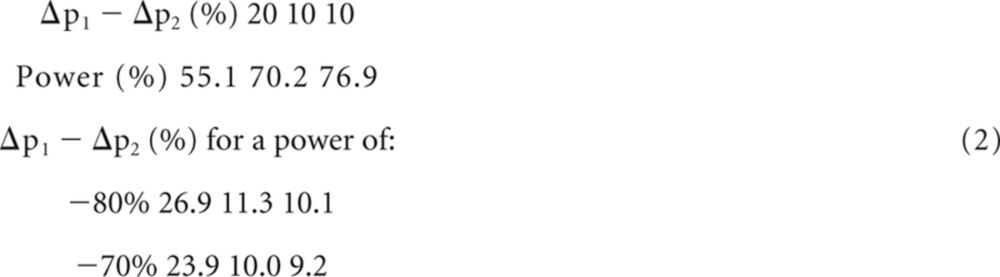 |
The calculated power values seemed to be rather satisfactory.
Table A1.
Prognostic Factors of Early MM Progression–Related Death (univariable analysis; IFM 2005-01)
| Variable and Category | No. of Events* or Patients | % | Odds Ratio Estimate | 95% CI | P |
|---|---|---|---|---|---|
| Sex | .20 | ||||
| Female | 15 of 208 | 7.2 | 1 | ||
| Male | 27 of 254 | 10.6 | 1.5 | 0.8 to 3.0 | |
| ISS | < .001 | ||||
| 1 | 5 of 196 | 2.6 | 1 | ||
| 2 | 19 of 151 | 12.6 | 5.5 | 2.0 to 15.1 | |
| 3 | 17 of 105 | 16.2 | 7.4 | 2.6 to 20.5 | |
| del(17p) | .013 | ||||
| No | 31 of 401 | 7.7 | 1 | ||
| Yes | 9 of 44 | 20.5 | 3.1 | 1.4 to 7.0 | |
| t(4;14) | .009 | ||||
| No | 33 of 417 | 7.9 | 1 | ||
| Yes | 7 of 28 | 25.0 | 3.9 | 1.5 to 9.8 | |
| del(17p) or t(4;14) | < .001 | ||||
| No | 25 of 380 | 6.6 | 1 | ||
| Yes | 15 of 65 | 23.1 | 4.3 | 2.1 to 8.6 | |
| LDH > normal | < .001 | ||||
| No | 22 of 332 | 6.6 | 1 | ||
| Yes | 17 of 80 | 21.3 | 3.8 | 1.9 to 7.6 |
Abbreviations: IFM, Intergroupe Francophone du Myélome; ISS, International Staging System; LDH, lactate dehydrogenase; MM, multiple myeloma.
An event is an MM progression–related death within 2 years from treatment initiation.
Table A2.
Association of the Risk of Early MM Progression–Related Death With the Three Prognostic Variables
| Variable | IFM 2005-01 (n = 387) | GIMEMA/PETHEMA/HOVON-GMMG (n = 1,139) | GIMEMA (n = 390) | PETHEMA (n = 353) | HOVON-GMMG (n = 396) |
|---|---|---|---|---|---|
| ISS3 | |||||
| Coefficient | 0.9214 | 0.9850 | 0.8865 | 1.2765 | 0.8185 |
| SE | 0.3862 | 0.2408 | 0.5366 | 0.4144 | 0.3653 |
| P | .020 | < .001 | .120 | .003 | .028 |
| LDH > normal | |||||
| Coefficient | 1.0173 | 0.8173 | 0.0017 | 0.9277 | 0.8492 |
| SE | 0.3929 | 0.2666 | 1.3441 | 0.4503 | 0.3940 |
| P | .012 | .003 | .99 | .048 | .033 |
| del(17p) or t(4;14) | |||||
| Coefficient | 1.5132 | 1.0522 | 1.3441 | 1.5279 | 0.7483 |
| SE | 0.4073 | 0.2363 | 0.4924 | 0.4260 | 0.3650 |
| P | < .001 | < .001 | .007 | < .001 | .044 |
Abbreviations: GIMEMA, Gruppo Italiano Malattie Ematologiche dell' Adulto; GMMG, German-Speaking Myeloma Multicenter Group; HOVON, Hemato-Oncologie voor Volwassenen Nederland; IFM, Intergroupe Francophone du Myélome; ISS3, International Staging System 3; LDH, lactate dehydrogenase; MM, multiple myeloma; PETHEMA, Programa para el Estudio de la Terapéutica en Hemopatía Maligna.
Table A3.
Response to Induction Therapy Among Patients Who Died As a Result of MM Progression Within the First 2 Years of Treatment Initiation
| Response | Learning Sample (n = 42) | Validation Sample (n = 118) | Total (N = 160) |
|---|---|---|---|
| At least VGPR, % | 14 | 29 | 25 |
| At least PR, % | 44 | 55 | 53 |
| MR or SD, % | 56 | 15 | 25 |
| PD, % | 0 | 29 | 22 |
| No. of patients with missing data | 6 | 6 | 12 |
Abbreviations: MM, multiple myeloma; MR, minimal response; PD, progressive disease; PR, partial response; SD, stable disease; VGPR, very good partial response.
Fig A1.

(A) Original trial. (B) Validation trial. Mo, months.
Footnotes
See accompanying article on page 2125; listen to the podcast by Dr Gertz at www.jco.org/podcasts
Authors' disclosures of potential conflicts of interest and author contributions are found at the end of this article.
AUTHORS' DISCLOSURES OF POTENTIAL CONFLICTS OF INTEREST
Although all authors completed the disclosure declaration, the following author(s) and/or an author's immediate family member(s) indicated a financial or other interest that is relevant to the subject matter under consideration in this article. Certain relationships marked with a “U” are those for which no compensation was received; those relationships marked with a “C” were compensated. For a detailed description of the disclosure categories, or for more information about ASCO's conflict of interest policy, please refer to the Author Disclosure Declaration and the Disclosures of Potential Conflicts of Interest section in Information for Contributors.
Employment or Leadership Position: None Consultant or Advisory Role: Michele Cavo, Janssen-Cilag (C), Celgene (C), Bristol-Myers Squibb (C), Millennium Pharmaceuticals (C); Pieter Sonneveld, Janssen-Cilag (C), Celgene (C), Onyx Pharmaceuticals (C), Millennium Takeda (C); Hartmut Goldschmidt, Janssen-Cilag (C), Celgene (C), Novartis (C), Onyx Pharmaceuticals (C), Millennium Pharmaceuticals (C); Antonio Palumbo, Celgene (C), Janssen-Cilag (C), Amgen (C), Bristol-Myers Squibb (C), Millennium Pharmaceuticals (C), Onyx Pharmaceuticals (C); Maria Teresa Petrucci, Bristol-Myers Squibb (C); Jesus san Miguel, Millennium Pharmaceuticals (C), Celgene (C), Novartis (C), Onyx Pharmaceuticals (C), Janssen-Cilag (C), Bristol-Myers Squibb (C), Merck (C) Stock Ownership: None Honoraria: Michele Cavo, Janssen-Cilag, Celgene, Millennium Pharmaceuticals, Bristol-Myers Squibb; Hartmut Goldschmidt, Janssen-Cilag, Celgene, Novartis, Chugai Pharmaceutical, Onyx Pharmaceuticals, Millennium Pharmaceuticals; Juan Jose Lahuerta, Janssen-Cilag, Celgene; Antonio Palumbo, Amgen, Bristol-Myers Squibb, Celgene, Janssen-Cilag, Millennium Pharmaceuticals, Onyx Pharmaceuticals; Maria Teresa Petrucci, Janssen-Cilag, Celgene Research Funding: Pieter Sonneveld, Janssen-Cilag, Celgene, Onyx Pharmaceuticals, Millennium Takeda; Hartmut Goldschmidt, Janssen-Cilag, Celgene, Novartis, Chugai Pharmaceutical Expert Testimony: None Patents, Royalties, and Licenses: None Other Remuneration: Gerald Marit, Janssen-Cilag, Celgene
AUTHOR CONTRIBUTIONS
Conception and design: Philippe Moreau, Michele Cavo, Pieter Sonneveld, Laura Rosinol, Michel Attal, Hartmut Goldschmidt, Gerald Marit, Joan Bladé, Maria Teresa Petrucci, Kai Neben, Jesus san Miguel, Elena Zamagni, Cyrille Hulin, Thierry Facon, Denis Caillot, Lotfi Benboubker, Jean-Luc Harousseau, Xavier Leleu, Hervé Avet-Loiseau, Jean-Yves Mary
Provision of study materials or patients: Philippe Moreau, Laura Rosinol, Michel Attal, Gerald Marit, Joan Bladé, Maria Teresa Petrucci, Francesca Patriarca, Henk Lokhorst, Cyrille Hulin, Norma Gutierrez, Lotfi Benboubker, Xavier Leleu
Collection and assembly of data: Philippe Moreau, Michele Cavo, Pieter Sonneveld, Annalisa Pezzi, Juan Jose Lahuerta, Antonio Palumbo, Bronno van der Holt, Francesca Patriarca, Henk Lokhorst, Elena Zamagni, Norma Gutierrez, Jean-Yves Mary
Data analysis and interpretation: Philippe Moreau, Michele Cavo, Pieter Sonneveld, Laura Rosinol, Michel Attal, Jean-Yves Mary
Manuscript writing: All authors
Final approval of manuscript: All authors
REFERENCES
- 1.Greipp PR, San Miguel J, Durie BG, et al. International staging system for multiple myeloma. J Clin Oncol. 2010;23:3412–3420. doi: 10.1200/JCO.2005.04.242. [DOI] [PubMed] [Google Scholar]
- 2.Gertz MA, Lacy MQ, Dispenzieri A, et al. Clinical implications of t(11;14)(q13;q32), t(4;14) (p16.3;q32), and -17p13 in myeloma patients treated with high-dose therapy. Blood. 2005;106:2837–2840. doi: 10.1182/blood-2005-04-1411. [DOI] [PMC free article] [PubMed] [Google Scholar]
- 3.Avet-Loiseau H, Attal M, Moreau P, et al. Genetic abnormalities and survival in multiple myeloma: The experience of the Intergroupe Francophone du Myélome. Blood. 2007;109:3489–3495. doi: 10.1182/blood-2006-08-040410. [DOI] [PubMed] [Google Scholar]
- 4.Avet-Loiseau H, Durie BG, Cavo M, et al. Combining fluorescent in situ hybridization data with ISS staging improves risk assessment in myeloma. An International Myeloma Working Group collaborative project. Leukemia. 2013;27:711–717. doi: 10.1038/leu.2012.282. [DOI] [PMC free article] [PubMed] [Google Scholar]
- 5.Harousseau JL, Attal M, Avet-Loiseau H, et al. Bortezomib plus dexamethasone is superior to vincristine plus doxorubicin plus dexamethasone as induction treatment prior to autologous stem-cell transplantation in newly diagnosed multiple myeloma: Results of the IFM 2005-01 phase III trial. J Clin Oncol. 2010;28:4621–4629. doi: 10.1200/JCO.2009.27.9158. [DOI] [PubMed] [Google Scholar]
- 6.Cavo M, Tacchetti P, Patriarca F, et al. Bortezomib with thalidomide plus dexamethasone compared with thalidomide plus dexamethasone as induction therapy before, and consolidation therapy after, double autologous stem-cell transplantation in newly diagnosed multiple myeloma: A randomised phase 3 study. Lancet. 2010;376:2075–2085. doi: 10.1016/S0140-6736(10)61424-9. [DOI] [PubMed] [Google Scholar]
- 7.Rosiñol L, Oriol A, Teruel AI, et al. Superiority of bortezomib, thalidomide, and dexamethasone (VTD) as induction pretransplantation therapy in multiple myeloma: A randomized phase 3 PETHEMA/GEM study. Blood. 2012;120:1589–1596. doi: 10.1182/blood-2012-02-408922. [DOI] [PubMed] [Google Scholar]
- 8.Sonneveld P, Schmidt-Wolf IG, van der Holt B, et al. Bortezomib induction and maintenance treatment in patients with newly diagnosed multiple myeloma: Results of the randomized phase III HOVON-65/GMMG-HD4 trial. J Clin Oncol. 2012;30:2946–2955. doi: 10.1200/JCO.2011.39.6820. [DOI] [PubMed] [Google Scholar]
- 9.Collett D. Modelling Binary Data (ed 2) Boca Raton, FL: Chapman and Hall/CRC; 2003. [Google Scholar]
- 10.Peto R, Pike MC, Armitage P, et al. Design and analysis of randomized clinical trials requiring prolonged observation of each patient: II. Analysis and examples. Br J Cancer. 1977;35:1–39. doi: 10.1038/bjc.1977.1. [DOI] [PMC free article] [PubMed] [Google Scholar]
- 11.Byar DP. Identification of prognostic factors. In: Buyse ME, Staquet MJ, Sylvester RJ, editors. Cancer Clinical Trials, Methods and Practice. Oxford, United Kingdom: Oxford Medical Publications; 1988. pp. 423–443. [Google Scholar]
- 12.Roberts RS. Likelihood ratio with diagnostic tests. In: Armitage P, Colton T, editors. Encyclopedia of Biostatistics (vol 3) Chichester, United Kingdom: John Wiley and Sons; 1998. pp. 2248–2253. [Google Scholar]
- 13.Fine JP, Gray RJ. A proportional hazards model for sub-distribution of a competing risk. J Am Stat Ass. 1999;94:496–509. [Google Scholar]
- 14.Kaplan EL, Meier P. Nonparametric estimation for incomplete observations. J Am Stat Ass. 1958;53:457–481. [Google Scholar]
- 15.Cox DR. Regression models and life-tables (with discussions), series B. J Roy Statist Soc. 1972;34:184–192. [Google Scholar]
- 16.Moreau P, Avet-Loiseau H, Harousseau JL, et al. Current trends in autologous stem-cell transplantation for myeloma in the era of novel therapies. J Clin Oncol. 2011;29:1898–1906. doi: 10.1200/JCO.2010.32.5878. [DOI] [PubMed] [Google Scholar]
- 17.Cavo M, Rajkumar SV, Palumbo A, et al. International Myeloma Working Group consensus approach to the treatment of multiple myeloma patients who are candidates for autologous stem cell transplantation. Blood. 2011;117:6063–6073. doi: 10.1182/blood-2011-02-297325. [DOI] [PMC free article] [PubMed] [Google Scholar]
- 18.Moreau P, Giralt SA. Optimizing therapy for transplant-eligible patients with newly diagnosed multiple myeloma. Leuk Res. 2012;36(suppl 1):S13–S18. doi: 10.1016/S0145-2126(12)70004-8. [DOI] [PubMed] [Google Scholar]
- 19.Reece D. Update on the initial therapy of multiple myeloma. Am Soc Clin Oncol Educ Book. 2013;2013:307–312. doi: 10.14694/EdBook_AM.2013.33.e307. [DOI] [PubMed] [Google Scholar]
- 20.San-Miguel JF, Mateos MV. Can multiple myeloma become a curable disease? Haematologica. 2011;96:1246–1248. doi: 10.3324/haematol.2011.051169. [DOI] [PMC free article] [PubMed] [Google Scholar]
- 21.Usmani SZ, Crowley J, Hoering A, et al. Improvement in long-term outcomes with successive Total Therapy trials for multiple myeloma: Are patients now being cured? Leukemia. 2013;27:226–232. doi: 10.1038/leu.2012.160. [DOI] [PMC free article] [PubMed] [Google Scholar]
- 22.Bergsagel PL, Mateos MV, Gutierrez NC, et al. Improving overall survival and overcoming adverse prognosis in the treatment of cytogenetically high-risk multiple myeloma. Blood. 2013;121:884–892. doi: 10.1182/blood-2012-05-432203. [DOI] [PMC free article] [PubMed] [Google Scholar]
- 23.Sonneveld P, Goldschmidt H, Rosiñol L, et al. Bortezomib-based versus non-bortezomib-based induction treatment before autologous stem-cell transplantation in patients with previously untreated multiple myeloma: A meta-analysis of phase III randomized, controlled trials. J Clin Oncol. 2013;31:3279–3287. doi: 10.1200/JCO.2012.48.4626. [DOI] [PubMed] [Google Scholar]