

Abstract
Background
The gaze stability test (GST) quantifies the ability of a person to recognize a target projected on a personal computer monitor during active head movement.
Purpose
The purpose of this study was to determine if there was a relationship between clinical measures of walking performance and the GST in patients with vestibular disorders and in healthy subjects. We hypothesized that impairment of the ability to keep objects in focus during active head movement would be correlated with walking performance.
Subjects
Twenty older asymptomatic adults acted as controls and 12 patients with either unilateral or bilateral vestibular disease participated.
Methods
The GST quantifies the maximum velocity that a person can move their head in the pitch and yaw planes while retaining the ability to read an optotype that is momentarily projected onto a computer screen. Subjects were scored while performing the Dynamic Gait Index (DGI) and the Timed “Up & Go” (TUG) tests.
Results
Walking performance on the DGI and TUG were significantly associated with GST results in subjects with vestibular disorders, but not in control subjects. Abnormalities of gait could be identified by GST cutoff values of 658 s_1 in the pitch plane and 638 s_1 in the yaw plane.
Discussion/conclusion
In older subjects with vestibular disorders, gaze stability, as assessed by the GST, is associated with reduced test scores on measures of gait performance.
The vestibulo-ocular reflex assists in stabilizing images on the retina during head movement by producing an equal and opposite eye movement [1]. At rapid head velocities above 1008 s1, the VOR is the optimal system to maintain gaze [1,2].However, patientswith vestibular disorders often experience unwanted movement of visual images across the retina, called retinal slip, with head movement[1,3,4]. Patients with vestibular disorders may use smooth pursuit, the cervico-ocular reflex, the optokinetic system, and preprogrammed eye movements to assist in reducing retinal slip [5]. Moreover, patients with vestibular loss restrict head movement to limit retinal slip [6]. Despite these adaptations, retinal slip may lead to a reduction in visual acuity especially when it exceeds 2% s1[3,4,7]. This reduction in visual acuity may occur in particular during gait, wherein vertical head movement is especially prominent [6,7]. Thus, we hypothesized that in patients with vestibular dysfunction, gait function would be associated with gaze stability during head movement. In support of this idea is that patients with vestibular dysfunction have documented gait disorders [8] and an impaired ability to stabilize gaze during high velocity movements [9].
Although we could not measure gaze stability directly during gait, we endeavored to measure gaze stability during the type of head movement that naturally occurs during gait, namely pitch rotations. We used the gaze stability test (GST), wherein a patient’s ability to identify an optotype during active head movement is assessed quantitatively [6]. We then determined whether there was a relationship between clinical measures of gait and findings from the GST. We compared results from patients with vestibular disorders with results from healthy control subjects. We also attempted to identify a threshold for gaze stability performance that was associated with impaired gait in patients with vestibular disorders. Our study was limited to older adults.
1. Methods
All subjects consented to participate in this study, which was approved by the University of Pittsburgh Institutional Review Board (IRB #0607081). Patients were recruited from the Jordan Balance Disorders Center. Thirty-two subjects agreed to participate in the study. Twenty control subjects between the ages of 60 and 80 with a mean age of 70 _ 5.3 and 12 persons with vestibular disease with a mean age of 70.1 _ 6.6 participated. Vestibular function was tested via ocular motor screening, caloric testing, positional testing, rotational testing, and computerized dynamic post urography in both groups.
Of the 12 patients with vestibular disease, 11 had unilateral peripheral vestibular hypo function (six right and five left unilateral peripheral hypo function, two of which were status post-acoustic schwannoma resection) and one had bilateral vestibular hypo function. Control subjects had no history of neurologic or otologic disease, a normal neurological examination including cognition and gait, and normal vestibular function testing, and normal audiometry. All subjects had a mini-mental status examination score of >23 and could walk at least 100 m independently.
Ten out of 12 subjects with vestibular disorders wore corrective eyewear during GST and gait testing including the use of trifocals (two), progressive lenses (one), and bifocals (seven). Of the 20 control subjects, seven wore corrective eyewear during testing; two control subjects wore trifocals, two wore bifocals, and three wore contact lenses.
2. Instrumentation
The gaze stabilization test provides information regarding the functional capacity of the vestibulo-ocular reflex. The device records the maximum active head velocity at which a person can stabilize gaze. The stimulus is a vertical or horizontal head movement at controlled, criterion velocities while viewing a visual optotype (letter E). The expected response is accurate recognition of the optotype orientation at a given velocity. Goebel et al. [6], have reported the GST to be highly reliable across three trials (ICC = 0.91) in persons with unilateral vestibular disorders.
The inVision SystemTM from NeuroCom was used to project the computer-generated optotype E to quantify a participant’s ability to maintain stable gaze while actively moving their head. A head sensor (an InterSense Inertia Cube3, three-axis integrating gyro) was used to simultaneously record velocity and direction of head movements during testing.
3. Test protocol
Testing was performed in a well-lit room at a viewing distance of 1.5 m. The optotype size used for testing was customized for each subject at 0.2 log MAR units above their static visual acuity. Static visual acuity was computed using an algorithm in which an E optotype was presented in one of four orientations: up, down, left, or right. Subjects reported the direction of the “E” and the optotype size was adjusted based on the accuracy of the response. Each optotype size was projected a maximum of five times. Subjects who reported the correct optotype orientation three out of five presentations were presented a smaller optotype whereas those with three out of five errors were presented larger optotype. Gaze stability testing was preceded by a training period so that subjects learned to generate head movement at a consistent head velocity, at a frequency greater than 2 Hz with a position amplitude of less than 208 from midline [6].
Actual testing began using a head velocity of 408 s1, which was progressed in 108 s1 increments with an upper limit of 2008 s1. For each head velocity, once the required velocity was achieved and maintained for at least 40 m s, the computer presented an optotype of fixed size and random orientation. Targets were presented for 75 m s repeatedly at each desired head velocity with a random time delay after the desired head velocity was achieved. Each subject’s GST score was considered the average head velocity at which three of five optotype directions were identified correctly. Testing was performed separately for horizontal (yaw) and vertical (pitch) head movement.
All subjects performed the DGI and the Timed “Up & Go” (TUG) test prior to performing the GST [10,11]. The DGI is an eight-item performance-based gait test that requires patients to walk at their own pace, walk at different speeds, walk with head movement, walk with a quick turn and stop, walk over and around objects, and walk up stairs [11]. It is frequently used to assess gait change in persons with balance and vestibular disorders [12–15]. Scores range from 0 (completely unable) to 24, with each item having a value of 0–3 points as scored by the physical therapist.
During the TUG, subjects stand from a chair (46 cm chair height) with armrests, walk 3 m, and then return to the chair [10]. The TUG has been used with persons with vestibular disorders to assess changes in performance in gait over time [16].
4. Data analysis
Descriptive statistics were used to describe demographic, GST and functional gait characteristics for subjects with vestibular disorders and control subjects. The association between average GST velocity in the pitch and yaw planes and measures of gait/balance function was evaluated using the non-parametric Spearman correlation coefficient for all subjects and for subgroups with and without vestibular disorders. A type I error rate of p < 0.05 was used for all statistical comparisons.
Analysis of the area under the curve (AUC) of a receiver operator characteristic (ROC) was performed to describe the discrimination properties of GST velocity in the pitch and yaw planes to detect a DGI and TUG performance indicative of gait instability. The ROC curve allowed identification of the sensitivity and specificity of the pitch and yaw plane GST velocity for detection of the dichotomous gait outcomes of DGI < 20/24 [17], and TUG > 11.1 s [18]. The sensitivity was plotted against the false positive rate (1 specificity) and the resulting AUC was tested against a null hypothesis of an AUC = .50, indicative of no discrimination. The pitch and yaw plane GST value that maximized the likelihood of identification of subjects with DGI < 20/24 and TUG < 11.1 s was determined using the likelihood ratio (LR, sensitivity/1 specifcity) as an index of the strength of the association between GST velocity and the dichotomized gait outcomes [19].
5. Results
The demographic characteristics, GST velocities, TUG, and DGI performance information for patients with vestibular disorders and for control subjects are presented in Table 1. There was a significant association between the TUG and GST score in subjects with vestibular disorders. Fig. 1A and B displays the scatterplot of TUG performance versus GST velocities for each subject (stratified by control and vestibular disorders) in the pitch (Fig. 1A) and yaw (Fig. 1B) planes. The correlation coefficients for the relationship between GST yaw and pitch plane velocities and performance on the TUG test are shown in Table 2. There was a significant correlation between TUG performance and GST velocity in both the yaw (r = .78) and pitch (r = .77) planes for subjects with vestibular disorders. Correlation between GST velocity and TUG performance was not significant in control subjects.
Table 1.
Demographic, gaze stabilization test (GST) and dynamic gait characteristics of patients with vestibular disorders (n = 12) and control subjects (n = 20): mean (S.D.) unless otherwise specified
| Subject characteristic | Vestibular disorder | Control |
|---|---|---|
| Age, years | 70.1 (6.6) | 70 (5.3) |
| Female, n (%) | 6 (50) | 15 (75) |
| Dynamic gait index (range) | 19 (7–21) | 23 (19–24) |
| Dynamic gait index <20, n (%) | 4 (33.3) | 1 (5) |
| Timed “Up & Go”, s | 11.2 (5.5) | 8.3 (1.3) |
| Timed “Up & Go” >11.1 s, n (%) | 4 (33 3) | 0 (0) |
| Gaze stabilization test: yaw plane, degree s−1 | 79.4 (51 3) | 124.4 (50.4) |
| Gaze stabilization test: pitch plane, degree s−1 | 67.5 (30.4)a | 99.4 (33.3) |
1 subject did not complete testing.
Fig. 1.
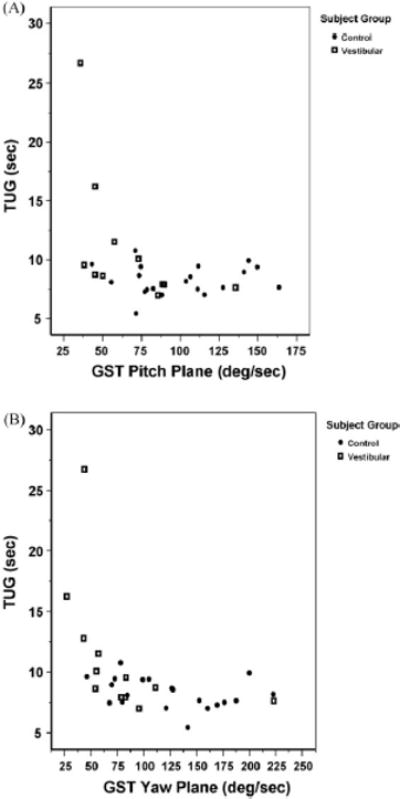
Timed “Up & Go” (TUG) vs. gaze stability test (GST) scores in the pitch (A) and yaw (B) plane for patients with vestibular disorders and control subjects.
Table 2.
Associations between average GST results (degree s−1) far yaw and pitch and measures of dynamic gait performance in patients with vestibular disorders and control subjects: Spearman non-parametric correlation coefficients (significance levels)
| Subject group | Timed “Up & Go”
|
Dynamic gait index
|
||
|---|---|---|---|---|
| GST yaw | GST pitch | GST yaw | GST pitch | |
| Vestibular disorders | −.78 (<.01) | −.77 (<.01) | .66 (<.02) | 88 (<.01) |
| Control | −.32 (ns) | .01 (ns) | .36 (ns) | .04 (ns) |
There was a significant relationship between the DGI and the GST in persons with vestibular disorders (see Table 2). Fig. 2A and B presents the scatterplot of DGI performance versus GST velocities for each subject (stratified by control and vestibular disorders) in the pitch (Fig. 2A) and yaw (Fig. 2B) planes. As shown in Table 2, there was a significant correlation between DGI performance and GST velocity that was strongest in the pitch plane (r = .88) for subjects with vestibular disorders. Correlation between GST velocity and DGI performance was not significant in control subjects.
Fig. 2.
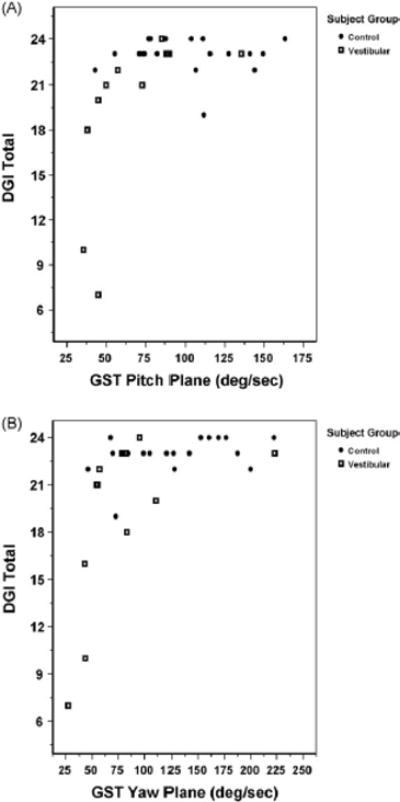
Dynamic gait index (DGI) vs. gaze stability test (GST) scores in the pitch (A) and yaw (B) plane for patients with vestibular disorders and control subjects.
Analysis of AUC for ROC curves demonstrated that GST results in the yaw and pitch plane significantly identified subjects with TUG performance >11.1 s (Table 3). Optimal identification of subjects with TUG performance >11.1 s occurred at GST velocities of less than 638 s1 (yaw, maximum LR = 9.1) and 658 s1 (pitch, maximum LR = 5.6) (Table 3). Sensitivity, specificity, LR and AUC estimates for identification of subjects with TUG > 11.1 s at cutoff velocity values <638 s1 yaw and <658 s1 pitch are identified in Table 3.
Table 3.
Identification of subjects with unstable dynamic gait performance including Timed “Up & Go” > 11.1 s and dynamic gait index <20/24, using yaw and pitch plane gaze-stability test (GST) cutoff values
| Identification category | GST plane | GST cutoff value (degree s−1) | Sensitivity (%) | Specificity (%) | Likelihood ratio | AUC (95% confidence interval) |
|---|---|---|---|---|---|---|
| TUG > 11.1 s | Yaw | <63 | 100 | 89 | 9.1 | 0.96* (0.89–1.0) |
| Pitch | <65 | 100 | 82 | 5.6 | 0.91 (0.79–1.0) | |
| DGI < 20/24 | Yaw | <78 | 75 | 78 | 3.4 | 0.85* (0.67–1.0) |
| Pitch | <65 | 75 | 82 | 4.2 | 0.80 (0.49–1.0) |
Sensitivity, specificity, likelihood ratio, and area under receiver operating characteristic curves (AUC) are shown.
p < 0.05.
Analysis of AUC for ROC curves demonstrated that GST in the yaw and pitch plane significantly identified subjects with DGI performance <20/24. Pitch plane GST velocity provided a higher likelihood for identification of subjects with a DGI performance <20/24 than did GST in the yaw plane. Optimal identification of subjects with DGI < 20/24 occurred at a GST yaw velocity of <788 s1 (maximum LR = 3.4) and a GST pitch velocity <658 s1 (maximum LR = 4.2). Estimates of sensitivity, specificity, LR and AUC associated with the optimal GST cutoffs for identification of subjects with DGI < 20/24 are presented in Table 3.
6. Discussion
This study identified a relationship between GST scores and gait performance in persons with vestibular disease whereas no relationship was noted between GST scores and gait in the control subjects. Patients with worse GST scores were noted to have worse scores on measures of gait. Overall, GST scores were lower in both the pitch and yaw planes for persons with vestibular disorders but GST scores for head movement in the pitch plane were more predictive of abnormal measures of gait.
This is the first study to compare functional visual acuity during head movement in the pitch and yaw planes with functional measures of gait in persons with unilateral vestibular hypo function. We found a strong correlation between the results of the GST in the pitch plane and DGI scores in persons with vestibular disorders. Others have reported that high frequency pitch plane movements in persons with unilateral hypo function were not different than movement in control subjects [20]. There was only one patient in our study whose GST score for pitch plane movement was >90% s1, suggesting that in our patients there were differences for head movement between patients and controls in the pitch plane. In a study that examined the temporal and spatial gait characteristics of people with and without vestibular disease, walking with pitch and yaw plane head movements demonstrated effect size differences between groups of >.7 [8]. The large effect size illustrates the difficulty of walking while making head movements for patients with vestibular disorders.
In the yaw plane, moderately strong correlations were noted between the GST and the TUG and DGI. Whitney et al. [18], reported that movement of the head in the pitch plane had a stronger relationship to reported falls than head movement in the yaw plane during gait in persons with vestibular disorders. Abnormal inputs from the cervical afferents may cause conflict with vestibular inputs received in the vestibular nucleus, possibly resulting in an altered perception of the patient’s position in space [18,21,22].
Hillman et al. [23], reported that during both standing and ambulating on a treadmill, dynamic visual acuity was worse in patients with labyrinthine deficiencies compared to control subjects. In addition, Roberts et al. [24], reported that patients with vestibular disease had impaired dynamic visual acuity compared to control subjects while performing volitional pitch head movements while ambulating on a treadmill. Pozzo et al [25], have reported that persons with vestibular disorders reduce head rotation movements during walking in the dark. Our study using GST is consistent with the studies using DVA.
7. Conclusion
Gaze stability test scores are significantly associated with performance measures of gait in older patients with vestibular disorders. This association suggests the possibility that impaired vision during gait contributes to gait instability in older adults with vestibular disorders.
Acknowledgments
This project was supported in part by funding from the National Institutes of Health via K23 DC005384, the P30 DC05205 and P30 AG024827 (Pittsburgh Claude D. Pepper Center for Older Americans Independence Center). The K23 award supported the first author and the P30 supported the GST project. Portions of these data were presented at the Association for Research in Otolaryngology in Denver, CO, February 11, 2007.
Footnotes
Conflict of interest
All authors have participated in the study and contributed to the preparation of the manuscript. The paper has not been submitted to any other journal for review.
References
- 1.Leigh RJ, Zee DS. The neurology of eye movements. Oxford University Press; New York: 1999. [Google Scholar]
- 2.Maas EF, Huebner WP, Seidman SH, Leigh RJ. Behavior of human horizontal vestibulo-ocular reflex in response to high-acceleration stimuli. Brain Res. 1989;499:153–6. doi: 10.1016/0006-8993(89)91145-1. [DOI] [PubMed] [Google Scholar]
- 3.Grossman GE, Leigh RJ, Bruce EN, Huebner WP, Lanska DJ. Performance of the human vestibuloocular reflex during locomotion. J Neurophysiol. 1989;62:264–72. doi: 10.1152/jn.1989.62.1.264. [DOI] [PubMed] [Google Scholar]
- 4.Hess K, Gresty M, Leech J. Clinical and theoretical aspects of head movement dependent oscillopsia (hmdo). A review. J Neurol. 1978;219:151–7. doi: 10.1007/BF00314530. [DOI] [PubMed] [Google Scholar]
- 5.Schubert MC, Minor LB. Vestibulo-ocular physiology underlying vestibular hypofunction. Phys Ther. 2004;84:373–85. [PubMed] [Google Scholar]
- 6.Goebel JA, Tungsiripat N, Sinks B, Carmody J. Gaze stabilization test: a new clinical test of unilateral vestibular dysfunction. Otol Neurotol. 2007;28:68–73. doi: 10.1097/01.mao.0000244351.42201.a7. [DOI] [PubMed] [Google Scholar]
- 7.Demer JL, Honrubia V, Baloh RW. Dynamic visual acuity: a test for oscillopsia and vestibulo-ocular reflex function. Am J Otol. 1994;15:340–7. [PubMed] [Google Scholar]
- 8.Marchetti GF, Whitney SL, Blatt PJ, Morris LO, Vance JM. Temporal and spatial characteristics of gait during performance of the dynamic gait index in people with and people without balance or vestibular disorders. Phys Ther. 2008;88:640–51. doi: 10.2522/ptj.20070130. [DOI] [PMC free article] [PubMed] [Google Scholar]
- 9.Schubert MC, Migliaccio AA, Clendaniel RA, Allak A, Carey JP. Mechanism of dynamic visual acuity recovery with vestibular rehabilitation. Arch Phys Med Rehabil. 2008;89:500–7. doi: 10.1016/j.apmr.2007.11.010. [DOI] [PMC free article] [PubMed] [Google Scholar]
- 10.Podsiadlo D, Richardson S. The Timed “Up & go”: a test of basic functional mobility for frail elderly persons. J Am Geriatr Soc. 1991;67:387–9. doi: 10.1111/j.1532-5415.1991.tb01616.x. [DOI] [PubMed] [Google Scholar]
- 11.Shumway-Cook A, Woollacott M. Motor control: theory and practical applications. Baltimore: Williams and Wilkins; 1995. [Google Scholar]
- 12.Badke MB, Shea TA, Miedaner JA, Grove CR. Outcomes after rehabilitation for adults with balance dysfunction. Arch Phys Med Rehabil. 2004;85:227–33. doi: 10.1016/j.apmr.2003.06.006. [DOI] [PubMed] [Google Scholar]
- 13.Brown KE, Whitney SL, Marchetti GF, Wrisley DM, Furman JM. Physical therapy for central vestibular dysfunction. Arch Phys Med Rehabil. 2006;87:76–81. doi: 10.1016/j.apmr.2005.08.003. [DOI] [PubMed] [Google Scholar]
- 14.Gottshall KR, Moore RJ, Hoffer ME. Vestibular rehabilitation for migraineassociated dizziness. Int Tinnitus J. 2005;11:81–4. [PubMed] [Google Scholar]
- 15.Wrisley DM, Whitney SL, Furman JM. Vestibular rehabilitation outcomes in patients with a history of migraine. Laryngoscope. 2002;23:483–7. doi: 10.1097/00129492-200207000-00016. [DOI] [PubMed] [Google Scholar]
- 16.Cohen HS, Kimball KT. Decreased ataxia and improved balance after vestibular rehabilitation. Otolaryngol Head Neck Surg. 2004;130:418–25. doi: 10.1016/j.otohns.2003.12.020. [DOI] [PubMed] [Google Scholar]
- 17.Whitney SL, Hudak MT, Marchetti GF. The dynamic gait index relates to selfreported fall history in individuals with vestibular dysfunction. J Vestib Res. 2000;10:99–105. [PubMed] [Google Scholar]
- 18.Whitney SL, Marchetti GF, Schade A, Wrisley DM. The sensitivity and specificity of the Timed “Up & Go” and the dynamic gait index for self-reported falls in persons with vestibular disorders. J Vestib Res. 2004;14:397–409. [PubMed] [Google Scholar]
- 19.McGee S. Simplifying likelihood ratios. J Gen Intern Med. 2002;17:646–9. doi: 10.1046/j.1525-1497.2002.10750.x. [DOI] [PMC free article] [PubMed] [Google Scholar]
- 20.Gianna-Poulin CC, Stallings V, Black FO. Eye movement responses to active, high-frequency pitch and yaw head rotations in subjects with unilateral vestibular loss or posterior semicircular canal occlusion. J Vestib Res. 2003;13:131–41. [PubMed] [Google Scholar]
- 21.Cohen LA. Role of eye and neck proprioceptive mechanisms in body orientation and motor coordination. J Neurophysiol. 1961;24:1–11. doi: 10.1152/jn.1961.24.1.1. [DOI] [PubMed] [Google Scholar]
- 22.Mergner T, Huber W, Becker W. Vestibular–neck interaction and transformation of sensory coordinates. J Vestib Res. 1997;7:347–67. [PubMed] [Google Scholar]
- 23.Hillman EJ, Bloomberg JJ, McDonald PV, Cohen HS. Dynamic visual acuity while walking in normals and labyrinthine-deficient patients. J Vestib Res. 1999;9:49–57. [PubMed] [Google Scholar]
- 24.Roberts RA, Gans RE, Johnson EL, Chisolm TH. Computerized dynamic visual acuity with volitional head movement in patients with vestibular dysfunction. Ann Otol Rhinol Laryngol. 2006;115:658–66. doi: 10.1177/000348940611500902. [DOI] [PubMed] [Google Scholar]
- 25.Pozzo T, Berthoz A, Vitte E, Lefort L. Head stabilization during locomotion. Perturbations induced by vestibular disorders Acta Otolaryngol Suppl. 1991;481:322–7. doi: 10.3109/00016489109131413. [DOI] [PubMed] [Google Scholar]