

Abstract
Many cancers show primary or acquired drug resistance due to the overexpression of efflux pumps. A novel mechanism to circumvent this is to integrate drugs, such as anthracycline antibiotics, with nanoparticle delivery vehicles that can bypass intrinsic tumor drug-resistance mechanisms. DNA nanoparticles serve as an efficient binding platform for intercalating drugs (e.g. anthracyclines doxorubicin and daunorubicin, which are widely used to treat acute leukemias) and enable precise structure design and chemical modifications, for example for incorporating targeting capabilities. Here, we utilize DNA nanostructures to circumvent daunorubicin drug resistance at clinically relevant doses in a leukemia cell line model. We report the fabrication of a rod-like DNA origami drug carrier that can be controllably loaded with daunorubicin. We further directly verify that nanostructure-mediated daunorubicin delivery leads to increased drug entry and retention in cells relative to free daunorubicin at equal concentrations, which yields significantly enhanced drug efficacy. Our results indicate that DNA origami nanostructures can circumvent efflux pump-mediated drug resistance in leukemia cells at clinically relevant drug concentrations and provide a robust DNA nanostructure design that could be implemented in a wide range of cellular applications due to its remarkably fast self-assembly (~5 minutes) and excellent stability in cell culture conditions.
Keywords: DNA nanotechnology, DNA origami, drug delivery, drug resistance, leukemia
Graphical abstract
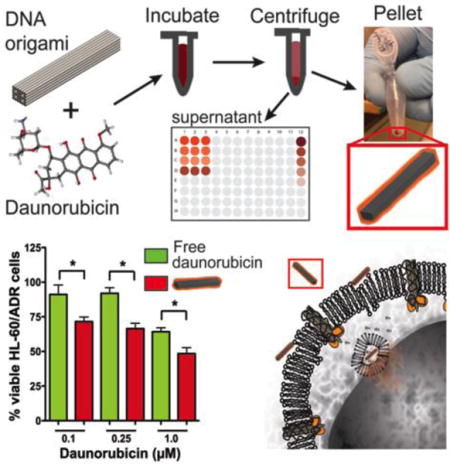
Rod-shaped Trojan ‘Horse’ DNA origami nanostructures intercalated with the anthracycline daunorubicin circumvent drug resistance in HL-60/ADR multi-drug resistant human leukemia cells at clinically relevant drug concentrations. Proof-of-concept enhanced efficacy is evaluated through colorimetric assays, fluorescence microscopy, and flow cytometry demonstrating a versatile delivery system with controllable drug loading that could ultimately be applied to multiple types of human cancer.
1. INTRODUCTION
The majority of human cancers remain incurable, and many patients either do not respond or relapse as a consequence of either primary or acquired multi-drug resistance (MDR). While the causes of this are complex, MDR can often be attributed to the overexpression of efflux pumps that either are present in the tumor at diagnosis or are induced following treatment. These commonly include P-glycoprotein (P-gp; also known as MDR1; gene name ABCB1) and multi-drug resistance protein-1 (MRP1; gene name ABCC1).[1, 2] Importantly, many synthetic and natural product derived therapeutics commonly used in the treatment of cancer are substrates of these pumps. Such agents are not limited to classical chemotherapies such as taxol or vincristine, but also include newer, targeted agents such as imatinib and lenalidomide.[2, 3] Furthermore, although MDR frequently is established following prolonged exposure to a single therapeutic, cells with MDR become resistant to many other agents, both structurally related and unrelated.[1] Thus, the exploration of robust strategies to circumvent efflux-pump mediated MDR remains a high priority in cancer research.
One therapeutic approach to circumvent MDR is to employ nanoparticles containing chemotherapeutic agents, such as the anthracyclines doxorubicin and daunorubicin, to allow them to bypass efflux pump resistance mechanisms.[4, 5] Nanoparticle drug delivery for the treatment of human cancer has received widespread attention due to the ability to preferentially accumulate within tumor cells through the enhanced permeability and retention (EPR) effect in contrast to conventional chemotherapeutics that typically distribute throughout the body affecting both cancerous and normal cells, as well as tumor specific antigen targeting capabilities.[6–8] Various drug-loaded nanoparticles have been reported to enhance cellular uptake, reduce side effects, increase delivery efficiencies, increase pharmacokinetic drug half-life, and ensure proper tissue specific localization,[6, 9–11] supporting nanoparticle-mediated drug delivery as a powerful means to improve efficacy and reduce toxicity of anti-cancer therapies. Currently, there are six clinically approved nanoparticle delivery systems with numerous others in clinical trials and preclinical development[6, 8] suggesting that nanoparticle drug delivery is a viable therapeutic approach to human cancer with clearly growing potential. The first clinically approved nanoparticle delivery systems for the treatment of cancer were liposomal anthracyclines including Doxil (pegylated lipsosomal encapsulated doxorubicin), Myocet (non-pegylated liposomal doxorubicin), and DaunoXome (liposomal daunorubicin).[12] However, such formulations are suboptimal because of vascular permeability limitations, dose limitations due to cardiotoxicity, and slow or unpredictable drug release.[13, 14] Additionally, none have been shown to be more effective in acute myeloid leukemia, the most common adult leukemia in which anthracycline therapy such as free daunorubiin is commonly used. Thus, novel nanoparticle drug delivery technologies are being aggressively developed. Structural DNA nanotechnology,[15, 16] which enables unprecedented control over nanoscale geometry and biochemical functionalization, has recently demonstrated immense potential for biomedical applications including controlled release of medicinal compounds,[17, 18] fluorescent-based imaging applications,[19] targeted delivery,[20] and particularly relevant to this study, delivery of small molecule chemical therapeutics.[4, 18, 21, 22]
Here, we exploit DNA nanostructures as a drug delivery vehicle in human leukemia cells exhibiting MDR. We describe the fabrication of a rod-like DNA nanostructure referred to hereafter as “Horse” (inspired by the Trojan Horse employed by ancient Greek warriors to circumvent defenses), which was fabricated via the scaffolded DNA origami molecular self-assembly process.[23–25] As previously demonstrated for the drug doxorubicin,[4, 18] anthracyclines are well suited to DNA-mediated delivery due to their inherent intercalation properties.[26] Here we test whether delivery of daunorubicin-loaded DNA nanostructures is a feasible approach to enhance drug efficacy in leukemia cells displaying MDR. We chose to study daunorubicin since it is more widely used in treating acute myeloid leukemia[27–30] and to test the robustness of DNA nanostructure anthracycline delivery. Our findings demonstrate that daunorubicin-loaded Horse DNA nanostructures circumvent MDR1-mediated drug resistance in a resistant model of leukemia at clinically relevant drug concentrations. Our results establish feasibility and provide rationale for exploring DNA origami as a drug delivery system in leukemia and other hematologic malignancies.
2. RESULTS AND DISCUSSION
2.1 Design and construction of a DNA origami engineered rod-like Horse nanostructure drug delivery system
One previous report in an adherent cell line revealed that a doxorubicin-loaded DNA nanostructure engineered via DNA origami outperformed free doxorubicin in the ability to induce cell death in doxorubicin-resistant MCF-7 adenocarcinoma cells.[4] Furthermore, the effect was shown to be shape-dependent as rod-shaped DNA nanostructures loaded with doxorubicin outperformed triangular-shaped nanostructures.[4] In addition, a number of prior studies have demonstrated efficient uptake of nanoparticles 100 nm and smaller, as summarized by Shang et al.[31] Together, these findings provide strong rationale to explore the ability of a rod-shaped DNA nanostructures in the ~1–100 nm size range to serve as a drug delivery device for not only the treatment of solid tumors but also hematologic malignancies.
Here we expand on this work to characterize the function of DNA origami nanostructures for circumventing drug resistance in delivering daunorubicin at clinically relevant concentrations to leukemia cells, specifically an acute promyelocytic leukemia (APL) model. We designed the scaffolded DNA origami rod-like Horse nanostructure (~92.5 × ~13.2 × ~11 nm) using the DNA design software cadnano.[32] While nanoparticle uptake in HL-60 cells has not been quantified, previous research has shown suspension cells effectively uptake particles in this size range.[31, 33–35] The structure contains four internal cavities in order to maximize the surface area accessible to solution and allow for a larger cross-section for mechanical stability (Figure 1A). The full cadnano design and corresponding oligonucleotide sequences are provided in the Supplemental Information (Figure S1 and Table S1, Supporting Information). To ensure proper molecular self-assembly and purify well-folded structures, self-assembled nanostructures were subjected to agarose gel electrophoresis. Figure 1B shows an image of a gel including (from left to right) a 1kb DNA ladder (L), the 7249 M13mp18 scaffold starting material (S), the Horse DNA nanostructure (1), the Horse nanostructure containing 10 (2) and 36 (3) overhangs, a Yoyo-1-labeled Horse structure (4), and a daunorubicin-loaded Horse DNA nanostructure (5). We defined a normalized loading parameter, the base pair binding ratio, as the ratio between the concentration of daunorubicin-(drug) loaded into Horse DNA nanostructures to the total concentration of DNA base pairs in solution (sample calculation in Figure S3A, Supporting Information). The last lane of the gel shows structures loaded with a BPBR of 0.42. A low bp binding ratio was used for gel electrophoresis since highly loaded Horse nanostructures (bp binding ratios ≳ 1) migrated in the reverse direction because of the positive charge of the daunorubicin. In all Horse DNA nanostructure reactions, sharp bands were present that ran further than the 7249 M13mp18 scaffold control indicative of well-folded structures (Figure 1B). Leading bands were excised and visualized via transmission electron microscopy (TEM) and atomic force miscroscopy (AFM) revealing well-folded Horse DNA nanostructures (Figure 1C). The nanostructures exhibited a banded pattern in TEM images, with the dark bands along the length corresponding to the inner cavities of the Horse geometry. Daunorubicin-loaded Horse structures at a bp binding ratio of 1.2 (TEM) and 0.8 (AFM) were visualized 24 hours post loading (Figure 1D) and revealed drug-loading caused a twisting and fraying effect on the Horse nanostructures consistent with previous studies,[18] which is due to the local structural changes imposed by drug intercalation. With the intention of applying Horse DNA nanostructures in cell culture conditions, we tested the stability in RPMI 1640 cell culture medium supplemented with 20% FBS at various time points at 37°C over a 24-hr period followed by analysis via agarose gel electrophoresis (Figure 1E). At each time point the Horse DNA nanostructures remained intact both in the presence (Figure 1E) or absence (Figure S2, Supporting Information) of 20% FBS heat inactivated at 56°C. Interestingly, a recent study showed that both a 6-helix nanotube and a 24-helix nanorod structures were digested by serum nucleases in a time-dependent manner in standard RPMI cell culture medium supplemented with 10% FBS and heat inactivated at 56°C.[36] The same study showed this effect could be reversed by heat inactivation of serum at 75°C or via nuclease competitive binding using actin, and the same group demonstrated membrane encapsulation can improve in vivo stability.[37] Our results suggest that structure design may be another viable route to obtain enhanced stability in cell culture conditions. The enhanced stability of the Horse structure may be due to the square lattice design with internal cavities, which allow for lower total cross-over density equating to higher local thermodynamic stability. Furthermore, square lattice structures contain internal stresses and denser packing of helices on the outer layer,[38] which might inhibit nuclease recognition and degradation.
Figure 1.
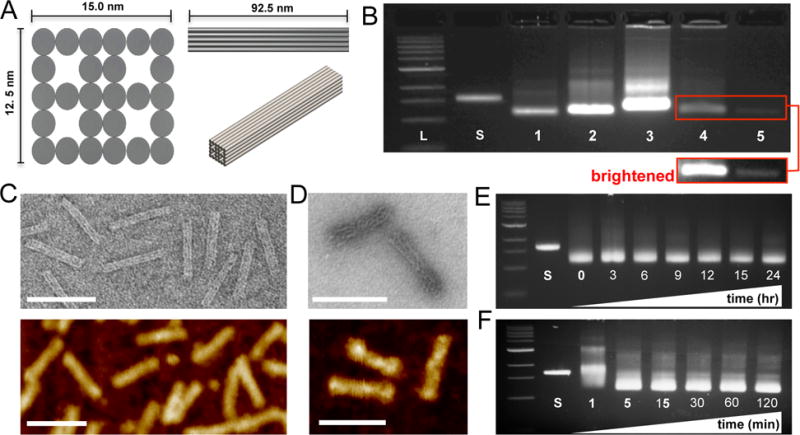
Design and construction of a DNA origami engineered rod-like Horse nanostructure drug delivery system. (A) 2- and 3-dimensional design schematics of the Horse nanostructure (~92.5 × ~13.2 × ~11 nm) containing four open cavities that extend along the length of the structure with a total surface area (~8787.5nm2). (B) Upon completion of a 17-hour DNA origami molecular self-assembly reaction, samples were resolved via agarose gel electrophoresis (left to right; L = DNA ladder, S = 7249 M13mp18 scaffold, 1 = Horse DNA nanostructure, 2 = Horse nanostructure with 10 overhangs, 3 = Horse nanostructure with 36 overhangs, 4 = Yoyo-1-labeled Horse nanostructure, and 5 = Horse DNA nanostructures loaded with daunorubicin to a base pair binding ratio of 0.42). The inset shows a brightened image of lanes 4 and 5. (C) Leading DNA bands were excised from agarose gels, gel purified and imaged by transmission electron microscopy (TEM, top) and atomic force microscopy (AFM, bottom). (D) Daunorubicin loaded Horse DNA nanostructures at a base pair binding ratio of ~1 were imaged via TEM (top) and AFM (bottom) revealing fraying of the structure upon drug loading. Representative gels and TEM images are shown from three independent experiments. (E) Horse DNA nanostructures were mixed with complete RPMI 1640 medium supplemented with 20% FBS at 37°C for 3, 6, 9, 12, 15, and hours to address stability via agarose gel electrophoresis. (F) Horse DNA nanostructure folding reactions were subjected to a ‘rapid fold’ thermal annealing ramp for 1, 5, 15, 30, 60, and 120 minutes and evaluated via agarose gel electrophoresis. Representative gels are shown from two independent experiments.
Although it is often not taken into consideration, ease of fabrication is also an essential characteristic for scalability toward pre-clinical development for a novel biomedical nanodevice. Therefore, we aimed to demonstrate straightforward and rapid assembly of the Horse nanostructures following a previous report that demonstrated assembly of DNA nanostructures on the timescale of ~5–60 minutes via thermal annealing at constant temperature.[39] To address this, Horse DNA nanostructure folding reactions were subjected to thermal annealing at 52°C utilizing a procedure described previously[39] for various time points over a 2 hr time course followed by evaluation via agarose gel electrophoresis (Figure 1F). Pronounced well-folded structure bands were observed already after ~5 min demonstrating an ability to manufacture Horse DNA nanostructures in a robust manner over a short time scale. Interestingly Sobczak et al.[39] demonstrated folding of 2D (single-layer) structures within 5 minutes, while compact 3D (multi-layer) structures took ~30–60 minutes, suggesting that in addition to enhanced stability the Horse nanostructure design is remarkably fast folding for a compact 3D nanostructure. This may also be due to the high local thermodynamic stability enabled by the square lattice and internal cavities. Taken together, these findings confirm the construction of well-folded Horse DNA nanostructures that can be easily and quickly fabricated and are capable of drug loading, albeit with slightly altered internal structure. Furthermore, Horse DNA nanostructures are stable in cell culture conditions containing 20% FBS providing strong support for its use as a novel drug delivery device.
2.2 Daunorubicin intercalates into Horse DNA nanostructures
While previous studies of DNA nanostructure mediated delivery employed doxorubicin,[4, 18, 21] we chose to study delivery of daunorubicin due to its widespread use in the clinic for treatment against adult and pediatric acute leukemia.[27–30, 40] To optimize drug loading, daunorubicin was mixed with Horse DNA nanostructures at varying conditions. The concentration of daunorubicin loaded into DNA nanostructures was determined from the concentration difference between free daunorubicin in solution prior to and post Horse nanostructure addition as determined by absorbance measurements at 480 nm, the absorption wavelength of daunorubicin.[41] The procedure for loading and concentration measurements is depicted schematically in the inset of Figure 2A. Daunorubicin at a concentration of 250 μM was incubated with 10 nM Horse DNA nanostructures at varying temperatures and for a range of times. Base pair binding ratios were comparable as a function of temperature (data not shown) and drug loading increased up to ~30 min of incubation and then remained steady for up to several days (Figure S3B, Supporting Information). In addition, varying concentrations of Horse nanostructures (5–240 nM) were mixed with 500 μM daunorubicin, and in separate experiments varying concentrations of daunorubicin (62.5–2500 μM) were mixed with 20 nM Horse nanostructures, all for 24-hour incubation times. The bp binding ratio depended inversely on DNA origami concentration (Figure 2A) and linearly on the daunorubicin concentration (Figure 2B) present in the loading reaction. The efficiency of daunorubicin loading (i.e. fraction of drug loaded into nanostructures from solution) remained in the range of 40–70% as a function of time or varying daunorubicin in solution, but did increase up to ~90% with increasing DNA origami in solution (Figure S3, Supporting Information) suggesting efficiency of drug loading may be controlled by the amount of DNA origami nanostructures in solution. Interestingly, incubating low concentrations of DNA origami with high daunorubicin concentrations (≳ 500 nM) led to bp binding ratios above 1.0 (Figure 2B). This was likely due to the ability of daunorubicin to bind in the minor groove of DNA[42] and electrostatic interactions mediated by the positively charged daunorubicin molecules due to protonated amines physically wrapping around the poly-anionic backbone of the Horse DNA nanostructure helices, as previously described for anthracycline binding to DNA.[43] Gel electrophoresis analysis of daunorubicin loaded Horse nanostructures revealed that overloading (base pair binding ratios above 1.0) impacted electrophoretic mobility (Figure S3, Supporting Information), while base pair binding ratios <1.0 had little impact on migration of nanostructures. While increased drug loading initially seemed desirable, bp binding ratios much larger than 1 resulted in reduced efficacy (Figure S4, Supporting Information). The fluorescence properties of daunorubicin allowed direct imaging of daunorubicin-loaded nanostructures, which revealed large aggregates of structures loaded with bp binding ratios much greater than 1, effectively reducing the concentration of structure in solution (Figure S5B, Supporting Information). These large aggregates, which might prove toxic or immunogenic in vivo, were not observed at lower bp binding ratios (≲1.0) (Figure S5A and Movie S1, Supporting Information).
Figure 2.
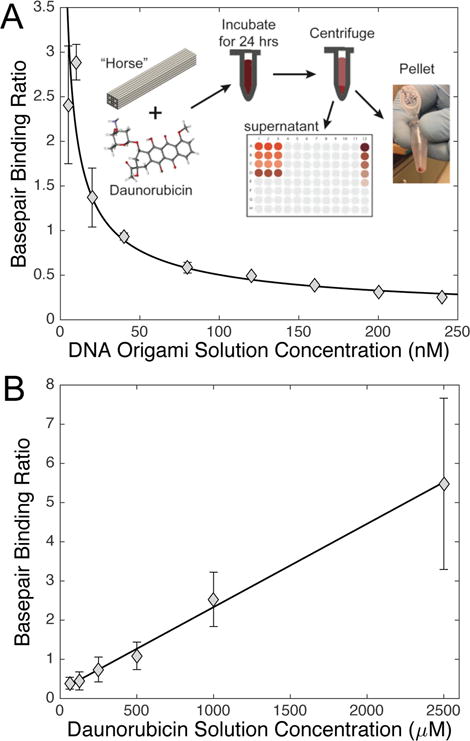
Daunorubicin effectively intercalates and releases from the Horse DNA nanostructure. (A) Varying concentrations of Horse DNA nanostructures (5–240 nM) were added to 500 μM daunorubicin, and the amount of loaded daunorubicin was determined colorimetrically by absorbance. The inset illustrates the process of drug loading including mixing, incubation, centrifugation, and measuring the daunorubicin concentration left in the supernatant. The data are presented in triplicate as mean bp binding ratio ± SD (SD was smaller than the marker size for larger concentrations). (B) Varying concentrations of daunorubicin (62.5–2500 μM) were added to Horse nanostructures at 20 nM for 24 hours followed by free daunorubicin removal. Linear regression statistical analysis was applied to the data set. The data are presented as normalized mean relative intensity ± SD in triplicate and represent three independent experiments.
Retention of drug in the nanostructure prior to cell uptake is a critical aspect of drug delivery function. Here we evaluated the in vitro retention of daunorubicin in drug-loaded Horse nanostructures under experimental conditions. Incubation for varying times up to 24 hours in either storage buffer (PBS, 10 mM MgCl2) or culture media (clear RPMI 1640, 20% FBS) led to release of approximately 30% or 50% of loaded daunorubicin, respectively (Figure S6A, Supporting Information). In both cases drug release occurred in a time-dependent manner up to 6 hours followed by a gradual increase with approximately 31% and 50% of the drug released over 24 hours in storage buffer and culture media, respectively. Interestingly, removing free drug from solution via a series of washes (i.e. centrifugation, removal of supernatant, and resuspension) triggers additional drug release, and under these conditions, low pH and the presence of serum proteins enhance drug release (Figure S6B, Supporting Information). Therefore, in our experiments, a significant fraction of drug should remain loaded in the nanostructures at the point of cellular entry, and upon cellular uptake, low pH and interactions with enzymes or proteins may trigger additional release of daunorubicin. These results can also inform future in vivo studies of drug leakage as the technology progresses toward clinical development.
2.3 Daunorubicin-loaded Horse DNA nanostructures are internalized by HL-60/ADR cells
The generation of drug resistance in MDR models of APL is mediated through the increased expression of the MDR1 and MRP1 protein efflux pumps in the plasma membrane that effectively export small molecules to sustain cell survival and growth.[1] Since a primary mechanism for entry of free anthracycline drugs is passive diffusion across the cell membrane,[44] they are susceptible to efflux-pump mediated expulsion.[1] To characterize the ability of the DNA origami Horse nanostructures to circumvent efflux pumps, we used flow cytometry and fluorescence imaging to directly quantify the level of daunorubicin internalization when presented to cells either free in solution or via Horse DNA nanostructures. Parental HL-60 and drug-resistant HL-60/ADR cells were cultured in the presence of either free daunorubicin or loaded Horse DNA nanostructures for 24 hours. The level of daunorubicin present in cells was measured via flow cytometry. An increase in daunorubicin fluorescence was evident when delivered via Horse DNA nanostructures relative to free daunorubicin and untreated controls at 24 hours, illustrated by a shift to the right of the histogram in Figure 3A. In order to monitor intracellular daunorubicin in real time, parental HL-60 and HL-60/ADR cells were cultured in the presence of free daunorubicin or loaded Horse DNA nanostructures for three hours followed by a PBS wash. The level of fluorescent daunorubicin present in the cells was then monitored in an imaging chamber under physiological conditions (5% CO2, 37°C in a humidified environment). Quantification of daunorubicin fluorescence present in individual cells revealed approximately 2.9-fold increased levels of daunorubicin in HL-60 cells relative to HL-60/ADR cells (Figures 3B and 3C, and Table S2, Supporting Information), which is expected due to the elevated expression and activity of protein efflux pumps on the HL-60/ADR cell surface. While a steady decline in daunorubicin fluorescence was evident among HL-60 cells over time, HL-60/ADR cells exhibited a slightly faster decrease until 1.5 hours followed by sustained fluorescence (Figure 3C). Delivering daunorubicin via Horse nanostructures resulted in ~1.4-fold more fluorescence retained in both HL-60 parental and HL-60/ADR cells relative to free daunorubicin (Figure 3B and 3C, and Table S2, Supporting Information). Some difference is already present at time zero of the measurement, which suggests that nanostructure-mediated delivery leads to more drug initially entering the cell. Interestingly, the rate of expulsion of daunorubicin (i.e. slopes in Figure 3) is similar for the nanostructure delivery and free delivery cases. It is possible that some amount of daunorubicin leaks out of structures during or after cellular internalization and is expelled at a similar rate to the free daunorubicin. Nevertheless, approximately 40% increases in intracellular daunorubicin fluorescence persist in both HL-60 and HL-60/ADR (Table S2, Supporting Information) when the drug is delivered via Horse DNA nanostructures compared to free daunorubicin. This is likely due to a combination of more drug initially entering the cell and some fraction of the drug remaining sequestered in structures taken up by cells long enough to prevent expulsion. These findings confirm that drug loaded Horse DNA nanostructures are not only internalized by HL-60 and HL-60/ADR cells, but they also allow for larger amounts of intracellular daunorubicin implicating potential for drug resistance circumvention.
Figure 3.
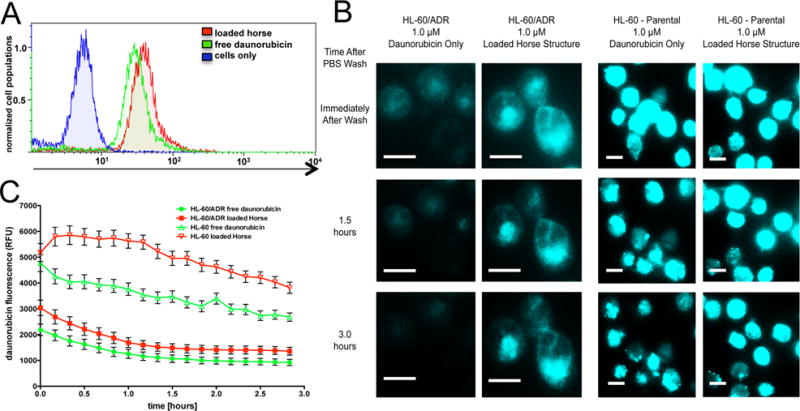
Daunorubicin-loaded Horse DNA nanostructures are internalized by HL-60/ADR cells. (A) Either free daunorubicin or daunorubicin-loaded Horse DNA nanostructures (1 μM daunorubicin) were introduced to HL-60/ADR cells for 24 hours. The level of intracellular daunorubicin fluorescence was determined via flow cytometry. Cells were considered viable using Near IR LIVE/DEAD viability cell stain. A representative histogram overlay is shown from three independent experiments. (B) Either free daunorubicin or daunorubicin loaded Horse DNA nanostructures (1 μM daunorubicin) were introduced to HL-60/ADR or HL-60 parental cells for three hours followed by a PBS wash and subject to live cell fluorescence imaging via total internal reflection (TIRF) (488 nm excitation) at ten minute intervals for approximately three hours. Scale bars are 10 μm. (C) Time traces of the level of intracellular daunorubicin were measured from at least 50 individual cells where the data are presented as the mean relative fluorescent unit (RFU) ± SEM where data and images represent two independent experiments.
2.4 Visualization of Horse DNA nanostructure entry and lysosomal compartment localization in HL-60/ADR cells
To further explore the mechanism of drug delivery, we visualized nanostructure uptake and intracellular localization via fluorescence microscopy. Previous work has demonstrated DNA nanostructures can be uptaken via endocytic pathways,[45, 46] and a recent study revealed the presence of doxorubicin loaded DNA nanostructures within lysosomal compartments and proposed lysosomal acidification of DNA nanostructures as a potential mechanism driving drug release.[4] Therefore, we hypothesized that upon spontaneous uptake, daunorubicin loaded Horse DNA nanostructures similarly localized to intracellular lysosomal compartments of HL-60/ADR cells to be degraded followed by daunorubicin release. In order to test this hypothesis, Cy3-labeled Horse DNA nanostructures were added to cells labeled with Lysotracker Green (Life Technologies) and monitored using epifluorescence and bright field DIC time lapse imaging from zero to 18 hours after introduction of nanoparticles (Movies S1–S4, Supporting Information). Labeled structures consistently entered HL-60/ADR cells in a time-dependent manner (Figure 4A) and localized to lysosomal compartments as shown via epifluorescence and confirmed by confocal microscopy using Alexa647-labeled Horse DNA nanostructures using (Figure 4A and B, Figure S7A, and Movie S5, Supporting Information). As an important control, we verified that Lysotracker Green failed to fluoresce in the red channel (640 nm excitation), confirming that fluorescence in this channel is from Alexa647 labeled nanostructures (Figure S7B, Supporting Information). In addition, the level of Cy3-Horse DNA nanostructure internalization measured at the single cell level revealed a time-dependent increase in Cy3-Horse signal that appeared to reach steady state around 5 hours (Figure S8, Supporting Information). Based on a previous study that quantified the number of DNA nanostructures uptaken by KB-3–1 cells to be in the range of tens of DNA origami nanostructures per cell at lower concentrations of nanostructure,[47] here we probably have at least that many Horse nanostructures internalized and likely much more per HL-60/ADR cell. It was confirmed that internalization of unloaded Horse structures failed to induce cell death of HL-60/ADR cells (Figure S9 and Movies S3 and S4, Supporting Information), even though they were effectively internalized by (Movies S3 and S4, Supporting Information). Loaded Horse structures were observed to induce cell death (Movie S6, Supporting Information) as monitored via bright field (DIC) and epifluorescence time lapsed imaging.
Figure 4.
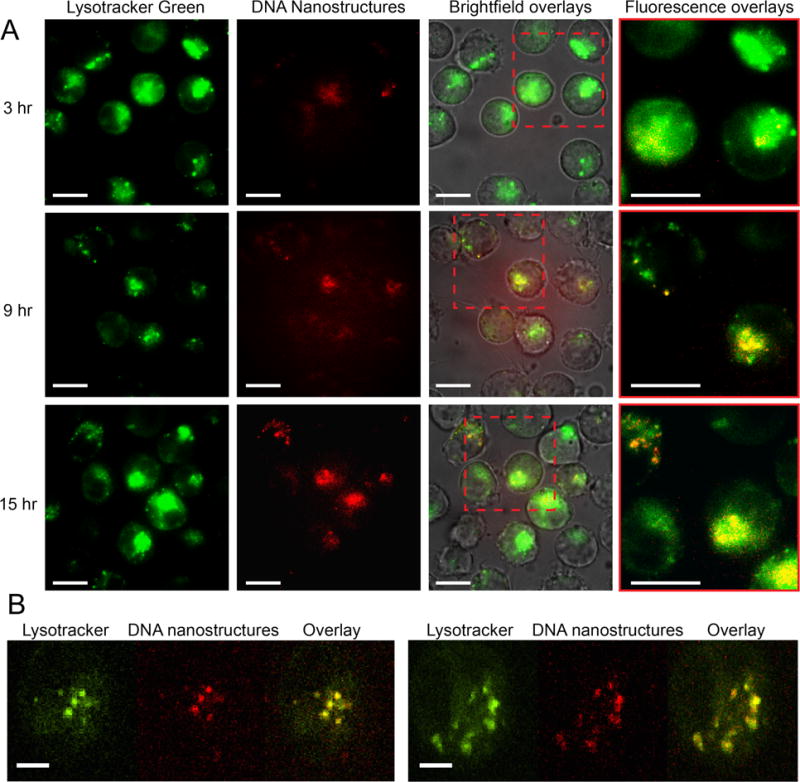
Visualization of Horse DNA nanostructure entry and lysosomal compartment localization in HL-60/ADR cells to induce cell death. (A) Cy3-labeled Horse DNA nanostructures (561 nm excitation) and Lysotracker Green fluorescent molecules (488 nm excitation) were added to HL-60/ADR cells and monitored via epifluorescence and bright field (DIC) time lapse imaging from 2 to 18 hours after incubation of nanostructures. Representative images are shown at 3, 9, and 15 hours post nanostructure addition from three independent experiments. The first column depicts acidic lysosomes, the second column depicts Cy3-labeled Horse nanostructures, the third column represents a DIC, 488 nm and 561nm channel overlay, and the fourth column shows zoomed-in overlays of the dashed red box showing acidic compartments (green), Horse nanostructures (red) and co-localized regions (yellow). (B) Alexa647-labeled Horse DNA nanostructures (640 nm excitation) and Lysotracker Green fluorescent molecules (488 nm excitation) were added to HL-60/ADR cells for 1 hour and visualized via confocal microscopy. The first column depicts acidic lysosomes, the second column depicts Alexa647-labeled Horse nanostructures, the third column represents a 488 nm and 640 nm channel overlay Representative merged images are shown at varying time points from three independent experiments. Scale bars are 10 μm in (A) and 5 μm in (B).
Together, these findings suggest a distinct mechanism of delivery where daunorubicin-loaded Horse DNA nanostructures enter HL-60/ADR cells through the endolysosomal pathway, which may effectively localize the drug in vesicular structures where it can bypass resistance efflux pumps such as MDR1. In addition, daunorubicin-loaded Horse DNA nanostructures provide a high local dose of drug, which may exceed the local capacity of efflux pumps, or these pumps may simply not be able to access drug that is sequestered in the nanostructure. These characteristics of DNA nanostructure-mediated delivery result in an increase in total number of daunorubicin molecules in the cell to cause cell death or disrupt replication. The DNA nanostructures eventually localized to acidic compartments, where the low pH, or enzymatic degradation,[48] could induce drug release to ultimately cause cell death or impair cellular growth.[4]
2.5 Daunorubicin-loaded Horse DNA nanostructures circumvent drug resistance in HL-60/ADR cells
Since DNA origami nanostructures are taken up by cells and improve drug retention, we hypothesized that the Horse nanostructures could effectively circumvent drug resistance in the HL-60/ADR acute myeloid leukemia tumor model, which over-expresses MDR1, using the drug daunorubicin, which is structurally similar to doxorubicin but more widely used to treat adult and pediatric acute leukemia.[27, 29] We first confirmed drug resistance of HL-60/ADR cells by challenging them with doxorubicin and daunorubicin concentrations in the expected range of drug resistance (0–2.0 μM) and evaluated efficacy using the CCK-8 assay, quantified in terms of the relative number of viable cells, which is the total number of viable cells in each treatment normalized to the untreated controls. The relative number of viable HL-60/ADR cells remained at approximately 100% at 24 hours (time point chosen to reflect the elimination half-life of daunorubicin[49]) post doxorubicin addition (Figure S10, Supporting Information) and decreased only slightly with increasing concentrations of daunorubicin (Figure S11A, Supporting Information). Compared to HL-60/ADR cells, daunorubicin at similar concentrations was significantly more effective against parental HL-60 cells at the clinically relevant 1–2 μM range[27, 40, 50] (Figure S11, Supporting Information).
To identify optimal drug loading conditions, Horse DNA nanostructures with varying daunorubicin bp binding ratios were added to HL-60/ADR cells for 24 hours followed by evaluation of efficacy using the CCK-8 assay. While bp binding ratios of 0.46, 0.85, and 1.0 (structure concentration was adjusted to achieve total of 0.1 μM daunorubicin) all induced comparable reductions in the relative number of viable cells, a bp binding ratio of 2.1 was not as effective (Figure S4B, Supporting Information) likely due structure aggregation caused by overloading with daunorubicin (Figure S5B, Supporting Information). We therefore chose to perform functional experiments using a bp binding ratio of ~1.0 or slightly less. For all experiments, the loaded Horse DNA nanostructure concentration was chosen accordingly to achieve target daunorubicin concentrations, and the same nanostructure concentration was then used for unloaded Horse nanostructure controls.
To determine whether Horse DNA nanostructures circumvented resistance mechanisms in HL-60/ADR cells, a range of clinically relevant doses (0.1–1.0 μM) of either free daunorubicin, or daunorubicin loaded in Horse DNA nanostructures were added to HL-60/ADR cells. The relative number of viable cells was determined 24 hours post drug addition via the CCK-8 assay and combined DIC/fluorescence microscopy using the dead cell indicator Sytox Red. Both CCK-8 and fluorescence imaging revealed that delivering daunorubicin via the Horse DNA nanostructures produced significant reductions in the relative number of viable HL-60/ADR cells relative to free daunorubicin (Figures 5A and B). Importantly, a daunorubicin-loaded plasmid M13mp18 DNA allowed for comparable levels of relative growth of HL-60/ADR cells compared to free daunorubicin (Figure S12, Supporting Information). Furthermore, a four-day time course revealed significant reductions in the number of viable HL-60/ADR cells at 24 and 48 hours and marked reductions at 72 and 96 hours were evident when daunorubicin was delivered via loaded Horse DNA nanostructures relative to free daunorubicin as evaluated via flow cytometry (Figure 5C). These results were confirmed by fluorescence imaging, which similarly showed a significant reduction in the relative number of viable HL-60/ADR cells at 24 hours and reductions at 48, 72, and 96 hours (Figure S13, Supporting Information). These findings are consistent with previous work demonstrating that delivering anthracyclines (previous studies used doxorubicin) via DNA origami nanostructures produces enhanced efficacy relative to free drug[18] and can circumvent drug resistance[4] in MCF-7 adenocarcinoma cells.
Figure 5.
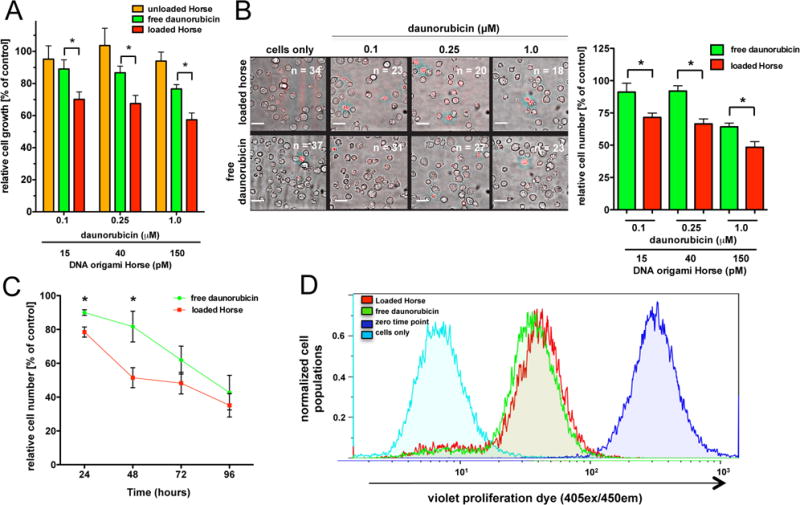
Daunorubicin-loaded Horse DNA nanostructures circumvent drug resistance in HL-60/ADR cells. (A) Varying concentrations of free daunorubicin (0.1, 0.25, and 1 μM), unloaded Horse nanostructures, or daunorubicin-loaded Horse DNA nanostructures (BPBR of ~0.9) were added to HL-60/ADR cells and cell viability was evaluated after 24 hours using the CCK-8 assay. Statistical differences are shown between groups. *, p < 0.05 (0.1 μM, p < 0.05, 95% CI: 0.3840 to 37.52; 0.25 μM, p < 0.05, 95% CI: 0.9718 to 37.36; 1.0 μM, p < 0.05, 95% CI: 0.1861 to 38.19). (B) Varying concentrations (0.1, 0.25, and 1 μM) of free daunorubicin or daunorubicin-loaded Horse nanostructures were added to HL-60/ADR cells for 24 hours and the number of viable cells and relative density (indicated by n = number of viable cells) was evaluated using fluorescence microscopy using the viability dye, Sytox Red, with 561 nm laser excitation. The image shows a representative DIC image overlaid with the Sytox Red fluorescence image. Statistical differences are shown between groups. *, p < 0.05 (0.1 μM, p = 0.0423, 95% CI: 0.9487 to 38.35; 0.25 μM, p = 0.0104, 95% CI: 9.979 to 41.09; 1.0 μM, p = 0.0230, 95% CI: 3.057 to 28.60). (C) Either free daunorubicin or daunorubicin-loaded Horse nanostructures (1 μM daunorubicin) were added to HL-60/ADR cells for the first 24 hour over a four day time course while the cells were washed with PBS at 24 and 72 hours post initial treatment. The relative number of viable cells was determined via counting beads via flow cytometry. The mean number of viable cells ± SEM are shown at 24, 48, 72, and 96 hours post initial nanostructure addition. Statistical differences are shown between groups. *, p < 0.05 (24 hours, p = 0.0151, 95% CI: 3.144 to 19.89; 48 hours, p = 0.0492, 95% CI: 0.1682 to 60.32). (D) Either free daunorubicin or daunorubicin-loaded Horse nanostructures (1 μM daunorubicin) were added to HL-60/ADR cells over a four day time course while the cells were washed with PBS at 24 and 72 hours post initial treatment. The near IR live/dead viability stain and the Violet V450 proliferation dye was added to evaluate proliferation via flow cytometry. Cells negative for Near IR LIVE/DEAD viability stain were gated and considered viable. Proliferation was evaluated via V450 proliferation dye fluorescence represented by a representative histogram overlay at 96 hours from three independent experiments. The quantitative data in A, B, and C were normalized to cells only controls and are presented in triplicate as the mean relative % (or relative number, C) viable cells ± SEM and represent three independent experiments.
Importantly, direct imaging of HL-60/ADR cells revealed that while the number of viable cells was reduced, the percentage of viable cells within the given treatment was comparable between free daunorubicin and daunorubicin-loaded Horse nanostructure treatments (Figure S14A, Supporting Information), suggesting that delivery via Horse DNA nanostructures may not enhance the direct cytotoxicity of daunorubicin. This was confirmed via flow cytometry (Figure S14B, Supporting Information). Therefore, cellular survival did not appear to be the primary mechanism responsible for enhanced efficacy with Horse DNA nanostructure delivery. This is not unexpected since the primary mechanism of action of daunorubicin is to impair cellular growth.[51–53] Therefore, we hypothesized that loaded Horse DNA nanostructures affected cellular proliferation. To test this, HL-60/ADR cells were cultured in the presence of either a continuous treatment of free daunorubicin or daunorubicin loaded Horse DNA nanostructures for four days where cell growth was evaluated by flow cytometry. A shift in violet proliferation fluorescence, indicative of reduced proliferation, was evident in the presence of daunorubicin loaded Horse DNA nanostructures relative to free daunorubicin (Figure 5D), suggesting that the improved drug retention induced by DNA nanostructure delivery indeed enhances the ability of daunorubicin to disrupt proliferation.
The results presented here along with other studies[4, 18, 21] support DNA origami nanostructures as an attractive option for drug delivery, and specifically as a promising approach to circumvent efflux-pump mediated drug resistance. In addition, our results and previous work have shown that DNA origami nanostructures themselves do not induce cytotoxic or significant immunogenic effects in vitro[54, 55] or in vivo.[21] Furthermore, recent findings suggest that nuclease activity and immune recognition in vivo is reduced when either siRNAs are modified with 2′-OMe groups[56, 57] or when DNA nanostructures are enveloped with a PEGylated lipid bilayer,[37] and here we demonstrated a structure design that provided good stability in cell culture conditions over at least 24 hours. These results suggest combined strategies of structure design and modification can yield sufficient structural stability. With respect to other delivery vehicles, the DNA origami approach allows unprecedented control over nanoscale geometry and precise functionalization with nucleotides (i.e. CpG sequences[54] or RNA[58]), a variety of proteins,[59] inorganic nanomaterials,[60, 61] small drug molecules,[4, 18, 21] and combinations thereof, which could provide opportunities to optimize nanostructure design and functionalization for cellular uptake, localization, tunable drug release,[18] and multi-functional drug delivery. It also offers the advantage of easy loading, which is not typical of many other nanoparticle delivery systems. While combination therapies can also be achieved with other nanoparticles, the DNA origami approach enables exquisite control over the absolute quantifiable number and location of modifications, which has recently been shown to impact cellular responses.[62] While significant work remains to be done to enable clinical applications of DNA origami nanostructures, such as understanding distribution, pharmacokinetics, and toxicity limits in vivo, this proof-of-concept work presented here gives strong merit to further optimization of DNA origami nanostructures as a drug delivery vehicle, and demonstrates that DNA origami nanostructures can aid in addressing drug resistance mechanisms in disseminated diseases such as acute myeloid leukemia, for which the outcome is still poor and for which no therapy has been approved in the past 30 years. Lastly, our specific DNA origami structure design enabled good stability in cell culture and rapid fabrication, which could be key advantages for a wide range of applications and gives fundamental insight into design principles for DNA origami-based nanostructures for cellular, in vivo, or clinical use.
3. CONCLUSION
Here we characterized the ability of a DNA origami nanostructure to circumvent efflux-pump mediated resistance mechanisms and directly showed DNA origami-based daunorubicin delivery has potential to treat acute leukemia cells exhibiting MDR. Where free drug delivered in solution enters cells via passive diffusion (Figure 6A), delivery via Horse nanostructures facilitates drug uptake via endocytosis (Figure 6B), which leads to larger amounts of drug entering and ultimately staying in the cell thereby improving efficacy. To our knowledge, this is the first demonstration of delivering the widely used chemotherapeutic drug daunorubicin via a DNA nanostructure carrier and the first demonstration of circumvention of drug resistance via DNA nanostructure delivery in a leukemia model. Importantly, our results revealed circumvention of drug resistance mechanisms at clinically relevant concentration doses of daunorubicin (0.1–1.0 μM). Furthermore, we found that controlling the level of drug loading into the nanostructure was critical to achieving improved efficacy of daunorubicin, specifically enhancing its ability to disrupt proliferation.
Figure 6.
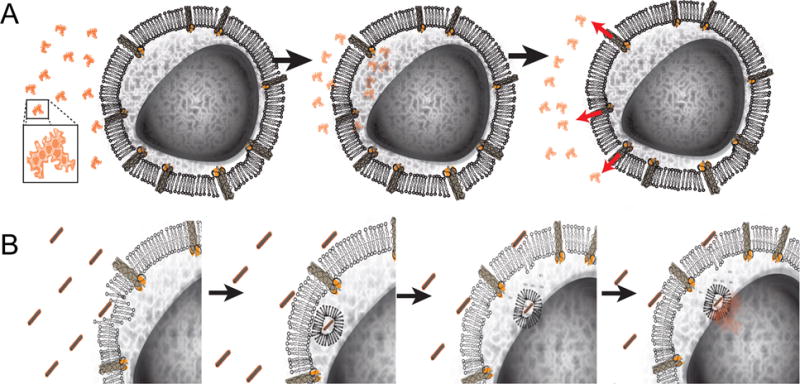
Daunorubicin-loaded Horse DNA nanostructure drug delivery system proposed model. (A) Free drug enters the cell by passive diffusion across the membrane and is quickly expelled from drug resistance HL-60/ADR cells via efflux pumps. (B) In contrast, daunorubicin-loaded Horse DNA nanostructure are endocytosed and enter the endolyosomal pathway, thus circumventing the MRP-1 efflux pumps expressed on the cell surface. The acidic environment of the endolysosome (and possibly lower ion concentrations and the presentence of nucleases) facilitates daunorubicin release that can passively diffuse into the cytoplasm. The large level of free daunorubicin molecules is then available to enter the nucleus to disrupt DNA replication to ultimately impair cellular growth.
4. EXPERIMENTAL SECTION
Cell lines
The HL-60 human acute promyelocytic leukemia cell line, previously described,[63, 64] was obtained from ATCC (Manassas, VA). HL-60/ADR doxorubicin-resistant cells were described previously[65–67] and kindly provided by Dr. Kapil Bhalla (Houston Methodist Research Institute, Houston TX). HL-60/ADR cells were challenged with doxorubicin to confirm resistance. All cells were cultured in complete RPMI 1640 (CellGro, Manassas, VA) with 20% fetal bovine serum (FBS) (Atlas Biologicals, Ft. Collins, CO), 100 U/ml penicillin (Gibco, Life Technologies, Grand Island, NY), 100 μg/ml streptomycin (Gibco) and 2 mM L-glutamine (Gibco) in a humidified atmosphere containing 5% CO2 at 37°C.
Horse nanostructure design and fabrication via scaffolded DNA origami
Scaffolded DNA origami allows for the generation of precise nanostructures in high yield through molecular self-assembly using ~150–200 short (30–50 base) oligonucleotide strands referred to as “staples.” The staples are designed to be piecewise complementary to the scaffold to drive folding into specific two- and three-dimensional nanoscale geometries.[23–25] The Horse nanostructure (~92.5 × ~13.2 × ~11 nm) was designed using the computer-aided design software caDNAno.[32] Staple sequences output from caDNAno were ordered from a commercial vendor (Eurofins Genomics, Huntsville, AL), and the scaffold was produced in our lab as previously described.[24, 68] Structures were made via molecular self-assembly following protocols established in Castro et al.[24] Briefly, A M13mp18 ssDNA scaffold was placed in solution at 100 nM in a buffer containing 5 mM Tris, 5 mM NaCl, 1 mM EDTA, 20 mM MgCl2, and 152 oligonucleotide staple strands each in a 10-fold molar excess to scaffold. The mixture underwent a 17-hour thermal ramp including heating to 65°C followed by slow cooling to 25°C to facilitate molecular self-assembly driven by complementary binding of staples. Rapid fold thermal annealing ramps were held at 52°C following protocols previously described.[39] To confirm and purify well-folded nanostructures, folding reaction products were subjected to 2% agarose gel electrophoresis (0.5× TBE) in the presence of 11 mM MgCl2 followed by excision of bands containing well-folded structures.[24] DNA origami nanostructures were extracted from the excised agarose bands via centrifugation with “freeze ‘N squeeze” purification tubes (BioRAD, Hercules, CA) and visualized via transmission electron microscopy.[24] Alternatively, in order to concentrate Horse DNA nanostructures, unpurified structures were placed in equivolume amounts of 15% PEG 8000 (Sigma Aldrich, St. Louis, MO) and centrifuged for 20 minutes at 20,000 × g to remove excess staple DNA strands.[69] Purified structures were resuspended in 1× PBS (Gibco, Life Technologies) in the presence of 10 mM MgCl2. PEG precipitations were performed two times to eliminate all excess staples in solution. Horse nanostructure concentrations, characterized by UV absorbance measurements on a Nanodrop 2000 (Thermo Scientific, Waltham, MA), were typically ~20 nM after resuspension. To test Horse DNA nanostructure stability in complete RPMI 1640 (described above) in the presence or absence of 20% FBS, Horse DNA nanostructure pellets were resuspended in 200 μl of medium and allowed to incubate in a humidified atmosphere containing 5% CO2 at 37° C for 3, 6, 9, 12, 15, and 24 hrs and evaluated via agarose gel electrophoresis.
Transmission Electron Microscopy (TEM)
TEM grids were prepared as described in Castro et al.[24] Briefly, a 3 μl droplet of purified structures was pipetted onto a copper TEM grid coated with carbon and formvar (Electron Microscopy Sciences, Hatfield, PA) and incubated for three minutes. The solution was then wicked away using filter paper and a 15 μl droplet of 2% Uranyl Formate negative stain was applied to the grid and immediately wicked off using filter paper, followed by application of a 20 μl droplet of 2% Uranyl Formate, which was incubated for 40 seconds prior to wicking off the stain solution and allowing the grids to dry for at least 30 minutes prior to imaging. Horse DNA nanostructures were visualized on a Tecnai G2 BioTWIN transmission electron microscope (FEI, Hillsboro, OR) at an electron acceleration voltage of 80 kV.
Atomic Force Microscopy
AFM images were collected on a Bruker AXS Dimension Icon Atomic Force Microscope in ScanAsyst mode (Bruker Corporation, Billerica, MA). A 5 μl drop of annealed unloaded or daunorubicin-loaded Horse DNA nanostructure was deposited onto the surface of freshly cleaved mica and allowed to incubate for 2 min. The samples were then washed with 1 ml ddH2O and dried with compressed nitrogen. Images were collected using a ScanAsyst-Air silicon nitride cantilever with a measured spring constant of 0.79 N/m and nominal tip radius of 2 nm (Bruker Corporation, Billerica, MA).
Nanostructure Daunorubicin Binding
Daunorubicin HCl (10 mM) (Santa Cruz Biotechnology, Dallas, TX) was resuspended in 1× PBS with 10 mM MgCl2 and added in equivolume amounts to varying concentrations of Horse DNA origami nanostructures. After 24 hours incubation with daunorubicin, the nanostructures were centrifuged at 16,000 × g for 25 minutes yielding a visible red-orange precipitated pellet. The absorbance of the supernatant was measured at 480 nm via a plate reader (SpectraMax M2, Molecular Devices, Sunnyvale, CA) to determine the concentration of remaining daunorubicin, from a known standard curve. The concentration of drug loaded into the DNA origami structures was taken as the difference between the original concentration of daunorubicin and supernatant post centrifugation. We defined the loading of daunorubicin into DNA nanostructures as the base pair binding ratio as described previously (Figure S3A, Supporting Information). The interaction between daunorubicin and Horse nanostructures was also evaluated by gel electrophoresis. In this experiment, daunorubicin fluorescence was visualized on a Typhoon FLA 9500 imaging system (General Electric, Fairfield, CT) at 473 nm followed by an ethidium bromide post stain to visualize Horse DNA nanostructures.
Daunorubicin release from Horse DNA nanostructures
Daunorubicin-loaded Horse DNA nanostructures (40 nM, 300 μM daunorubicin) were incubated with clear RPMI 1640, 20% FBS, pH 7 and PBS, pH 7, 10 mM MgCl2 and incubated at 37° C for 1, 3, 6, and 24 hrs followed by centrifugation (16,000 × g, 10 min, room temperature). In addition, daunorubicin-loaded Horse DNA nanostructures (40 nM, 1 mM daunorubicin) were incubated with various buffers (PBS, pH 7, 10 mM MgCl2; PBS, pH 4; 10 mM MgCl2; PBS pH 7; clear RPMI 1640, no FBS, pH 7; clear RPMI 1640, 20% FBS, pH 7) through a series of four centrifugation (16,000 × g, 10 min, room temperature) and resuspension steps at 1 hr increments at 37° C each time resuspending in 200 μl of fresh buffer to remove drug that had already been released into solution. Supernatants were collected after each centrifugation and daunorubicin absorbance was measured at 480 nm in a Sub-microCell 100 μl cuvette (ThermoElectron, Madison, WI) via a Nanodrop 2000 (Thermo Fisher Scientific).
Confocal Microscopy
HL-60/ADR cells were incubated with 400 nM Lysotracker Green (Life Technologies) for 60 minutes. Cells were centrifuged and re-suspended in 1.5 ml of imaging buffer containing 750 pM Alexa647 Horse DNA origami structures and seeded on 35-mm No. 1.5 glass bottom dishes (MatTek, Ashland, MA). After 60 minutes incubation at 37°C, samples were moved to a live-cell imaging chamber at 37°C of a TI-E inverted research microscope (Nikon Instruments Inc., Melville, NY) controlled by Nikon Elements software and equipped with spinning disk confocal unit (Yokogawa Electric, Tokyo, Japan), 100× objective lens (Plan Apochromat Lambda, NA 1.45, Nikon) and EMCCD camera (iXon DU897 Ultra, Andor Technology, South Windsor, CT). 3D confocal stacks were captured with a step size of 0.5 μm along the z-axis.
Fluorescence Microscopy
Fluorescence microscopy was performed to determine cell viability using the Sytox Red Dead Cell Stain (1:100) (Life Technologies). 24 hours after addition of drug loaded nanostructures, cells were washed and resuspended in imaging buffer (clear RPMI 1640 (Gibco) + 2% penicillin/streptomycin/L-Glutamine). Cells were then imaged on a Nikon TiE microscope (Belmont, CA) under Differential Interference Contrast (DIC) imaging to view cell morphology, and fluorescence imaging with an excitation wavelength of 640 nm to assess presence of the Sytox Red impermeant dye in individual cells. The number of viable cells was counted, and the data are presented as % viable cells relative to controls without the addition of any drug. In addition, Horse nanostructures were labeled with either YOYO-1 intercalating dye (Life Technologies), or Cy3-labeled oligonucleotides (Eurofins Genomics) for fluorescence imaging experiments. YOYO-1 was added to Horse nanostructures at a ratio of 10 base pairs to one YOYO-1 particle and incubated for 6 hours at 37° C followed by centrifugation and removal of excess YOYO-1 in solution and resuspension in PBS with 10 mM MgCl2 buffer. Cy3 oligonucleotides were attached via ssDNA overhangs present on the Horse nanostructure (Figure S1, Supporting Information) in the initial folding process, treating the labeled oligonucleotides as an additional staple. Fluorescently labeled nanostructures were employed in experiments to image Horse nanostructures in solution (YOYO-1) or to visualize cellular uptake and localization (Cy3). Lysotracker Green (Life Technologies) was employed according to manufacturer’s instructions to visualize lysosomal compartments in intracellular localization experiments. In all cases, Horse (drug loaded and unloaded) nanostructures were added to cells at a concentration of 250–750 pM and images were collected using an ANDOR EMCCD camera on an automated Nikon TiE microscope under DIC imaging and fluorescence imaging with 488 nm (daunorubicin, lysotracker green, and YOYO-1) or 561 nm (Cy3) laser excitation.
In Vitro Cell Viability Assay
To evaluate cell viability, the formazan dye cell assay Cell Counting Kit-8 (CCK-8) (Sigma Aldrich, St. Louis, MO) was performed according to manufacturer’s instructions. Briefly, 5 × 10⁴ cells/ml were resuspended in a 96-well plate in complete RPMI 1640 and incubated at 37° and 5% CO2 for 24 hours. Cells were treated with varying concentrations of free daunorubicin (0.1–1.0 μM), daunorubicin-loaded Horse (0.1–1.0 μM drug concentration corresponding to 15–150 pM of DNA nanostructures), and corresponding concentrations of unloaded and loaded double stranded M13mp18 plasmid DNA (Bayou Biolabs, Metairie, LA) and unloaded Horse (15–150 pM), and then placed in wells in quadruplicate and incubated for 24 hours. CCK-8 (10 μl) was added into each well and incubated for 2 hours. Absorbance was measured at 450 nm (SpectraMax M2, Molecular Devices). Raw absorbance values were normalized and presented as % of buffer only controls.
Flow Cytometry
Flow cytometry was performed on a Gallios Flow Cytometer (Beckman Coulter, Brea, CA) to evaluate cell viability and apoptosis as previously described[70, 71] using Near IR LIVE/DEAD viability stain and Alexa647- and Pacific Blue-conjugated Annexin V (Life Technologies). Near IR LIVE/DEAD/Annexin V double negative cells were considered viable. Proliferation was evaluated with the Violet V450 nm Proliferation Dye gated on (Near IR LIVE/DEAD− cells) and the number of cells was measured via counting beads (BD Biosciences, San Jose, CA). Intracellular daunorubicin fluorescence was also determined.
Statistical Analysis
Statistical analysis was conducted using GraphPad Prism software (GraphPad Software, La Jolla, CA). Linear regression statistical analysis was applied to data representing Basepair Binding Ratio as a function of DNA origami solution concentration and daunorubicin solution concentration. Data from multiple treatment groups were analyzed using a one-way ANOVA to determine whether an overall statistical change existed. p represents a parameter that determines statistical significance and is typically set at a 95% significance level. Certain p values were calculated using a Bonferroni post hoc analysis. A two-sided Students t test was used to determine whether a statistically significant difference existed between two datasets where a p value ≤0.05 indicated statistically significant results. Exact p-values (two-sided Students t test) and 95% CIs are reported in the figure legends.
Supplementary Material
Acknowledgments
This work was initiated as part of the OhioMOD 2013 Undergraduate Biomolecular Design Team International Competition and we specifically thank the following members of the team, D. Montjoy and P. Gruenbacher for their overall contribution and R. Frederick for the original design of the Horse structure. P. Halley and C. Lucas contributed equally and are to be considered co-first authors. C. Lucas is a recipient of a National Institutes of Health T32 Award in Oncology Training Fellowship at The Ohio State University Comprehensive Cancer Center, 5T32CA009338-37. We thank Dr. K. Kwak for helpful discussions regarding the research. This work was supported in part by start-up funds provided to Dr. Castro by the Department of Mechanical and Aerospace Engineering at The Ohio State University and in part by a Specialized Center of Research from the Leukemia and Lymphoma Society, P50-CA140158, The National Institutes of Health – National Cancer Institute, R35 CA197734, The D. Warren Brown Foundation, Four Winds Foundation, and The Harry T. Mangurian Jr. Foundation.
ABBREVIATIONS
- P-gp
P-glycoprotein
- MRP1
multi-drug resistance protein-1
- MDR
multi-drug resistance
- APL
acute promyelocytic leukemia
- EPR
enhanced permeability and retention effect
- TEM
transmission electron microscopy
- CI
confidence interval
Footnotes
Supporting Information
Further details regarding characterization of the daunorubicin-loaded Horse DNA nanostructure with respect to drug-loading efficacy in both HL-60 and HL-60/ADR cells and cellular entry are available.
Contributor Information
Patrick D. Halley, Department of Mechanical and Aerospace Engineering, College of Engineering, The Ohio State University, Columbus, OH 43210, United StatesDepartment of Chemical and Biomolecular Engineering, College of Engineering, The Ohio State University, Columbus, OH 43210, United States.
Dr. Christopher R. Lucas, Department of Mechanical and Aerospace Engineering, College of Engineering, The Ohio State University, Columbus, OH 43210, United States.
Emily M. McWilliams, Biomedical Sciences Graduate Program, Department of Internal Medicine, College of Medicine, The Ohio State University, Columbus, OH 43210, United States
Matthew J. Webber, Biophysics Graduate Program, The Ohio State University, Columbus, OH 43210, United States
Randy A. Patton, Department of Mechanical and Aerospace Engineering, College of Engineering, The Ohio State University, Columbus, OH 43210, United States
Prof. Comert Kural, Biophysics Graduate Program, Department of Physics, The Ohio State University, Columbus, OH 43210, United States
Prof. David M. Lucas, Department of Internal Medicine, College of Medicine, College of Pharmacy, The Ohio State University, Columbus, OH 43210, United States
Prof. John C. Byrd, Department of Internal Medicine, College of Medicine, College of Pharmacy, The Ohio State University, Columbus, OH 43210, United States
Prof. Carlos E. Castro, Department of Mechanical and Aerospace Engineering, College of Engineering, Biophysics Graduate Program, The Ohio State University, Columbus, OH 43210, United States.
References
- 1.Michieli M, Damiani D, Ermacora A, Geromin A, Michelutti A, Masolini P, Baccarani M. British journal of haematology. 2000;108(4):703–9. doi: 10.1046/j.1365-2141.2000.01957.x. [DOI] [PubMed] [Google Scholar]
- 2.Kapse-Mistry S, Govender T, Srivastava R, Yergeri M. Frontiers in pharmacology. 2014;5:159. doi: 10.3389/fphar.2014.00159. [DOI] [PMC free article] [PubMed] [Google Scholar]
- 3.Hofmeister CC, Yang X, Pichiorri F, Chen P, Rozewski DM, Johnson AJ, Lee S, Liu Z, Garr CL, Hade EM, Ji J, Schaaf LJ, Benson DM, Jr, Kraut EH, Hicks WJ, Chan KK, Chen CS, Farag SS, Grever MR, Byrd JC, Phelps MA. Journal of clinical oncology: official journal of the American Society of Clinical Oncology. 2011;29(25):3427–34. doi: 10.1200/JCO.2010.32.4962. [DOI] [PMC free article] [PubMed] [Google Scholar]
- 4.Jiang Q, Song C, Nangreave J, Liu X, Lin L, Qiu D, Wang ZG, Zou G, Liang X, Yan H, Ding B. Journal of the American Chemical Society. 2012;134(32):13396–403. doi: 10.1021/ja304263n. [DOI] [PubMed] [Google Scholar]
- 5.Chen BA, Mao PP, Cheng J, Gao F, Xia GH, Xu WL, Shen HL, Ding JH, Gao C, Sun Q, Chen WJ, Chen NN, Liu LJ, Li XM, Wang XM. International journal of nanomedicine. 2010;5:437–44. doi: 10.2147/ijn.s10083. [DOI] [PMC free article] [PubMed] [Google Scholar]
- 6.Wang AZ, Langer R, Farokhzad OC. Annual review of medicine. 2012;63:185–98. doi: 10.1146/annurev-med-040210-162544. [DOI] [PubMed] [Google Scholar]
- 7.Matsumura Y, Maeda H. Cancer research. 1986;46(12 Pt 1):6387–92. [PubMed] [Google Scholar]
- 8.Morris SA, Farrell D, Grodzinski P. Journal of the National Comprehensive Cancer Network: JNCCN. 2014;12(12):1727–33. doi: 10.6004/jnccn.2014.0175. [DOI] [PubMed] [Google Scholar]
- 9.Petros RA, DeSimone JM. Nature reviews Drug discovery. 2010;9(8):615–27. doi: 10.1038/nrd2591. [DOI] [PubMed] [Google Scholar]
- 10.Davis ME, Chen ZG, Shin DM. Nature reviews Drug discovery. 2008;7(9):771–82. doi: 10.1038/nrd2614. [DOI] [PubMed] [Google Scholar]
- 11.Heath JR, Davis ME. Annual review of medicine. 2008;59:251–65. doi: 10.1146/annurev.med.59.061506.185523. [DOI] [PMC free article] [PubMed] [Google Scholar]
- 12.Hofheinz RD, Gnad-Vogt SU, Beyer U, Hochhaus A. Anti-cancer drugs. 2005;16(7):691–707. doi: 10.1097/01.cad.0000167902.53039.5a. [DOI] [PubMed] [Google Scholar]
- 13.Manzoor AA, Lindner LH, Landon CD, Park JY, Simnick AJ, Dreher MR, Das S, Hanna G, Park W, Chilkoti A, Koning GA, ten Hagen TL, Needham D, Dewhirst MW. Cancer research. 2012;72(21):5566–75. doi: 10.1158/0008-5472.CAN-12-1683. [DOI] [PMC free article] [PubMed] [Google Scholar]
- 14.Fassas A, Anagnostopoulos A. Leukemia & lymphoma. 2005;46(6):795–802. doi: 10.1080/10428190500052438. [DOI] [PubMed] [Google Scholar]
- 15.Linko V, Dietz H. Current opinion in biotechnology. 2013;24(4):555–61. doi: 10.1016/j.copbio.2013.02.001. [DOI] [PubMed] [Google Scholar]
- 16.Seeman NC. Nature. 2003;421(6921):427–31. doi: 10.1038/nature01406. [DOI] [PubMed] [Google Scholar]
- 17.Banerjee A, Bhatia D, Saminathan A, Chakraborty S, Kar S, Krishnan Y. Angewandte Chemie. 2013;52(27):6854–7. doi: 10.1002/anie.201302759. [DOI] [PubMed] [Google Scholar]
- 18.Zhao YX, Shaw A, Zeng X, Benson E, Nystrom AM, Hogberg B. ACS nano. 2012;6(10):8684–91. doi: 10.1021/nn3022662. [DOI] [PubMed] [Google Scholar]
- 19.Jungmann R, Avendano MS, Woehrstein JB, Dai M, Shih WM, Yin P. Nature methods. 2014;11(3):313–8. doi: 10.1038/nmeth.2835. [DOI] [PMC free article] [PubMed] [Google Scholar]
- 20.Douglas SM, Bachelet I, Church GM. Science. 2012;335(6070):831–4. doi: 10.1126/science.1214081. [DOI] [PubMed] [Google Scholar]
- 21.Zhang Q, Jiang Q, Li N, Dai L, Liu Q, Song L, Wang J, Li Y, Tian J, Ding B, Du Y. ACS nano. 2014;8(7):6633–43. doi: 10.1021/nn502058j. [DOI] [PubMed] [Google Scholar]
- 22.Kong F, Zhang X, Zhang HB, Qu XM, Chen D, Servos M, Makila E, Salonen J, Santos HA, Hai MT, Weitz DA. Adv Funct Mater. 2015;25(22):3330–3340. doi: 10.1002/Adfm.201500594. [DOI] [Google Scholar]
- 23.Rothemund PW. Nature. 2006;440(7082):297–302. doi: 10.1038/nature04586. [DOI] [PubMed] [Google Scholar]
- 24.Castro CE, Kilchherr F, Kim DN, Shiao EL, Wauer T, Wortmann P, Bathe M, Dietz H. Nature methods. 2011;8(3):221–9. doi: 10.1038/nmeth.1570. [DOI] [PubMed] [Google Scholar]
- 25.Douglas SM, Dietz H, Liedl T, Hogberg B, Graf F, Shih WM. Nature. 2009;459(7245):414–8. doi: 10.1038/nature08016. [DOI] [PMC free article] [PubMed] [Google Scholar]
- 26.Chang M, Yang CS, Huang DM. ACS nano. 2011;5(8):6156–63. doi: 10.1021/nn200693a. [DOI] [PubMed] [Google Scholar]
- 27.Lowenberg B, Ossenkoppele GJ, van Putten W, Schouten HC, Graux C, Ferrant A, Sonneveld P, Maertens J, Jongen-Lavrencic M, von Lilienfeld-Toal M, Biemond BJ, Vellenga E, van Marwijk Kooy M, Verdonck LF, Beck J, Dohner H, Gratwohl A, Pabst T, Verhoef G, Dutch-Belgian Cooperative Trial Group for, H.-O.; German, A. M. L. S. G.; Swiss Group for Clinical Cancer Research Collaborative, G. The New England journal of medicine. 2009;361(13):1235–48. doi: 10.1056/NEJMoa0901409. [DOI] [PubMed] [Google Scholar]
- 28.Thakor AS, Gambhir SS. CA: a cancer journal for clinicians. 2013;63(6):395–418. doi: 10.3322/caac.21199. [DOI] [PubMed] [Google Scholar]
- 29.Lancet JE, Cortes JE, Hogge DE, Tallman MS, Kovacsovics TJ, Damon LE, Komrokji R, Solomon SR, Kolitz JE, Cooper M, Yeager AM, Louie AC, Feldman EJ. Blood. 2014;123(21):3239–46. doi: 10.1182/blood-2013-12-540971. [DOI] [PMC free article] [PubMed] [Google Scholar]
- 30.Kraft JC, Freeling JP, Wang Z, Ho RJ. Journal of pharmaceutical sciences. 2014;103(1):29–52. doi: 10.1002/jps.23773. [DOI] [PMC free article] [PubMed] [Google Scholar]
- 31.Shang L, Nienhaus K, Nienhaus GU. Journal of nanobiotechnology. 2014;12:5. doi: 10.1186/1477-3155-12-5. [DOI] [PMC free article] [PubMed] [Google Scholar]
- 32.Douglas SM, Marblestone AH, Teerapittayanon S, Vazquez A, Church GM, Shih WM. Nucleic acids research. 2009;37(15):5001–6. doi: 10.1093/nar/gkp436. [DOI] [PMC free article] [PubMed] [Google Scholar]
- 33.Walkey CD, Olsen JB, Guo H, Emili A, Chan WC. Journal of the American Chemical Society. 2012;134(4):2139–47. doi: 10.1021/ja2084338. [DOI] [PubMed] [Google Scholar]
- 34.Wang T, Hartner WC, Gillespie JW, Praveen KP, Yang S, Mei LA, Petrenko VA, Torchilin VP. Nanomedicine: nanotechnology, biology, and medicine. 2014;10(2):421–30. doi: 10.1016/j.nano.2013.08.009. [DOI] [PMC free article] [PubMed] [Google Scholar]
- 35.Xu A, Yao M, Xu G, Ying J, Ma W, Li B, Jin Y. International journal of nanomedicine. 2012;7:3547–54. doi: 10.2147/IJN.S32188. [DOI] [PMC free article] [PubMed] [Google Scholar]
- 36.Hahn J, Wickham SF, Shih WM, Perrault SD. ACS nano. 2014;8(9):8765–75. doi: 10.1021/nn503513p. [DOI] [PMC free article] [PubMed] [Google Scholar]
- 37.Perrault SD, Shih WM. ACS nano. 2014;8(5):5132–40. doi: 10.1021/nn5011914. [DOI] [PMC free article] [PubMed] [Google Scholar]
- 38.Ke Y, Douglas SM, Liu M, Sharma J, Cheng A, Leung A, Liu Y, Shih WM, Yan H. Journal of the American Chemical Society. 2009;131(43):15903–8. doi: 10.1021/ja906381y. [DOI] [PMC free article] [PubMed] [Google Scholar]
- 39.Sobczak JP, Martin TG, Gerling T, Dietz H. Science. 2012;338(6113):1458–61. doi: 10.1126/science.1229919. [DOI] [PubMed] [Google Scholar]
- 40.Dombret H, Gardin C. The New England journal of medicine. 2009;361(13):1301–3. doi: 10.1056/NEJMe0905678. [DOI] [PubMed] [Google Scholar]
- 41.Martin SR. Biopolymers. 1980;19(3):713–21. doi: 10.1002/bip.1980.360190318. [DOI] [PubMed] [Google Scholar]
- 42.Wilhelm M, Mukherjee A, Bouvier B, Zakrzewska K, Hynes JT, Lavery R. Journal of the American Chemical Society. 2012;134(20):8588–96. doi: 10.1021/ja301649k. [DOI] [PubMed] [Google Scholar]
- 43.Cashman DJ, Scarsdale JN, Kellogg GE. Nucleic acids research. 2003;31(15):4410–6. doi: 10.1093/nar/gkg645. [DOI] [PMC free article] [PubMed] [Google Scholar]
- 44.Gallois L, Fiallo M, Garnier-Suillerot A. Biochimica et biophysica acta. 1998;1370(1):31–40. doi: 10.1016/s0005-2736(97)00241-1. [DOI] [PubMed] [Google Scholar]
- 45.Modi S, M GS, Goswami D, Gupta GD, Mayor S, Krishnan Y. Nature nanotechnology. 2009;4(5):325–30. doi: 10.1038/nnano.2009.83. [DOI] [PubMed] [Google Scholar]
- 46.Modi S, Nizak C, Surana S, Halder S, Krishnan Y. Nature nanotechnology. 2013;8(6):459–67. doi: 10.1038/nnano.2013.92. [DOI] [PubMed] [Google Scholar]
- 47.Okholm AH, Nielsen JS, Vinther M, Sorensen RS, Schaffert D, Kjems J. Methods. 2014;67(2):193–7. doi: 10.1016/j.ymeth.2014.01.013. [DOI] [PubMed] [Google Scholar]
- 48.Lee JB, Roh YH, Um SH, Funabashi H, Cheng W, Cha JJ, Kiatwuthinon P, Muller DA, Luo D. Nat Nanotechnol. 2009;4:430. doi: 10.1038/nnano.2009.93. [DOI] [PMC free article] [PubMed] [Google Scholar]
- 49.Krogh-Madsen M, Bender B, Jensen MK, Nielsen OJ, Friberg LE, Honore PH. Cancer chemotherapy and pharmacology. 2012;69(5):1155–63. doi: 10.1007/s00280-011-1800-z. [DOI] [PubMed] [Google Scholar]
- 50.Kokenberg E, van der Steuijt K, Lowenberg B, Nooter K, Sonneveld P. Haematology and blood transfusion. 1987;30:283–7. doi: 10.1007/978-3-642-71213-5_42. [DOI] [PubMed] [Google Scholar]
- 51.Momparler RL, Karon M, Siegel SE, Avila F. Cancer research. 1976;36(8):2891–5. [PubMed] [Google Scholar]
- 52.Calendi E, Dimarco A, Reggiani M, Scarpinato B, Valentini L. Biochimica et biophysica acta. 1965;103:25–49. doi: 10.1016/0005-2787(65)90539-3. [DOI] [PubMed] [Google Scholar]
- 53.Di Marco A. Acta geneticae medicae et gemellologiae. 1968;17(1):102–21. doi: 10.1017/s1120962300026330. [DOI] [PubMed] [Google Scholar]
- 54.Schuller VJ, Heidegger S, Sandholzer N, Nickels PC, Suhartha NA, Endres S, Bourquin C, Liedl T. ACS nano. 2011;5(12):9696–702. doi: 10.1021/nn203161y. [DOI] [PubMed] [Google Scholar]
- 55.Li J, Pei H, Zhu B, Liang L, Wei M, He Y, Chen N, Li D, Huang Q, Fan C. ACS nano. 2011;5(11):8783–9. doi: 10.1021/nn202774x. [DOI] [PubMed] [Google Scholar]
- 56.Soutschek J, Akinc A, Bramlage B, Charisse K, Constien R, Donoghue M, Elbashir S, Geick A, Hadwiger P, Harborth J, John M, Kesavan V, Lavine G, Pandey RK, Racie T, Rajeev KG, Rohl I, Toudjarska I, Wang G, Wuschko S, Bumcrot D, Koteliansky V, Limmer S, Manoharan M, Vornlocher HP. Nature. 2004;432(7014):173–8. doi: 10.1038/nature03121. [DOI] [PubMed] [Google Scholar]
- 57.Lee H, Lytton-Jean AK, Chen Y, Love KT, Park AI, Karagiannis ED, Sehgal A, Querbes W, Zurenko CS, Jayaraman M, Peng CG, Charisse K, Borodovsky A, Manoharan M, Donahoe JS, Truelove J, Nahrendorf M, Langer R, Anderson DG. Nature nanotechnology. 2012;7(6):389–93. doi: 10.1038/nnano.2012.73. [DOI] [PMC free article] [PubMed] [Google Scholar]
- 58.Endo M, Yamamoto S, Tatsumi K, Emura T, Hidaka K, Sugiyama H. Chemical communications. 2013;49(28):2879–81. doi: 10.1039/c3cc38804b. [DOI] [PubMed] [Google Scholar]
- 59.Sacca B, Meyer R, Erkelenz M, Kiko K, Arndt A, Schroeder H, Rabe KS, Niemeyer CM. Angewandte Chemie. 2010;49(49):9378–83. doi: 10.1002/anie.201005931. [DOI] [PubMed] [Google Scholar]
- 60.Schreiber R, Do J, Roller EM, Zhang T, Schuller VJ, Nickels PC, Feldmann J, Liedl T. Nature nanotechnology. 2014;9(1):74–8. doi: 10.1038/nnano.2013.253. [DOI] [PubMed] [Google Scholar]
- 61.Schreiber R, Kempter S, Holler S, Schuller V, Schiffels D, Simmel SS, Nickels PC, Liedl T. Small. 2011;7(13):1795–9. doi: 10.1002/smll.201100465. [DOI] [PubMed] [Google Scholar]
- 62.Shaw A, Lundin V, Petrova E, Fordos F, Benson E, Al-Amin A, Herland A, Blokzijl A, Hogberg B, Teixeira AI. Nature methods. 2014;11(8):841–6. doi: 10.1038/nmeth.3025. [DOI] [PubMed] [Google Scholar]
- 63.Collins SJ, Gallo RC, Gallagher RE. Nature. 1977;270(5635):347–9. doi: 10.1038/270347a0. [DOI] [PubMed] [Google Scholar]
- 64.Gallagher R, Collins S, Trujillo J, McCredie K, Ahearn M, Tsai S, Metzgar R, Aulakh G, Ting R, Ruscetti F, Gallo R. Blood. 1979;54(3):713–33. [PubMed] [Google Scholar]
- 65.Marquardt D, McCrone S, Center MS. Cancer research. 1990;50(5):1426–30. [PubMed] [Google Scholar]
- 66.Perkins C, Kim CN, Fang G, Bhalla KN. Blood. 2000;95(3):1014–22. [PubMed] [Google Scholar]
- 67.Huang Y, Ibrado AM, Reed JC, Bullock G, Ray S, Tang C, Bhalla K. Leukemia. 1997;11(2):253–7. doi: 10.1038/sj.leu.2400557. [DOI] [PubMed] [Google Scholar]
- 68.Zhou L, Marras AE, Su HJ, Castro CE. ACS nano. 2014;8(1):27–34. doi: 10.1021/nn405408g. [DOI] [PubMed] [Google Scholar]
- 69.Stahl E, Martin TG, Praetorius F, Dietz H. Angewandte Chemie. 2014;53(47):12735–40. doi: 10.1002/anie.201405991. [DOI] [PMC free article] [PubMed] [Google Scholar]
- 70.Zhao X, Lapalombella R, Joshi T, Cheney C, Gowda A, Hayden-Ledbetter MS, Baum PR, Lin TS, Jarjoura D, Lehman A, Kussewitt D, Lee RJ, Caligiuri MA, Tridandapani S, Muthusamy N, Byrd JC. Blood. 2007;110(7):2569–77. doi: 10.1182/blood-2006-12-062927. [DOI] [PMC free article] [PubMed] [Google Scholar]
- 71.Rafiq S, Butchar JP, Cheney C, Mo X, Trotta R, Caligiuri M, Jarjoura D, Tridandapani S, Muthusamy N, Byrd JC. Journal of immunology. 2013;190(6):2702–11. doi: 10.4049/jimmunol.1202588. [DOI] [PMC free article] [PubMed] [Google Scholar]
Associated Data
This section collects any data citations, data availability statements, or supplementary materials included in this article.