Abstract
Vinyl chloride (VC) is a ubiquitous environmental contaminant for which human risk is incompletely understood. We have previously reported that high occupational exposure to VC directly caused liver damage in humans. However, whether VC may also potentiate liver injury from other causes is not known. C57Bl/6J mice were administered chloroethanol (CE), a major metabolite of VC, and lipopolysaccharide (LPS) 24 h after CE. Samples were harvested for determination of liver damage, inflammation, and changes in carbohydrate and lipid metabolism. In mice, CE exposure alone caused no detectable liver damage. LPS exposure caused inflammatory liver damage, oxidative stress, lipid accumulation, and glycogen depletion; the effect of all of these variables was potentiated by CE pre-exposure. In vitro experiments suggest that VC metabolite chloroacetaldehyde (CAA) directly damages mitochondria, which may explain the sensitization effect observed in vivo. Moreover, co-exposure of cells to CAA and TNFα caused increased cell death, supporting the hypothesis of sensitization by VC metabolites. Taken together, these data demonstrate that exposure to VC/metabolites at levels that are not overtly hepatotoxic can potentiate liver injury caused by another hepatotoxicant. This serves as proof-of-concept that VC hepatotoxicity may be modified by an additional metabolic stress such as endotoxemia, which commonly occurs in acute (eg, sepsis) and chronic (eg, NAFLD) diseases.
Keywords: PVC, vinyl chloride metabolite, toxicant-associated steatohepatitis, TASH, hepatotoxicity.
Vinyl chloride (VC) is an organochlorine used to create the polymer, polyvinyl chloride. VC is ranked as the 4th most important toxic chemical on the Hazardous Substance Priority List (U.S. Department of Health and Human Services, 2006). In addition to its direct production—annually 27 million metric tons (Sass et al., 2005), VC is a degradation product at many Superfund sites, and is present in landfill leachate and groundwater near military installations (Agency for Toxic Substances and Disease Registry, 2014; Bove et al., 2014a, b; Ruckart et al., 2013). Occupational exposure is estimated to encompass more than 80 000 American workers (Kielhorn et al., 2000). VC gas readily suffuses from water and is found in significant concentrations in the ambient air surrounding manufacturing complexes (McKone and Knezovich, 1991; U.S. Environmental Protection Agency (U.S.EPA), 2000). Therefore, exposure to VC is widespread and potentially affects a large portion of the population.
VC is a known human hepatotoxicant that directly causes a spectrum of both benign and malignant liver diseases, including toxicant associated steatohepatitis (TASH; Wahlang et al., 2013), hepatocellular carcinoma, and hemangiosarcoma (Cave et al., 2012). The mechanisms by which VC and/or its metabolites mediate these effects are incompletely understood and critical for risk assessment for both occupational and environmental exposure. Previous studies have investigated the independent effect of VC exposure on hepatic function, not considering additional factors that may contribute to injury, even at concentrations of VC that are not overtly hepatotoxic, per se (Cave et al., 2010; Sherman, 2009). In this context, better understanding of the impact of underlying disorders or other insults that may modify risk is critical.
In the liver, the concept of multiple factors contributing to disease is well known. Indeed, liver disease is not based solely on one factor, but rather is modified by other mitigating conditions, such as genetic or environmental factors. Numerous studies have now established that physiological/biochemical changes to the liver that are pathologically inconsequential can become hepatotoxic in response to another agent. This concept that liver injury is potentiated by additional factors has been exemplified in alcoholic (Beier et al., 2011) and nonalcoholic fatty liver diseases (Beier et al., 2008; Day and James, 1998). For example, Yang et al. (1997) demonstrated that fatty livers are sensitive to hepatotoxicity caused by the injection of bacterial lipopolysaccharide (LPS).
We hypothesize that concentrations of VC/metabolite that are not overtly hepatotoxic may serve as a potentiating factor in liver disease. The rationale for this hypothesis is that VC shares similar metabolic pathways in liver to other hepatotoxicants that are known to sensitize the liver, such as ethanol (Bolt, 2005). Specifically, VC is metabolized via CYP2E1 and aldehyde dehydrogenase-dependent pathways to produce the corresponding alcohol (chloroethanol, CE) and aldehyde (chloroacetaldehyde, CAA); indeed, previous studies have suggested that VC oxidation is a bioactivation process (Bruggemann et al., 2006). The purpose of the current proof-of-concept study was to test the hypothesis that experimental VC metabolite CE at subhepatotoxic concentrations sensitize the liver to hepatotoxicity caused by an additional factor (LPS) in mice.
METHODS
Animals and treatments
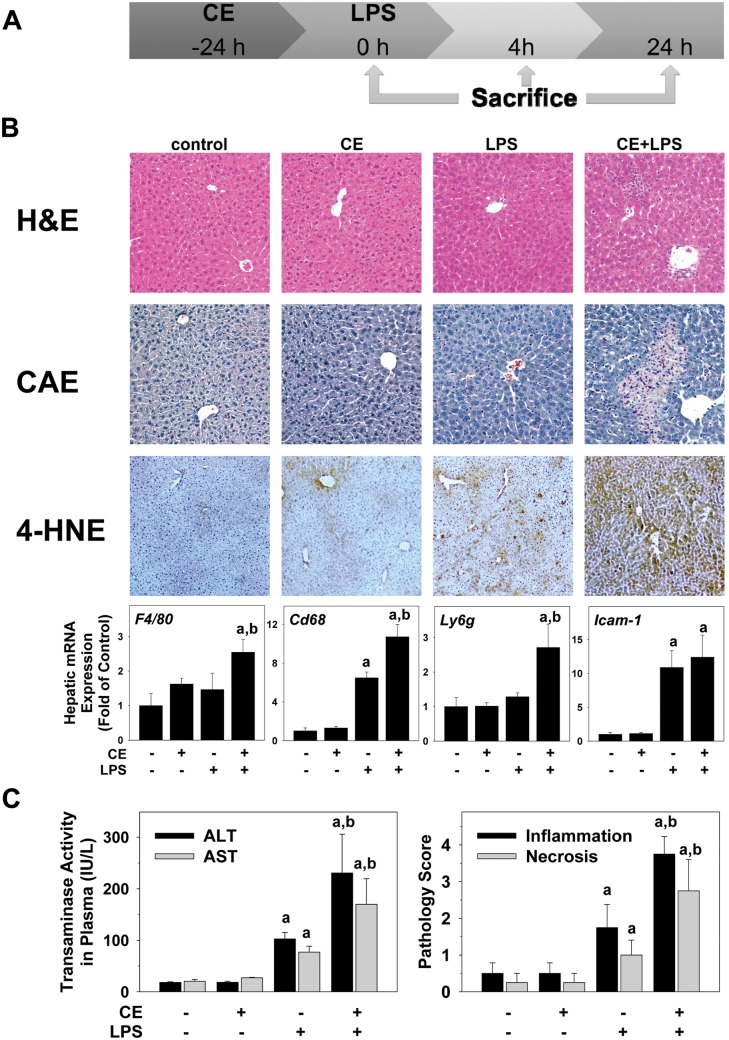
Eight-week-old male C57BL/6J mice from Jackson Laboratory (Bar Harbor, Maine) were housed in a pathogen-free barrier facility accredited by the Association for Assessment and Accreditation of Laboratory Animal Care, and procedures were approved by the local Institutional Animal Care and Use Committee. Animals were administered CE (50 mg/kg i.g.) or vehicle (saline) and injected with LPS (from Escherichia coli 055:B5, #L2880, lot 075K4038; Sigma, St. Louis Missouri; 10 mg/kg i.p., 600 000 EU/mg) or vehicle (saline) 24 h later (timeline: Figure 1A). The concentration of CE was determined by others to not directly cause liver damage (Kaphalia and Ansari, 1989) and was validated in pilot experiments; based on the fraction of VC that is estimated to be metabolized to CE and its apparent volume of distribution in rodents, this concentration equates to ∼100 ppm exposure as bolus VC. The LPS concentration for this lot was selected by range finding studies to cause low to moderate liver injury and has been published previously (Arteel et al., 2008; Beier et al., 2008, 2009; von Montfort et al., 2008). Animals were anesthetized with ketamine/xylazine (100/15 mg/kg, i.m.) 0–24 h after LPS injection (timeline: Figure 1A). Blood was collected from the vena cava just prior to kill (exsanguination), and citrated plasma was stored at −80°C for further analysis. Portions of liver tissue were snap-frozen in liquid nitrogen, embedded in frozen specimen medium (Sakura Finetek, Torrance, California), or were fixed in 10% neutral buffered formalin.
FIG. 1.
CE exacerbates LPS-induced liver injury in mice. A, Timeline of the animal experiment. B, Representative photomicrographs of H&E (general pathology), CAE (neutrophils, purple), and 4-HNE (index of oxidative stress, brown) stains at a 200× magnification are shown. Real-Time RT-PCR of markers for inflammatory cells was performed. C, ALT/AST were determined in plasma samples collected 24 h after injection of LPS. Pathology was scored as described in “Methods” section. a, P < .05 compared with the absence of LPS; b, P < .05 compared with the absence of CE.
Isolation of primary hepatocytes
Hepatocytes were isolated from livers of anesthetized C57Bl/6J mice by collagenase digestion as previously described (Herman et al., 1988).
Cell culture, cell viability, extracellular flux, and quantitative cell analysis
HepG2 cells (ATCC # HB-8065, American Type Culture Collection, Manassas, Virginia) were maintained in Dulbecco’s modified Eagle’s medium (DMEM) with phenol red, supplemented with 10% heat-inactivated fetal bovine serum, 20 µM l-glutamine, 100 IU/ml penicillin, 10 µg/ml streptomycin. Cells were grown in 75-cm2 cell culture flasks at 37°C with 5% CO2 in a humidified incubator. HepG2 cells in 96-well microtiter cell culture plates were pre-incubated for 30 min with CAA (0–20 μM), followed by an incubation of CAA in the absence and presence of 17.5 ng/ml TNFα for an additional 24 h. Cytotoxicity was determined as described previously (Anwar-Mohamed and El-Kadi, 2008). In brief, the treatment medium was removed and replaced with cell culture medium containing 1.2 mM of 3-(4,5-dimethylthiazol-2-yl)-2,5-diphenyltetrazolium bromide (MTT; Sigma). After 2 h of incubation, the formed crystals were dissolved in isopropanol. The intensity of the color in each well was measured at a wavelength of 570 nm using the Bio-Tek Synergy HT microplate reader (Bio-Tek Instruments, Winooski, Vermont).
Oxygen consumption rates (OCRs) and extracellular acidification rates were measured using an XF96 Extracellular Flux Analyzer (Seahorse Biosciences, Billerica, Massachusetts; Schmidt et al., 2013). Primary hepatocytes, isolated from C57Bl/6J mice, or HepG2 cells (American Type Culture Collection) were plated at 10 000 cells per well and incubated for 24 h in DMEM (Gibco, Thermo Fisher Scientific, Grand Island, New York). Cells were then incubated with graded concentrations of CAA from 0 to 200 μM. One hour prior to the commencement of measurements the media were changed to unbuffered DMEM (Seahorse Biosciences) containing the same concentrations of CAA. For quantitative cell-based high-content screening, CAA-containing media were removed and media containing: Hoechst 33342, TMRM, and TOTO-3 dyes were added to the wells. Following a 1-h incubation with the dyes, the plate was placed into the Cellomics Array Scan VTI HCS reader and relative fluorescence units (RFU) were analyzed, as described previously (Ding et al., 2014). Following a 1-h incubation of cells with CAA, ATP was determined in cell lysates using a commercially available kit (Sigma), or total GSH was determined spectrophotometrically using the technique of Griffith (1980). BODIPY-IAM labeling of proteins were performed and levels of reactive protein thiols were quantified as described previously (Hill et al., 2009b).
Biochemical analyses, histology, and immunohistochemistry
Plasma ALT and AST were determined using standard kits (Thermo Fisher Scientific, Middletown, Virginia). Livers were stained with Hematoxylin & Eosin (H&E), and periodic acid-Schiff reagent (PAS). Neutrophil accumulation was assessed by chloroacetate esterase stain (CAE; Sigma). Pathology was scored (steatosis, inflammation, necrosis) in a blinded manner by a trained pathologist as described elsewhere (Nanji et al., 1989); the number of necrotic or inflammatory foci (involving >5 cells) was determined in 10 400× fields. Apoptosis was detected via terminal deoxynucleotidyl transferase biotin-dUTP nick end labeling (TUNEL; Millipore, Billerica, Massachusetts). Livers were stained with Oil Red O as described previously (Beier et al., 2009). TUNEL-positive cells (hepatocytes and nonparenchymal cells, NPCs) were counted using Metamorph Image Analysis Software (Molecular Devices, Sunnyvale, California) and are expressed as positive cells per 1000 hepatocytes. Hepatic lipids (TG and NEFA) were extracted and determined as described previously (Bligh and Dyer, 1959; Kaiser et al., 2009). Total cholesterol, high-density lipoprotein (HDL), low-density lipoprotein (LDL), very-low-density lipoprotein (VLDL), triglycerides (TG), and glucose were determined by the Piccolo Lipid Panel Plus Reagent Disc, used with the Piccolo Xpress Chemistry Analyzer (Abaxis, Inc., Union City, California), according to the manufacturer’s instructions.
Immunoblots
Liver samples were homogenized in RIPA buffer (Beier et al., 2006), containing protease and phosphatase inhibitor cocktails (Sigma). Samples were loaded onto SDS-polyacrylamide gels (Invitrogen, Thermo Fisher Scientific), followed by electrophoresis and Western blotting onto PVDF membranes (Hybond P, GE Healthcare Bio-Sciences, Pittsburgh, Pennsylvania). Primary antibodies against phosphorylated and total mTOR, p70S6K, 4EBP1, AKT, and AMP-activated protein kinase (AMPK) (Cell Signaling Technology, Beverly, Massachusetts) were used. Densitometric analysis was performed using UN-SCAN-IT gel (Silk Scientific Inc., Orem, Utah) software.
RNA isolation and real-time RT-PCR
RNA was extracted immediately following sacrifice from fresh liver samples using RNA Stat60 and chloroform. Real-time RT-PCR was performed using a StepOne real-time PCR system (Thermo Fisher Scientific). Primers and probes were ordered as commercially available kits (Thermo Fisher Scientific). The comparative CT method was used to determine fold differences between the target genes and an endogenous reference (18S).
Statistical analyses
Results are reported as means ± SEM (n = 4–8) and were analyzed using SigmaPlot 11.0 (Systat Software, Inc., San Jose, California). ANOVA with Bonferroni’s post hoc test (for parametric data) or Mann-Whitney Rank sum test (for nonparametric data) were used for the determination of statistical significance among treatment groups, as appropriate. A P value <.05 was selected before the study as the level of significance.
RESULTS
Effect of CE on Liver Damage Caused by LPS
Figure 1 shows representative photomicrographs depicting liver pathology (H&E stain) and neutrophil accumulation (CAE) 24 h after injection with LPS. No pathological changes were observed in liver tissue in the untreated or CE groups. LPS at this concentration caused no gross morphological changes to the liver (Figure 1B, H&E), but increased the number of infiltrating neutrophils (Figure 1B, CAE). The combination of CE and LPS increased hepatic damage, with necro-inflammatory foci now detectable. CE also significantly enhanced the effect of LPS on the recruitment of neutrophils to the liver (Figure 1B). Moreover, hepatic expression of markers for inflammatory cells was analyzed. Hepatic gene expression levels of macrophage (F4/80), monocyte (Cd68), and neutrophil (Ly6g) markers were significantly increased in the CE + LPS group (Figure 1B, lower panel). Whereas the expression of intercellular adhesion molecule 1 Icam-1 was increased with LPS, CE did not alter this effect (Figure 1B, lower panel). Neutrophils have been shown to induce oxidative stress and hepatocellular damage by generating reactive oxygen species (ROS) and cytotoxic mediators (Jaeschke, 1995). As an index of oxidative stress, the effect of CE pre-exposure on the accumulation of 4-hydroxynonenal (4-HNE) protein adducts was determined (Figure 1B). While having only a slight effect in the absence of LPS, the intensity and extent of positive staining, suggesting accumulation of 4-HNE adducts in the liver, was greatly enhanced by CE (Figure 1B). Plasma levels of transaminases and pathology scores were within normal ranges in naïve mice (Figure 1C); CE alone did not significantly alter these values. LPS injection alone significantly increased pathology scores and the levels of ALT and AST released into the plasma 24 h after injection. CE significantly enhanced these effects caused by LPS (Figure 1C).
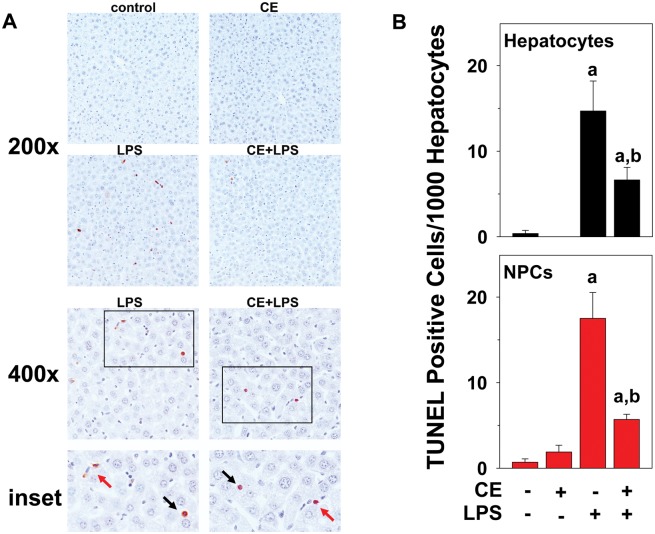
Moreover, livers were stained for TUNEL-positive cells as an index of apoptosis (Figure 2). Few TUNEL-positive cells were observed in liver tissue in untreated animals or after injection of CE alone. As expected, LPS alone robustly increased TUNEL-positive cells (both hepatocytes and NPCs) in liver (14.7 ± 3.5 hepatocytes and 17.5 ± 3.0 NPCs, Figure 2). In line with these results, LPS exposure also increased cleaved caspase 3 4.1 ± 0.4-fold over control, as determined by Western blot. CE, however, significantly blunted the number of TUNEL-positive cells caused by LPS (6.6 ± 1.5 hepatocytes and 5.7 ± 0.6 NPCs, Figure 2), despite having no effect on LPS-induced caspase 3 cleavage (5.4 ± 0.4-fold over control). LPS-induced apoptosis was equally inhibited by CE both, in hepatocytes and NPCs (Figure 2B).
FIG. 2.
CE decreases LPS-induced apoptosis of mouse liver cells. A, Representative photomicrographs of TUNEL stains at 200×, 400×, and 600× magnification for inset are shown. Both hepatocytes (black arrows) and NPCs (red arrows) stained positive for TUNEL. B, TUNEL stain was quantitated by counting hepatocytes (black, upper panel) and NPCs (red, lower panel) as described in “Methods” section, and were expressed as TUNEL positive cells per 1000 hepatocytes. a, P < .05 compared with the absence of LPS; b, P < .05 compared with the absence of CE.
Effect of CE on the Induction of Gene Expression Caused by LPS
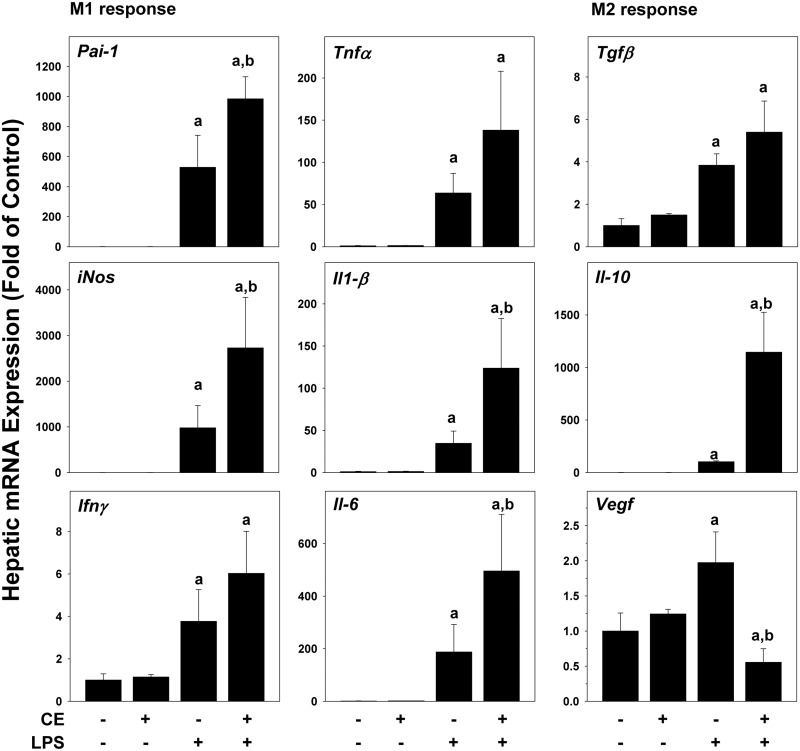
Intraperitoneal LPS injection causes transient inflammatory liver injury at this concentration (Beier et al., 2008, 2009). As CE-enhanced recruitment of inflammatory cells caused by LPS (Figure 1), its effect on hepatic expression of key pro-inflammatory and anti-inflammatory genes was determined at the 4-h time-point (Figure 3). CE alone had no effect on these markers. LPS alone significantly induced the hepatic expression for all of these variables, at the 4-h time-point (Figure 3) and was still elevated after 24 h (data not shown). CE strongly increased hepatic mRNA expression of key genes involved in the M1 response (Pai-1, Tnfα, iNos, Il-1β, Infγ and Il-6) at 4 (Figure 3) and 24 h (data not shown) after LPS. For genes of the M2 response (Tgfβ, Il-10, Vegf), while CE did not alter the LPS effect for Tgfβ, it blunted expression of Vegf, but further increased Il-10 expression at the 4-h time-point. Moreover, hepatic expression of α-sma, as a marker of stellate cell activation was examined. However, no changes in α-sma expression were observed in any of the groups (data not shown).
FIG. 3.
CE enhances LPS-induced inflammatory response in mouse liver. Real-Time RT-PCR for markers of the inflammatory response was performed. a, P < .05 compared with the absence of LPS; b, P < .05 compared with the absence of CE.
Effect of CE on Hepatic Carbohydrate and Lipid Metabolism
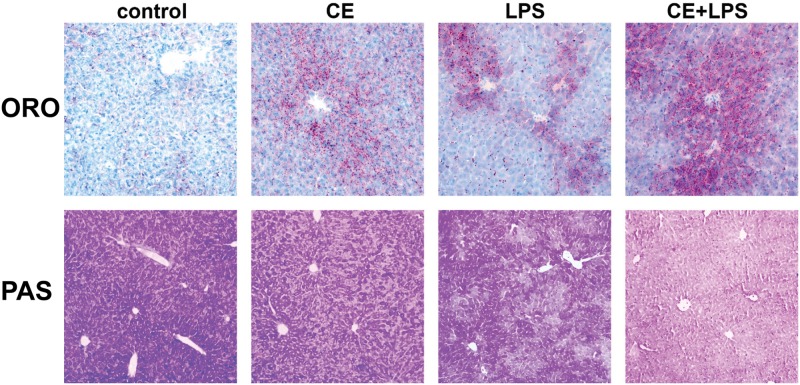
As mentioned in the Introduction, pathologically inconsequential changes (eg, steatosis) can enhance hepatotoxicity in response to an additional agent. Therefore, lipid accumulation in the liver (ORO) and glycogen storage (PAS) was determined in these samples. As shown by ORO, CE caused a slight but noticeable increase in lipid droplets in livers of mice (Figure 4). This was reflected in hepatic TG and hepatic nonesterified fatty acids (NEFAs) at the 0 h time-point (time-point of LPS injection, Figure 1A: timeline; Table 1: data). LPS alone also significantly increased lipid accumulation, and CE enhanced LPS-induced steatosis. Indeed, hepatic TGs and NEFAs were increased 24 h after LPS and hepatic NEFAs were further increased by CE (Table 1). The increase in hepatic NEFAs with CE and LPS was paralleled by an increase in plasma TG, cholesterol (Chol), HDL, LDL, and VLDL (Table 1). Interestingly, whereas both CE and LPS slightly depleted unfasted glycogen reserves in the liver, their combined effect was an almost complete, panlobular depletion of these stores in the liver at the 4-h time-point (Figure 4, PAS).
FIG. 4.
CE causes hepatic lipid accumulation and glycogen depletion in mouse liver. Representative photomicrographs of ORO stains (red, 200× magnification) for neutral lipids and PAS stains (dark purple, 100× magnification) for glycogen are shown.
TABLE 1.
Effect of CE and LPS on Plasma Variables and Hepatic Lipids in Mice
| Control | CE | LPS | CE + LPS | |
|---|---|---|---|---|
| PLASMA (mg/dl) t = 24 h | ||||
| Glu | 185 ± 20 | 249 ± 40 | 144 ± 30a | 139 ± 12a |
| Chol | 51 ± 6 | 57 ± 4 | 67 ± 5 | 82 ± 6a,b |
| HDL | 34 ± 9 | 36 ± 6 | 38 ± 4 | 51 ± 5a,b |
| LDL | 8.8 ± 1.7 | 8.8 ± 1.4 | 6.8 ± 2.3 | 21 ± 5a,b |
| VLDL | 11 ± 1 | 13 ± 2 | 27 ± 4a | 37 ± 7a,b |
| TG | 54 ± 6 | 63 ± 10 | 134 ± 18a | 187 ± 37a,b |
| LIVER (mg/g wet weight) t = 0 h | ||||
| TG | 4.8 ± 0.5 | 9.5 ± 1.6a | ||
| NEFA | 5.5 ± 0.1 | 6.2 ± 0.2a | ||
| LIVER (mg/g wet weight) t = 24 h | ||||
| TG | 5.3 ± 0.5 | 4.8 ± 0.1 | 27 ± 2a | 24 ± 3a |
| NEFA | 5.1 ± 0.2 | 5.3 ± 0.3 | 6.1 ± 0.1a | 7.2 ± 0.2a,b |
Animals and treatments are described under “Methods” section. A lipid panel was measured with the Piccolo Xpress Chemistry analyzer in plasma samples. TG and nonesterified fatty acids were measured in hepatic lipid extracts. Data are mean 6 S.E.M. (n = 4–8) and are reported as indicated in the individual rows.
a, P < .05 compared with the absence of LPS;
b, P < .05 compared with the absence of CE.
Glu, glucose; Chol, cholesterol; HDL, high-density lipoprotein; LDL, low-density lipoprotein; VLDL, very low-density lipoprotein; TG, triglycerides; NEFA, nonesterified fatty acids.
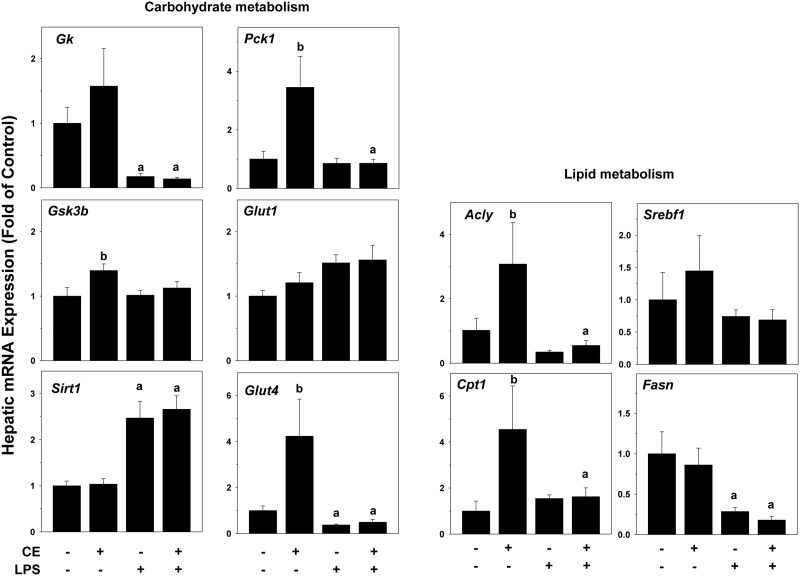
Hepatic steatosis and changes in glycogen stores are often mediated via direct alterations in the expression of genes key to lipid and carbohydrate metabolism. To explore the effects of CE on hepatic energy metabolism, expression of genes that are key in regulating the synthesis and catabolism of carbohydrates and lipids were examined by qRT-PCR (Figure 5). CE alone significantly increased the expression of a number of genes involved in carbohydrate and lipid metabolism, including phosphoenolpyruvate carboxykinase 1 (Pck1, rate-limiting enzyme in gluconeogenesis), glycogen synthase kinase-3 (Gsk3b, suppresses glycogen synthesis), glucose transporter Glut4 (insulin-mediated glucose transport), ATP citrate lyase (Acly, link between carbohydrate metabolism and fatty acid production), and carnitine palmitoyltransferase (Cpt1a, rate-limiting enzyme in fatty acid β-oxidation). Expression of glucokinase (Gk, rate-limiting enzyme in glycolysis), glucose transporter Glut1 (basal glucose transport), Sirt1 (regulator in glucose and lipid metabolism), Srebp1 (sterol regulatory element-binding protein 1), Fasn (fatty acid synthase) were unchanged by CE alone at the 4-h time-point. LPS had no effect on most of these genes at the 4-h time-point, but increased Sirt1 expression and decreased expression of Gk, Glut4, Acly, and Fasn. CE did not alter expression changes caused by LPS (Figure 5).
FIG. 5.
CE alters expression of metabolism-regulating genes in mouse liver. Hepatic mRNA expression of genes for lipid and carbohydrate metabolism was determined by qRT-PCR. a, P < .05 compared with the absence of LPS; b, P < .05 compared with the absence of CE.
Effect of CAA on Mitochondrial Integrity and Respiration
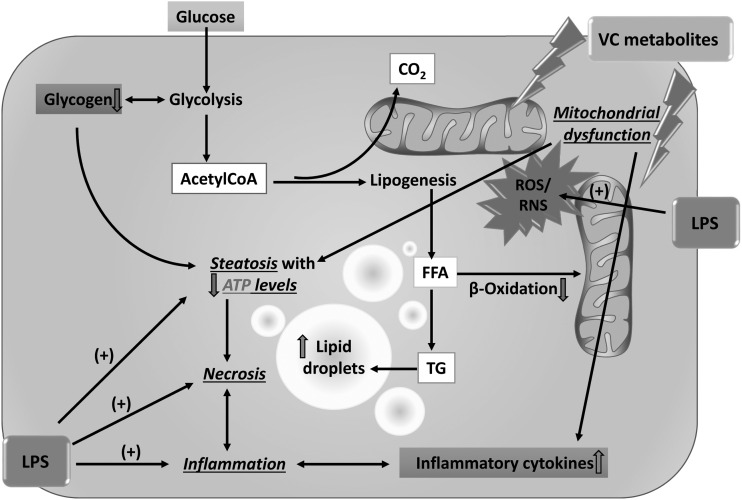
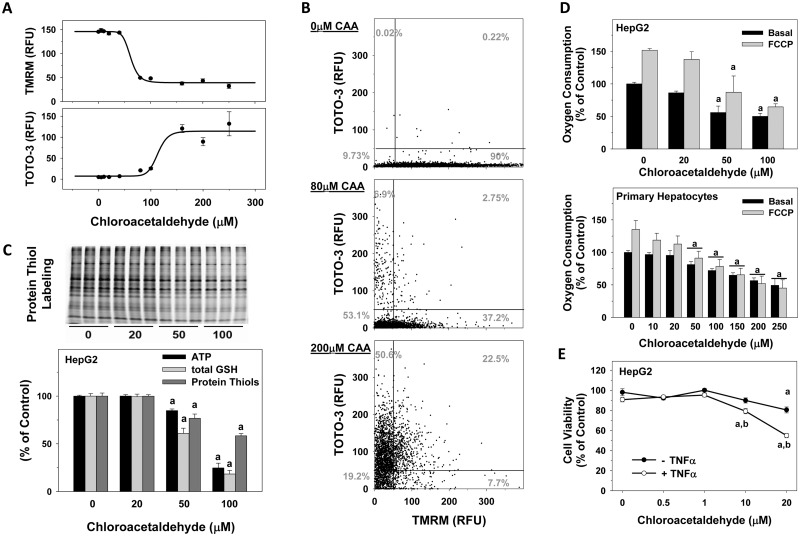
An additional mechanism by which toxicants can change cellular energy (eg, lipid and carbohydrate stores) is via affecting flux through these pathways, independent of gene expression changes. The hypothesis that VC metabolites directly affect flux through these pathways (scheme, Figure 8) was determined via cell-based immunofluorescence (Cellomics) and via energetic flux analysis (Seahorse). HepG2 cells were incubated with CAA instead of CE as they are known to lack CYP2E1 and alcohol dehydrogenase and therefore are unable to further metabolize CE. Nuclear area (Hoechst fluorescence), mitochondrial membrane potential (TMRM fluorescence), and cell membrane permeability (TOTO-3) were determined. CAA concentration-dependently decreased polarized mitochondria (TMRM; Figs. 6A and B) and concomitantly increased cell membrane permeability (TOTO-3). These effects of CAA were not coupled with a decrease in nuclear size, as would be expected by apoptotic killing. Importantly, when these variables were monitored at the individual cellular level, the concentrations of CAA required to decrease mitochondrial membrane potential were lower than the concentrations required to increase cell permeability and subsequent cell death (Figure 6A). In line with these findings, the compound concentration dependently decreased oxygen consumption in HepG2 cells and primary hepatocytes, isolated from mice (Figure 6D). In both cell types, a significant decrease in the basal OCR was noted at concentrations ≥50 µM CAA. Importantly, also after uncoupling mitochondrial oxidative phosphorylation with carbonilcyanide p-triflouromethoxyphenylhydrazone (FCCP), OCR of both cell types concentration dependently decreased. Moreover, decreased mitochondrial ‘reserve capacity’ was observed, which is calculated by subtracting the maximal OCR by the basal rate (OCR after addition of FCCP, Figure 6D). In line with the Cellomics HCS and Seahorse data, CAA decreased ATP levels by 15% or 75% at the 50 µM and 100 concentrations, respectively (Figure 6C). Similarly, total glutathione levels and cellular protein thiols were decreased by 40% or 80% for total GSH and by 20% or 40% for protein thiols at the 50 and 100 µM concentrations, respectively (Figure 6C). To determine a sensitization of hepatocytes by CAA; cellular viability was measured via an MTT assay in response to CAA ± TNFα. HepG2 cells were exposed to CAA (0–20 µM) for 24 h with in the presence and absence of 17.5 ng/ml TNFα (Figure 6E). CAA alone did not affect cell viability at concentrations <20 μM. However, CAA concentrations 10 μM and higher sensitized the cells to the cytotoxic cytokine TNFα and significantly decreased cell viability by 20% (at 10 µM CAA) and 44% (at 20 µM CAA; Figure 6E).
FIG. 8.
Working hypothesis. Through the generation of ROS and nitrogen species , VC metabolites cause the production of proinflammatory cytokines and mitochondrial damage, which impairs oxidative phosphorylation; the cell increases flux through anaerobic glycolysis to compensate for this loss of ATP yield. The increased demand for glucose depletes glycogen stores, which likely increases AMPK activity. Interestingly, mTOR, which is usually regulated in opposition to AMPK, also appears to be activated by VC exposure. This concomitant activation of catabolic (AMPK) and anabolic (mTOR) signals likely explains why acetylCoA is being shunted to lipid synthesis (causing steatosis) rather than β-oxidation, even under conditions of ATP depletion. The combined metabolic stress of VC exposure likely causes ‘apopnecrosis’ (or ‘necroptosis’) associated with increased proinflammatory cytokines. The summary of these changes renders the cell more susceptible to additional factors, such as LPS, leading to an enhancement of the effects.
FIG. 6.
CAA toxicity in HepG2 cells and primary mouse hepatocytes. Cells were grown in 96-well plates and incubated with CAA. A, Mitochondrial membrane potential (TMRM fluorescence), and cell membrane permeability (TOTO-3 fluorescence) were determined in HepG2 cells, using the Cellomics HCS on the well level. B, Individual values for TOTO-3 fluorescence as a function of TMRM fluorescence for individual valid objects (HepG2 cells as measured by nuclear area: Hoechst fluorescence) is shown. C, Protein thiol modifications (upper and lower panels), ATP (lower panel) and total glutathione (lower panel) levels were measured in HepG2 cells. D, Respiration was measured in cells exposed to CAA. OCRs (% of Control) are shown using the Seahorse XF96. E, Cytotoxicity was determined using an MTT assay. Data are expressed as percent of untreated control (n = 8). a, P < .05 compared with the absence of CAA; b, P < .05 compared with 17.5 ng/ml TNFα.
Effect of CE on Mechanistic Target of Rapamycin (mTOR) and AMPK Phosphorylation Status
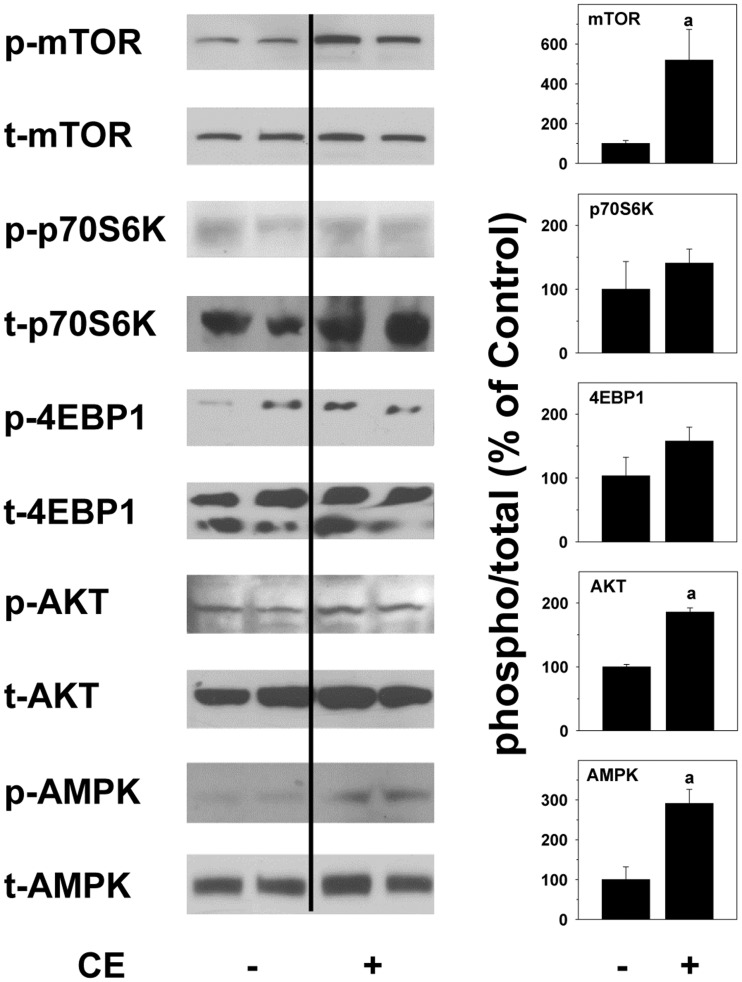
The results suggest that CE significantly impacts cellular energy metabolism (Figs. 4, 5, and 6), leading to lipid accumulation and depletion of glycogen stores (Figure 4). The observed metabolic changes caused by VC metabolites may be, at least in part, responsible for the sensitization effect of the liver cells to cytotoxic stimuli by VC metabolites (Figure 6E). The kinases mTOR and AMPK are considered critical intracellular ‘switches’ to regulate and respond to anabolic and catabolic changes in lipid and carbohydrate metabolism. Therefore, the effect of CE exposure in vivo on the hepatic phosphorylation status of both mTOR and its downstream targets p70S6K, 4EBP1, AKT, as well as AMPK was determined. Representative western blots (Figure 7) and densitometric analysis (Figure 7) of these lysates are shown. Interestingly, CE alone caused simultaneous increases in mTOR, in part its downstream targets (AKT and 4EBP1) and also AMPK activation at the 4-h time-point (Figure 7).
FIG. 7.
Metabolic functions of mTOR and AMPK in mouse liver. Mouse liver protein was extracted from samples collected at the 0 h time-point. Representative Western blots for phosphorylated and total mTOR, p70S6K, 4EBP1, AKT, and AMPK and densitometric analyses of proteins are shown. a, P < .05 compared with the absence of CE.
DISCUSSION
Subhepatotoxic CE Enhances Liver Damage Caused by LPS
The role that chronic exposure to VC plays in disease is a major health concern in the US, because there are many areas with elevated VC in the ground water due to close proximity to contaminated sites (Kielhorn et al., 2000). While current safety restrictions in today’s industry lessen exposure concerns, it is still unclear whether lower exposure levels of VC and metabolites that are not overtly toxic, per se, can augment liver toxicity caused by another insult.
Here, the hypothesis tested was whether CE enhances hepatotoxicity due to LPS, which is often elevated in systemic blood during liver disease (Li and Diehl, 2003), and is employed in basic research as a model hepatotoxicant (Yang et al., 1997). The results summarized in this study demonstrate that CE exposure at a concentration that does not cause overt injury in the mouse, enhanced liver damage caused by LPS. Interestingly, CE + LPS exposure decreased the number of apoptotic (Figure 2) Kupffer cells and hepatocytes compared with LPS alone. The former effect may contribute to the elevated inflammatory response to LPS in the presence of CE, while the latter effect suggests a necrotic rather than apoptotic cell death. Such switches from apoptosis to necrosis are common when cellular energy levels are insufficient to complete apoptosis (ie, ‘necroptosis’, see below). Cave et al., recently reported that TASH in workers with high occupational exposure to VC was associated predominantly with necrosis rather than apoptosis, which distinguishes from both nonalcoholic and alcoholic steatohepatitis (Cave et al., 2010; Wieckowska et al., 2006). The results of the current animal/in vitro study validate those findings and support the hypothesis that VC metabolites can enhance liver damage caused by an additional insult due to priming of the inflammatory response (Figs. 1 and 3) and sensitization of hepatocytes (Figure 6E).
Potential Mechanisms by Which CE Enhances LPS-Induced Liver Damage
The majority of studies investigating VC and/or its metabolites focus on carcinogenesis and previously proposed mechanisms have centered on DNA damage caused by adduct formation (Bolt, 2005). This study identified a new impact of CE exposure to dysregulate carbohydrate and lipid metabolism, causing glycogen depletion and steatosis (Figure 4). Specifically, it was found here that CE increased circulating and hepatic lipids, even in the absence of LPS (Table 1 and Figure 4). This effect was mediated, at least in part, by mitochondrial damage and subsequent impaired β-oxidation of NEFA. This effect did not correlate with expression changes of variables of de novo synthesis (Fasn, Figure 5). It is therefore likely that the observed effects represent a dysregulation of mitochondrial function (see below). Similarly, CE exposure alone partially depleted hepatic glycogen levels, which was exacerbated by LPS (Figure 4); suggesting an elevated consumption of glycogen reserves by CE exposure, in spite of elevated Glut4 expression in CE exposed animals (Figure 5), which should favor glucose uptake over glycogenolysis for aerobic metabolism. These results suggest that livers exposed to CE paradoxically store lipids (anabolic effect), while simultaneously depleting carbohydrate (glycogen) supplies (catabolic effect, Figure 4).
Mitochondria are key to maintaining cellular energy homeostasis. Previous studies have shown that CAA caused nephrotoxicity via mechanisms involving mitochondrial toxicity (Knouzy et al., 2010; Springate, 1997) and it has been hypothesized that CAA inhibits oxidative phosphorylation in mitochondria (Bruggemann et al., 2006; Sood and O’Brien, 1994). Furthermore, it has been shown that 4-HNE exposure to cells causes a loss of mitochondrial ‘bioenergetic reserve capacity,’ which is available to serve increased energy demands for maintenance of organ function, cellular repair, or detoxification of reactive species (Hill et al., 2009a). Similar to 4-HNE, CAA is a thiol reactive aldehyde, capable of protein modification. Indeed, here CAA decreased oxygen consumption in primary hepatocytes and HepG2 cells, caused mitochondrial toxicity, depleted ATP, glutathione and cellular protein thiols in HepG2 cells (Figure 6). Moreover, decreases in the ‘reserve capacity’ of the cell suggest that CAA impairs the ability of cells to mount an appropriate bioenergetic response to additional stressors, such as cytotoxic cytokines (Figs. 6D and E). The resulting loss of the ability to maintain ATP-levels favors necrotic cell death consistent with the observed decrease in TUNEL-positive cells in mice (Figure 2). These data therefore suggest that VC metabolites damage hepatic mitochondria and cause a switch from aerobic to anaerobic glycolysis. Inhibition of oxidative phosphorylation increases the rate of glycolysis to account for the net loss in ATP yield (Arteel et al., 1998). However, even though glycogen reserves were depleted, livers accumulated lipids, a potential alternative source of ATP. Within the cell, carbohydrate and lipid metabolism are usually under tight control by the protein kinases AMPK and mTOR. Both AMPK and mTOR are known to act as ‘sensors’ of cellular energy status and help to maintain homeostasis (Guertin and Sabatini, 2009; Hardie, 2008). In general, downstream effects of AMPK activation are considered catabolic and favor ATP generation during energy depletion, eg, glycolysis is enhanced and ATP-consuming processes are inhibited by AMPK (Krause et al., 2002). In contrast, mTOR is activated during times of high nutrient availability and favors storage of excess nutrients (eg, TG). Activation of the mTOR pathway promotes ATP-consuming processes such as protein and lipid synthesis through its downstream targets p70S6K, 4EBP1, and AKT. AMPK and mTOR are generally differentially activated, and mediate opposing cellular functions (Kimball, 2006). However, recently it has been shown that AMPK and mTOR may also be concomitantly activated in the liver (Schmidt et al., 2013), resulting in a state wherein metabolic resources are abundant, but cannot be efficiently used. These results are in line with what was observed here; AMPK and mTOR were activated in parallel by CE exposure causing lipids to accumulate while carbohydrate storage is being depleted (Figs. 4, 7, and 8).
Decreased intestinal barrier function with subsequently increased endotoxemia and enhanced hepatic/systemic inflammation has been implicated in TASH (Wahlang et al., 2013). CAA has been shown to decrease transepithelial electrical resistance in the Caco-2 in vitro model of gut barrier function (Cave et al., unpublished observations). The CE + LPS animal model was developed, in part, based on these initial observations. This animal model appears clinically relevant because it recapitulates the hepatocellular necrosis and systemic inflammation previously reported in chemical workers with TASH and high-level occupational exposures to VC (Cave et al., 2010, 2011). Alarmingly, this pattern of hepatocellular necrosis associated with increased proinflammatory cytokines was also seen in the residential cohort suggesting that exposures to air toxicants near chemical plants could result in environmental liver disease and TASH.
SUMMARY AND CONCLUSIONS
The results of this study suggest that VC metabolites (CE and CAA) cause mitochondrial damage, which impairs oxidative phosphorylation; the cell increases flux through anaerobic glycolysis to compensate for this loss of ATP yield. The increased demand for glucose depletes glycogen stores. The combined metabolic stress of CE exposure sensitizes the hepatocytes to necroptosis caused by inflammation. As mentioned above, liver injury involves an inflammatory response from stimuli that would normally be inconsequential. For example, fatty livers have been shown to be more susceptible to liver damage in rodent models and in humans (Colell et al., 1998; Yang et al., 1997). The circumstances that lead to this are that inflammatory cells are ‘primed’ to be stimulated and that hepatocytes are ‘sensitized’ to an additional insult, leading to more robust inflammatory liver damage (Day and James, 1998). Priming and sensitization could be considered a series of events that operate in tandem to cause the liver injury associated with VC/metabolites. Specifically, as shown here CE primes inflammatory cells to release proinflammatory cytokines that damage hepatocytes, which are sensitized to such damage via the impact of CE on energy flux. The histologic similarity of steatohepatitis, regardless of cause is well known. Some of the findings shown here (eg, mitochondrial dysfunction and altered energy metabolism) are potentially shared mechanisms with other liver diseases (eg, NASH and ASH). It will be interesting in future studies to leverage our current understanding of these diseases in liver injury caused by environmental toxicants.
The relative safety of VC/metabolites to the human population is still not well understood. However, this study suggests that even subhepatotoxic VC/metabolite exposures may be harmful. Importantly, most studies to date have focused on the effect of VC alone and not taken into consideration risk-modifying factors. Furthermore, even fewer studies have tested the possibility that VC may be a risk modifying factor for other diseases. It was shown here that VC metabolite CE enhances experimental LPS-induced liver injury in mice. CE concentrations employed here are likely higher than human exposure. However, in mice the concentrations employed caused no pathophysiological changes per se (Figure 1), but sensitized the livers to an additional factor. These data therefore may have implications for exposure levels that are too low to have direct effects on liver pathology in humans. These results therefore suggest that the relative risk of hepatic damage caused by VC exposure may have to be modified to consider additional factors, such as underlying fatty liver disease.
ACKNOWLEDGMENTS
We wish to thank Jenny D. Jokinen very much for her technical assistance.
FUNDING
National Institutes of Health (K01DK096042 to J.I.B., R01ES021375, R13ES024661, and K23AA18399 to M.C., R01AA018016, R01AA018869, T35ES014559, U01AA021893, and U01AA021901 to C.J.M.).
REFERENCES
- Agency for Toxic Substances and Disease Registry ( 2014). Camp Lejeune, NC; Water Modeling.
- Anwar-Mohamed A., El-Kadi A. O. (2008). Down-regulation of the carcinogen-metabolizing enzyme cytochrome P450 1a1 by vanadium. Drug Metab. Dispos. 36, 1819–1827. [DOI] [PubMed] [Google Scholar]
- Arteel G. E., Guo L., Schlierf T., Beier J. I., Kaiser J. P., Chen T. S., Liu M., Conklin D. J., Miller H. L., von Montfort C., et al. (2008). Subhepatotoxic exposure to arsenic enhances lipopolysaccharide-induced liver injury in mice. Toxicol. Appl. Pharmacol. 226, 128–139. [DOI] [PMC free article] [PubMed] [Google Scholar]
- Arteel G. E., Thurman R. G., Raleigh J. A. (1998). Reductive metabolism of hypoxia marker pimonidazole is regulated by oxygen tension independent of pyridine nucleotide redox state. Eur. J. Biochem. 253, 743–750. [DOI] [PubMed] [Google Scholar]
- Beier J. I., Arteel G. E., McClain C. J. (2011). Advances in alcoholic liver disease. Curr. Gastroenterol. Rep. 13, 56–64. [DOI] [PMC free article] [PubMed] [Google Scholar]
- Beier J. I., Guo L., von Montfort C., Kaiser J. P., Joshi-Barve S., Arteel G. E. (2008). New role of resistin in lipopolysaccharide-induced liver damage in mice. J. Pharmacol. Exp. Ther. 325, 801–808. [DOI] [PMC free article] [PubMed] [Google Scholar]
- Beier J. I., Luyendyk J. P., Guo L., von Montfort C., Staunton D. E., Arteel G. E. (2009). Fibrin accumulation plays a critical role in the sensitization to lipopolysaccharide-induced liver injury caused by ethanol in mice. Hepatology 49, 1545–1553. [DOI] [PMC free article] [PubMed] [Google Scholar]
- Beier J. I., von M. C., Sies H., Klotz L. O. (2006). Activation of ErbB2 by 2-methyl-1,4-naphthoquinone (menadione) in human keratinocytes: role of EGFR and protein tyrosine phosphatases. FEBS Lett. 580, 1859–1864. [DOI] [PubMed] [Google Scholar]
- Bligh E. G., Dyer W. J. (1959). A rapid method of total lipid extraction and purification. Can. J. Biochem. Physiol. 37, 911–917. [DOI] [PubMed] [Google Scholar]
- Bolt H. M. (2005). Vinyl chloride-a classical industrial toxicant of new interest. Crit. Rev. Toxicol. 35, 307–323. [DOI] [PubMed] [Google Scholar]
- Bove F. J., Ruckart P. Z., Maslia M., Larson T. C. (2014a). Evaluation of mortality among marines and navy personnel exposed to contaminated drinking water at USMC base Camp Lejeune: A retrospective cohort study. Environ. Health 13, 10. [DOI] [PMC free article] [PubMed] [Google Scholar]
- Bove F. J., Ruckart P. Z., Maslia M., Larson T. C. (2014b). Mortality study of civilian employees exposed to contaminated drinking water at USMC Base Camp Lejeune: A retrospective cohort study. Environ. Health 13, 68. [DOI] [PMC free article] [PubMed] [Google Scholar]
- Bruggemann S. K., Radike K., Braasch K., Hinrichs J., Kisro J., Hagenah W., Peters S. O., Wagner T. (2006). Chloroacetaldehyde: Mode of antitumor action of the ifosfamide metabolite. Cancer Chemother. Pharmacol. 57, 349–356. [DOI] [PubMed] [Google Scholar]
- Cave M., Falkner K. C., Henry L., Costello B., Gregory B., McClain C. J. (2011). Serum cytokeratin 18 and cytokine elevations suggest a high prevalence of occupational liver disease in highly exposed elastomer/polymer workers. J. Occup. Environ. Med. 53, 1128–1133. [DOI] [PMC free article] [PubMed] [Google Scholar]
- Cave M., Falkner K. C, McClain C. J. (2012). Occupational and Environmental Hepatotoxicity In Zakim and Boyer's Hepatology (Boyer D. T., Manns M. P., Sanyal A. J., Eds.), 6 ed., pp. 476–492. Saunders, Philadelphia. [Google Scholar]
- Cave M., Falkner K. C., Ray M., Joshi-Barve S., Brock G., Khan R., Bon Homme M., McClain C. J. (2010). Toxicant-associated steatohepatitis in vinyl chloride workers. Hepatology 51, 474–481. [DOI] [PMC free article] [PubMed] [Google Scholar]
- Colell A., Garcia-Ruiz C., Miranda M., Ardite E., Mari M., Morales A., Corrales F., Kaplowitz N., Fernandez-Checa J. C. (1998). Selective glutathione depletion of mitochondria by ethanol sensitizes hepatocytes to tumor necrosis factor. Gastroenterology 115, 1541–1551. [DOI] [PubMed] [Google Scholar]
- Day C. P., James O. F. (1998). Steatohepatitis: a tale of two “hits”? Gastroenterology 114, 842–845. [DOI] [PubMed] [Google Scholar]
- Ding X., Beier J. I., Baldauf K. J., Jokinen J. D., Zhong H., Arteel G. E. (2014). Acute ethanol preexposure promotes liver regeneration after partial hepatectomy in mice by activating ALDH2. Am. J. Physiol. Gastrointest. Liver Physiol. 306, G37–G47. [DOI] [PMC free article] [PubMed] [Google Scholar]
- Griffith O. W. (1980). Determination of glutathione and glutathione disulfide using glutathione reductase and 2-vinylpyridine. Anal. Biochem. 106, 207–212. [DOI] [PubMed] [Google Scholar]
- Guertin D. A., Sabatini D. M. (2009). The pharmacology of mTOR inhibition. Sci. Signal. 2, e24.. [DOI] [PubMed] [Google Scholar]
- Hardie D. G. (2008). AMP-activated/SNF1 protein kinases: Conserved guardians of cellular energy. Nat. Rev. Mol. Cell. Biol. 8, 774–785. [DOI] [PubMed] [Google Scholar]
- Herman B., Nieminen A. L., Gores G. J., Lemasters J. J. (1988). Irreversible Injury in anoxic hepatocytes precipitated by an abrupt increase in plasma membrane permeability. FASEB J. 2, 146–151. [DOI] [PubMed] [Google Scholar]
- Hill B. G., Dranka B. P., Zou L., Chatham J. C., Darley-Usmar V. M. (2009a). Importance of the bioenergetic reserve capacity in response to cardiomyocyte stress induced by 4-hydroxynonenal. Biochem. J. 424, 99–107. [DOI] [PMC free article] [PubMed] [Google Scholar]
- Hill B. G., Reily C., Oh J. Y., Johnson M. S., Landar A. (2009b). Methods for the determination and quantification of the reactive thiol proteome. Free Radic. Biol. Med. 47, 675–683. [DOI] [PMC free article] [PubMed] [Google Scholar]
- Jaeschke H. (1995). Mechanisms of oxidative stress-induced acute tissue injury. Proc. Soc. Exp. Biol. Med. 209, 104–111. [DOI] [PubMed] [Google Scholar]
- Kaiser J. P., Beier J. I., Zhang J., David H. J., von Montfort C., Guo L., Zheng Y., Monia B. P., Bhatnagar A., Arteel G. E. (2009). PKCepsilon plays a causal role in acute ethanol-induced steatosis. Arch. Biochem. Biophys. 482, 104–111. [DOI] [PMC free article] [PubMed] [Google Scholar]
- Kaphalia B. S., Ansari G. A. (1989). Hepatic fatty acid conjugation of 2-chloroethanol and 2-bromoethanol in rats. J. Biochem. Toxicol. 4, 183–188. [DOI] [PubMed] [Google Scholar]
- Kielhorn J., Melber C., Wahnschaffe U., Aitio A., Mangelsdorf I. (2000). Vinyl chloride: Still a cause for concern. Environ. Health Perspect. 108, 579–588. [DOI] [PMC free article] [PubMed] [Google Scholar]
- Kimball S. R. (2006). Interaction between the AMP-activated protein kinase and mTOR signaling pathways. Med. Sci. Sports Exerc. 38, 1958–1964. [DOI] [PubMed] [Google Scholar]
- Knouzy B., Dubourg L., Baverel G., Michoudet C. (2010). Targets of chloroacetaldehyde-induced nephrotoxicity. Toxicol. In Vitro 24, 99–107. [DOI] [PubMed] [Google Scholar]
- Krause U., Bertrand L., Hue L. (2002). Control of p70 ribosomal protein S6 kinase and acetyl-CoA carboxylase by AMP-activated protein kinase and protein phosphatases in isolated hepatocytes. Eur. J. Biochem. 269, 3751–3759. [DOI] [PubMed] [Google Scholar]
- Li Z., Diehl A. M. (2003). Innate immunity in the liver. Curr. Opin. Gastroenterol. 19, 565–571. [DOI] [PubMed] [Google Scholar]
- McKone T. E., Knezovich J. P. (1991). The transfer of trichloroethylene (TCE) from a shower to indoor air: Experimental measurements and their implications. J. Air Waste Manage. Assoc. 41, 282–286. [DOI] [PubMed] [Google Scholar]
- Nanji A. A., Mendenhall C. L., French S. W. (1989). Beef fat prevents alcoholic liver disease in the rat. Alcohol. Clin. Exp. Res. 13, 15–19. [DOI] [PubMed] [Google Scholar]
- Ruckart P. Z., Bove F. J., Maslia M. (2013). Evaluation of exposure to contaminated drinking water and specific birth defects and childhood cancers at Marine Corps Base Camp Lejeune, North Carolina: A case-control study. Environ. Health 12, 104.. [DOI] [PMC free article] [PubMed] [Google Scholar]
- Sass J. B., Castleman B., Wallinga D. (2005). Vinyl chloride: A case study of data suppression and misrepresentation. Environ. Health Perspect. 113, 809–812. [DOI] [PMC free article] [PubMed] [Google Scholar]
- Schmidt R. H., Jokinen J. D., Massey V. L., Falkner K. C., Shi X., Yin X., Zhang X., Beier J. I., Arteel G. E. (2013). Olanzapine activates hepatic mammalian target of rapamycin (mTOR): New mechanistic insight into metabolic dysregulation with atypical antipsychotic drugs. J. Pharmacol. Exp. Ther. 347, 1–10. [DOI] [PMC free article] [PubMed] [Google Scholar]
- Sherman M. (2009). Vinyl chloride and the liver. J. Hepatol. 51, 1074–1081. [DOI] [PubMed] [Google Scholar]
- Sood C., O’Brien P. J. (1994). Chloroacetaldehyde-induced hepatocyte cytotoxicity. Mechanisms for cytoprotection. Biochem. Pharmacol. 48, 1025–1032. [DOI] [PubMed] [Google Scholar]
- Springate J. E. (1997). Ifosfamide metabolite chloroacetaldehyde causes renal dysfunction in vivo. J. Appl. Toxicol. 17, 75–79. [DOI] [PubMed] [Google Scholar]
- U.S. Department of Health and Human Services, P. H. S. (2006) Agency for Toxic Substances and Disease Registry (ATSDR): Toxicological profile for Vinyl Chloride. [PubMed]
- U.S. Environmental Protection Agency (U.S.EPA) ( 2000). Toxicological review of vinyl chloride in support of summary information on the Integrated Risk Information System (IRIS).
- von Montfort C., Beier J. I., Guo L., Kaiser J. P., Arteel G. E. (2008). Contribution of the sympathetic hormone epinephrine to the sensitizing effect of ethanol on LPS-induced liver damage in mice. Am. J. Physiol. Gastrointest. Liver Physiol. 294, G1227–G1234. [DOI] [PMC free article] [PubMed] [Google Scholar]
- Wahlang B., Beier J. I., Clair H. B., Bellis-Jones H. J., Falkner K. C., McClain C. J., Cave M. C. (2013). Toxicant-associated steatohepatitis. Toxicol. Pathol. 41, 343–360. [DOI] [PMC free article] [PubMed] [Google Scholar]
- Wieckowska A., Zein N. N., Yerian L. M., Lopez A. R., McCullough A. J., Feldstein A. E. (2006). In vivo assessment of liver cell apoptosis as a novel biomarker of disease severity in nonalcoholic fatty liver disease. Hepatology 44, 27–33. [DOI] [PubMed] [Google Scholar]
- Yang S. Q., Lin H. Z., Lane M. D., Clemens M., Diehl A. M. (1997). Obesity increases sensitivity to endotoxin liver injury: Implications for the pathogenesis of steatohepatitis. Proc. Natl Acad. Sci. USA. 94, 2557–2562. [DOI] [PMC free article] [PubMed] [Google Scholar]


