

Abstract
Purpose
We aimed to develop pixelwise maps of tumor acidosis to aid in evaluating extracellular tumor pH (pHe) in cancer biology.
Procedures
MCF-7 and MDA-MB-231 mouse models were imaged during a longitudinal study. AcidoCEST MRI and a series of image processing methods were used to produce parametric maps of tumor pHe, and tumor pHe was also measured with a pH microsensor.
Results
Sufficient contrast-to-noise for producing pHe maps was achieved by using standard image processing methods. A comparison of pHe values measured with acidoCEST MRI and a pH microsensor showed that acidoCEST MRI measured tumor pHe with an accuracy of 0.034 pH units. The MCF-7 tumor model was found to be more acidic compared to the MDA-MB-231 tumor model. The pHe was not related to tumor size during the longitudinal study.
Conclusions
These results show that acidoCEST MRI can create pixelwise tumor pHe maps of mouse models of cancer.
Keywords: Tumor acidosis, CEST MRI, pH maps, Breast cancer
Introduction
The extracellular pH (pHe) of a solid tumor is commonly considered to be acidic, ranging between approximately pH 6.4 and 7.2 [1]. This acidity is often attributed to the Warburg effect, when tumor cells have a propensity to undergo aerobic glycolysis that produces excess lactic acid [2]. This tumor acidosis has been suggested to contribute to growth, invasion, and metastasis and may also cause chemoresistance to weak-base drugs [3, 4]. In vivo tumor acidosis has been studied with pH microsensors, including clinical studies of malignant melanomatosis tumors [5]. However, the “minimally” invasive procedure of inserting a microsensor into tissue can cause discomfort and damage and is inappropriate for probing inaccessible tumors in deep tissues. A variety of noninvasive biomedical imaging methods have been developed to measure in vivo tumor acidosis, but each of these methods has limitations. For example, fluorescence imaging of pHe is limited to surface tissues [6, 7]; instrumentation for measuring pHe with in vivo EPR [8] and hyperpolarized MR spectroscopy [9] is not readily available; PET imaging [10, 11] and MR spectroscopic imaging [12] lack spatial resolution for measuring pHe; and relaxation-based MRI cannot measure pHe without also accounting for the concentration of an exogenous contrast agent [13].
Chemical Exchange Saturation Transfer (CEST) is a relatively new MRI contrast mechanism [14]. The CEST MRI method applies a radio frequency pulse that selectively saturates the magnetization of a proton, which eliminates the coherent MR signal of this proton (Fig. 1a, step 1). Subsequent chemical exchange of this proton with a proton on a nearby water molecule causes a loss of coherent MR signal from the water (Fig. 1a, step 2). CEST spectra, also known as Z-spectra, are obtained by iterating the selective saturation radio frequency and recording the % water signal that remains after the saturation period (Fig. 1b). The amplitudes of multiple CEST effects in a single CEST spectrum can be measured by fitting Lorentzian line shapes to the experimental CEST spectrum (Fig. 1c) [15].
Fig. 1.
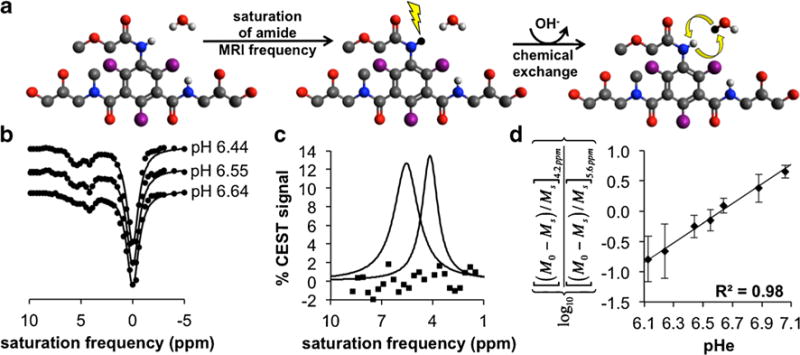
In solutio acidoCEST MRI. a Step 1: Selective saturation of one amide proton of iopromide causes a loss of coherent net magnetization from the proton (shown as a conversion from white to black). Step 2: Base-catalyzed chemical exchange of the proton from iopromide to water transfers the saturation to the water. Only protons of the two amide groups and water are shown. Base catalysis is indicated by the “OH−” in the curved arrow. b CEST spectra show the water signal as a function of selective saturation. The CEST amplitudes at 4.2 and 5.6 ppm are dependent on pH. c The CEST amplitudes can be measured with Lorentzian line shape fitting. Residuals of the fitting process are shown as squares. d A ratio of the CEST effects is linearly correlated with pH.
The amplitude of the CEST effect involving an amide is pH-dependent because the chemical exchange of an amide proton is base-catalyzed (Fig. 1a, step 2) [16]. We and others have shown that the ratio of CEST effects from two protons on the same CEST agent can be used to measure pH in a concentration-independent manner (Fig. 1d) [17–20]. Careful attention to consistent image acquisition and processing established a measurement precision of 0.07 pH units for our method [21]. We have also previously demonstrated that this method, termed “acidoCEST MRI,” can monitor relative changes in average tumor pHe. Our current report builds on our previous studies by investigating whether acidoCEST MRI can measure accurate tumor pHe values, can be used to produce parametric spatial maps of tumor pHe, and can evaluate the differences in tumor acidosis between preclinical models of mammary carcinoma.
Materials and Methods
Reagents
All reagents were obtained from Sigma-Aldrich, Inc. (St. Louis, MO), unless otherwise indicated. Clinical-grade iopromide at 788 mM was used (300 mg iodine/ml Ultravist™, Bayer Health Care, Inc., Leverkusen, Germany).
Xenograft Tumor Model
All in vivo studies were conducted according to approved procedures of the Institutional Animal Care and Use Committee of the University of Arizona. Models of MCF-7 and MDA-MB-231 mammary carcinoma were prepared by injecting one million tumor cells in 0.5 ml of 50 % Matrigel™ into the upper right flank of a 6-week-old female SCID mouse. For the MCF-7 model, an 8-week slow-releasing estrogen pellet was implanted in the back of the neck. Imaging studies were conducted when the subcutaneous tumor reached a size greater than 2 mm in diameter and once every 2 weeks thereafter. Each mouse was measured four times with acidoCEST MRI, unless the tumor reached ≥2,000 mm3 or became necrotic, at which time the mouse was euthanized. Notably, all imaging was performed before the tumor showed visible signs of necrosis.
AcidoCEST MRI
Our acidoCEST MRI protocol has been described in a previous report [21]. Briefly, each mouse was anesthetized with 1.5–2.5 % isoflurane delivered in 1 l/min oxygen gas ventilation and then secured to a customized cradle. A 27-g catheter was inserted into the tail vein. The cradle was inserted into a 7-T Biospec MRI scanner with a 72-mm-diameter quadrature transceiver coil (Bruker Biospin, Inc, Billerica, MA). The breathing rate was monitored, and the core body temperature was regulated at 37.0±0.2 °C using an automated feedback loop between the temperature probe and an air heater (SA Instruments, Inc., Stony Brook, NY). A FLASH MRI acquisition sequence was performed to determine the location of the tumor (500 ms repetition time (TR), 10 ms echo time (TE), 625×625 μm in-plane resolution, 2 mm slice thickness, 64×64 pixels, 4.0×4.0 cm field of view (FOV), 32 s total acquisition time). A spin-echo MRI acquisition sequence was performed for the tumor volume measurements (2,000 ms TR, 35 ms TE, 312.5×312.5 μm in-plane resolution, 1 mm slice thickness, 128×128 pixels, 4.0×4.0 cm FOV, 4:20 min total acquisition time). A bolus of 200 μl iopromide was injected via the catheter within 30 s. The catheter was then connected to an infusion pump, and iopromide was pumped at a rate of 150 μl/h. Our acidoCEST MRI protocol consisted of 54 CEST-Fast imaging with steady-state precession (FISP) MR images acquired at different saturation frequencies using 2.8 μT saturation power and a saturation period of 5 s, which required 4:50 min of acquisition time. The CEST saturation period consisted of a series of Gaussian-shaped radio frequency pulses with an interpulse delay of 10 μs and no additional spoiling of fat saturation pulses. The FISP acquisition used the following parameters: 3.218 ms TR; 1.609 ms TE; 60° excitation angle; 2 mm slice thickness; 250×250 μm in-plane resolution; 3.2×3.2 cm FOV; linear encoding order; unbalanced “FID” mode; and 418.54 ms scan time. This process was repeated six times, for a total acquisition time of 29 min. In a previous study, the concentration of iopromide in tumor tissue was found to be relatively stable with a change of only 6.69 % over the acquisition time frame of 4:50 min. Notably, the images acquired with selective saturation from 7.0 to 2.8 ppm, which primarily impacts the measurements of the CEST effects at 5.6 and 4.2 ppm, were acquired within 1:21 min, which had a relatively stable concentration with a change of only 1.86 % over the acquisition time frame in this previous study. The concentration of water in tumor tissue and the T1 relaxation time of the tumor tissue were assumed to remain constant during the study. At the conclusion of the imaging scan, the mouse was removed from the scanner and cradle and allowed to recover.
Image Processing
The acidoCEST MR images were processed using MatLab® R2012B (Mathworks, Inc., Natick, MA). All six CEST-FISP images were averaged. To improve the signal-to-noise for individual pixels, a pixel averaging technique was employed that binned 3×3 adjacent pixels, which decreased the original spatial resolution. A second pixel averaging technique was used that applied a Gaussian low-pass filter with the size of 7×7 adjacent pixels with a standard deviation of one pixel, which retained the original image spatial resolution. The CEST spectrum from each of the averaged pixels was smoothed with cubic spline smoothing [22]. Thereafter, the smoothed CEST spectrum was fitted with a sum of three Lorentzian line shapes, to account for the direct saturation of water and to measure the CEST effects at 4.2 and 5.6 ppm [15]. The pHe of each averaged pixel with two CEST effects greater than 2√2× noise was determined using an empirical calibration based on chemical solutions of iopromide (Fig. 1d). This empirical calibration can determine pHe between 6.12 and 7.02 units with a precision of 0.07 pH units. The CEST amplitude at 5.6 ppm is too low to measure tumor pHe≫7.0, and the CEST amplitude at 4.2 ppm is too low to measure tumor pHe≪6.2, at the typical contrast-to-noise levels observed in our in vivo studies with pixelwise analysis. Therefore, we have limited our pH calibration range to approximately pH 6.2 to 7.0. These pixels were represented as colored pixels in the pHe map. Pixels with only a single CEST effect at 4.2 ppm greater than 2√2× noise were set to be pH 7.0. These pixels were represented as white pixels in the pHe map. Using a 2√2× noise threshold ensured that the CEST contrast was due to the agent with 95 % probability [23]. The extent of contrast agent uptake was the summation of colored pixels and white pixels relative to the total number of pixels that represented the tumor. Notably, this procedure used a systematic algorithm that did not require user intervention, so that the procedure was devoid of bias.
Tumor Microsensor pHe Measurements
Microsensor pHe measurements were performed with mice immediately after acidoCEST MR imaging sessions while the mice were still under anesthesia. The anesthesia was supplied throughout the microsensor pHe measurement. The anesthetized mouse was placed on a heating pad to maintain the body temperature at 37 °C. Reliable measurements with only 13 mice were made with the microsensor, because the fragile microsensors were prone to breaking, and replacement sensors were not always immediately available.
A five-point calibration between pH 4.0 and 9.0 was performed with the needle-type pH microsensor (PreSens Precision Sensing GmbH, Regensberg, Germany) each day prior to in vivo measurements. Five pH solutions were prepared by mixing 40 mM NaH2PO4 and 40 mM Na2HPO4. The pH values of these buffer solutions were determined with a calibrated pH microsensor (Mettler Toledo, Columbus, OH USA). The pH microsensor was securely fastened to a micromanipulator and inserted into the subcutaneous tumor tissue. Once inserted, the pH microsensors were extended outside the needle housing by 1 mm to minimize damage to the fiber optic tip. The microsensor was placed depth-wise approximately mid-way into the tumor and was placed approximately in the center, left half, and right half of the tumor, as viewed from a coronal orientation. Four pH measurements were recorded in 10 s intervals after the pH recording was stabilized, which typically occurred 1 min after extending the microsensor out of the needle housing. After the pH measurement, the microsensor was retracted back into the needle housing, and the microsensor and housing were withdrawn from the tumor.
Statistical Analysis
The two-tailed, paired Student’s t test assuming equal variances was used to for all evaluations of statistical significance. This test paired the average pH measurement made with acidoCEST MRI with the average pH measurement made with a pH electrode immediately following the acidoCEST MRI scan. Equal variances were used for this t test because the pH measurements with the pH microsensor and acidoCEST MRI had the same standard deviations. Equal variances were also assumed for comparisons of Gaussian filtering vs. 3×3 binning methods and for comparisons of measurements made with the MCF-7 vs. MDA-MB-231 tumor models.
Results
In Vivo AcidoCEST MRI
We performed in vivo acidoCEST MRI studies with xenograft tumor mouse models of MCF-7 and MDA-MB-231 mammary carcinoma. Anatomical images showed that each tumor mass was visually homogenous, indicating no signs of necrosis during each imaging scan. After preparing each mouse for the imaging session, a diamagnetic CEST agent, iopromide (Ultravist™, Bayer Healthcare, Inc., Fig. 1a), was injected i.v. and continuously infused during the MR imaging session. In vivo CEST spectra were obtained by iterating a saturation frequency from −10 to +10 ppm and recording the normalized water signal amplitude using a FISP MRI acquisition protocol (Fig. 2a). Pixel averaging methods and a cubic spline smoothing procedure [22] facilitated the selective detection of two CEST effects from iopromide within the pixels of the MR images. The CEST spectrum from each pixel was fitted with Lorentzian line shapes [15] to quantitatively measure each CEST effect (Fig. 2b). The low residuals near 4.2 and 5.6 ppm attest that these fittings could accurately measure each CEST effect. CEST amplitudes above a 2√2× noise threshold were retained, because this threshold represented a CEST effect that could be assigned to the agent with a 95 % probability.
Fig. 2.
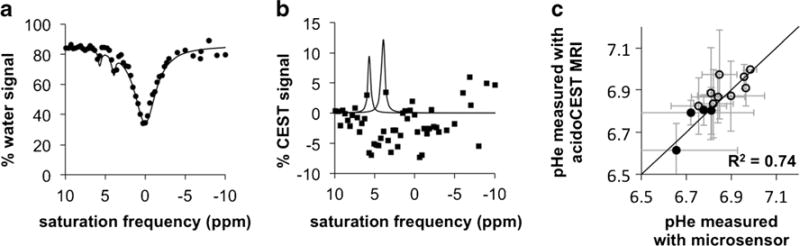
In vivo acidoCEST MRI. a An in vivo CEST spectrum of iopromide in a pixel within a tumor shows two CEST effects at 4.2 and 5.6 ppm. b The CEST amplitudes are measured with Lorentzian line shape fitting to the CEST spectrum. c A comparison of pHe measurements with a microsensor and acidoCEST MRI shows excellent agreement. The average pHe values of tumors with >50 % uptake were calculated using pixels with pHe <7.0 (filled circles), and the average pHe values of tumors with <50 % uptake were calculated using all pixels of the pHe map (open circles).
Our previous acidoCEST MRI analysis methods only measured the average tumor pHe. Our current methods improved on our previous methods by creating parametric maps of pixelwise pHe values. Figure 3b and Supplementary Fig. S1b show examples of a subcutaneous tumor with a strongly acidic pHe and mildly acidic pHe, respectively, which demonstrates the range of pixelwise tumor pHe values that were measured. Colored pixels indicated regions with two CEST effects greater than 2√2× noise, which were used to measure the pHe of the pixel. White pixels indicated pixels with a single CEST effect at 4.2 ppm greater than 2√2× noise, which confirmed that sufficient agent had been delivered to the pixel region, but the pHe was too high to generate a measurable CEST effect at 5.6 ppm. These pixels were considered to have a pHe of 7.0. Although the pHe of these pixels may be higher, our methodology is intended to measure tumor acidity, and pixels above pHe 7.0 were considered to be pH-neutral.
Fig. 3.
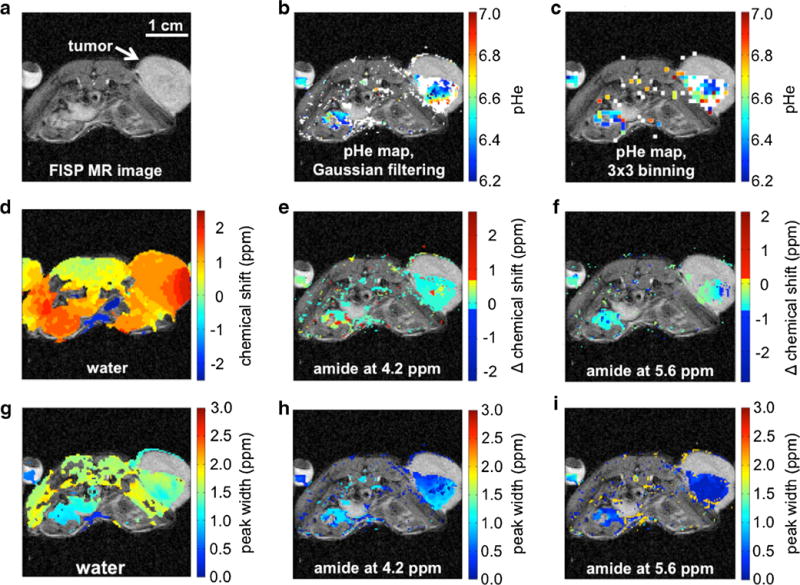
AcidoCEST MRI measured tumor pHe in a subcutaneous MCF-7 mouse model with strongly acidic tumor pHe. Supplementary Fig. S1 shows similar results for a subcutaneous MCF-7 mouse model with a mildly acidic tumor pHe. a A FISP image shows the tumor location. b, c The pHe maps show colorful pixels where two significant CEST effects were measured and converted to pHe values, while white pixels show where only one significant CEST effect was measured, which represented pH >7.0. Gaussian filtering generated a pHe map with better spatial resolution than 3×3 binning. d A range of water chemical shifts throughout the tumor and torso showed the effects of B0 inhomogeneity, but the CEST effects at e 4.2 and f 5.6 ppm relative to the chemical shift of water (i.e., “Δ chemical shift”) were measured with homogenous Δ chemical shifts, demonstrating that B0 inhomogeneity did not affect the pH measurements. g Similarly, a range of relatively broad water peak widths were measured in the tumor and torso, but more homogenous and narrow peak widths were measured for the CEST effects at h 4.2 and i 5.6 ppm.
Our first attempts to analyze CEST spectra from individual pixels were unsatisfactory due to low contrast-to-noise (CNR; Supplementary Fig. S2b). To improve the CNR, we averaged the six CEST-FISP images acquired during a single acidoCEST MR imaging session. We then performed pixel averaging by binning a 3×3 cluster of pixels into a single pixel and then smoothed each CEST spectrum from the binned pixel with a cubic spline function (Supplementary Fig. S2d). Other binning sizes produced pixelwise maps with less balance between CNR and spatial resolution (Supplementary Fig. S2c, e, f). Although this processing procedure with 3×3 binning provided acceptable CNR for fitting CEST spectra with Lorentzian line shapes, the binning process reduced the spatial resolution to 750 μm. Therefore, we performed pixel averaging using a Gaussian low-pass filter and then performed the cubic spline smoothing and Lorentzian line shape fitting (Fig. 3b and Supplementary Fig. S1b). This procedure retained the 250-μm spatial resolution of the original MR image and was used for all subsequent analyses. The procedures with 3×3 binning and Gaussian low-pass filtering produced the same average pHe values, average standard deviation of spatial pHe distribution, and average percent uptake values (Table 1), which indicated that the Gaussian filtering did not affect the quantitative measurements.
Table 1.
Comparison of tumor models
| Measurement | Tumor model
|
p value | |
|---|---|---|---|
| MCF-7 | MDA-MB-231 | ||
| Average pHe | 6.70±0.08 | 6.80±0.05 | <0.001 |
| Average standard deviation of pHe distribution | 0.155±0.047 | 0.097±0.032 | <0.001 |
| Average percent uptake | 51.0±25.6 | 61.9±22.8 | 0.122 |
| Average tumor volume (mm3) | 517.4±555.8 | 188.8±272.6 | 0.037 |
B0 magnetic field inhomogeneity was evident across the image of each mouse including the tumor region, as indicated by the deviation of water chemical shift from 0.0 ppm (Fig. 3d and Supplementary Fig. S1c; similar results with 3×3 binning are shown in Supplementary Fig. S3a–c). However, the differences between the chemical shift of water and the chemical shifts of the CEST effects showed little deviation from the expected values of 4.2 and 5.6 ppm, which showed that our Lorentzian line shape fitting method correctly identified CEST peaks relative to water despite the presence of B0 inhomogeneity (Fig. 3e, f and Supplementary Fig. S1d,e). Similarly, variable endogenous T2 relaxation times were evident in the image as shown by the variability of the width of the direct saturation of water (Fig. 3g and Supplementary Fig. S1f; similar results with 3×3 binning are shown in Supplementary Fig. S3d–f). This T2 variability was more evident in the tumor tissue and other tissue regions relative to the regions of the bladder and phantom of iopromide, because these latter regions were more homogenous and more fluid, leading to lower B0 inhomogeneity and longer T2 relaxation times. Measurements of the line widths of the CEST effects at 4.2 and 5.6 ppm showed little deviation, which showed that the CEST effects were less sensitive to T2 relaxation in these tumor models (Fig. 3h, i and Supplementary Fig. S1g, h).
Comparison of Tumor pHe Measurements with AcidoCEST MRI and a Microsensor
We compared our tumor pHe measurements using acidoCEST MRI with tumor pHe measurements made with a pH microsensor (Fig. 2c). Assuming that the pH microsensor is the “gold standard,” the accuracy of the acidoCEST MRI method was determined to be 0.034 pH units. The pHe values for each tumor were not significantly different (p=0.14). The mean and median standard deviations of the pixelwise distributions of the acidoCEST MRI measurements of each tumor were both 0.13 pH units, respectively, and the mean and median standard deviations of the three microsensor measurements of each tumor were 0.12 and 0.10 pH units, which were not statistically different (p=0.72).
Only a subset of mice on a subset of days were measured with a microsensor, because the microsensor was mechanically fragile and frequently broke during use, despite being protected by a stainless-steel needle housing. Also, the fluorescent coating was scrubbed and damaged after repeated measurements, causing the microsensor’s measurements to become unreliable. Measurements made with a damaged microsensor were discarded. The insertion of the microsensor also caused necrosis, which demonstrated that the microsensor is invasive. The difficulty in measuring tumor pHe with a microsensor emphasizes the need for a noninvasive acidoCEST MRI method.
The microsensor measured tumor pHe values with “biopsy-style” sparse coverage. To account for this sparsity, we assumed that tumors with >50 % of the tumor area that had pHe values <7.0 would be sparsely sampled by the microsensor only in these acidic regions. Therefore, we calculated the average pHe of the tumor using all pixelwise pHe values below 7.0 when more than 50 % of the measured tumor area had pHe values below 7.0. We assumed that the other tumors with >50 % of the tumor area that had pHe values >7.0 would be sampled by the microsensor in any tumor region, so we calculated the average pHe of these tumors using all pixelwise pHe values above and below 7.0. With this consideration for “biopsy-style” sparse coverage of the microsensor, the pHe measurements with both methods were highly correlated (R2=0.74; R2=0.58 without this consideration as shown in Supplementary Fig. S4).
Comparison of Mouse Models with AcidoCEST MRI
We used MRI to measure tumor volume, which showed that the MCF-7 tumor model with estrogen supplement grew faster than the MDA-MB-231 tumor model (p value <0.01; Table 1 and Fig. 4d). The MCF-7 model was more acidic than the MDA-MB-231 model (p value <0.001; Table 1 and Fig. 4a). This result was similar to a previous observation that measured the average pHe of MCF-7 and MDA-MB-231 xenograft tumor models with 1H MRS of IEPA [24]. These results are consistent with the Warburg effect, because the faster growth of the MCF-7 model suggests a more rapid glycolytic metabolism that produces more lactic acid. We also observed that the spatial distribution of pixelwise tumor pHe values for the MCF-7 model was greater than the MDA-MB-231 model, as measured by the standard deviation of the pixelwise values in each tumor pHe map (Fig. 4b). These results suggest that the tumor microenvironment was more heterogeneous in the faster growing tumor model.
Fig. 4.
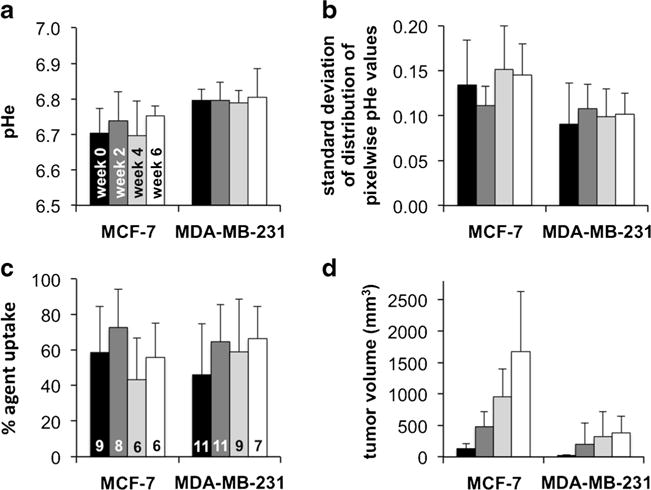
Longitudinal changes in tumor characteristics. No statistically significant longitudinal changes were observed in a average tumor pHe, b the distribution of pixelwise pHe values, or c percent agent uptake in the tumor during the 6-week study, for both tumor models. However, the MCF-7 model had lower pHe and higher standard deviation of pHe distribution relative to the MDA-MB-231 model. The bars of Fig. 4c are labeled with the number of mice tested each week for each tumor type. d Both tumor models grew in volume as expected.
Higher percent uptake of the agent during the MRI studies suggests higher vascular permeability that facilitates the uptake of nutrients into the tumor and may also suggest greater tumor angiogenesis [25]. Therefore, a higher percent uptake of the agent in the faster growing tumor model was expected. However, the percent uptake of the agent in both tumor models was not significantly different (Fig. 4c), indicating that the percent uptake value from acidoCEST MRI is not a reliable quantitative measurement and instead should be used only as a qualitative assessment. Also, the uptake of the agent at a level above the detection threshold was less than 100 % in all tumors, and therefore, the tumor pHe could only be evaluated in a subset of the tumor. This bias towards acidoCEST MRI measurements of tumor regions with higher uptake of iopromide may bias the average measurement of tumor pHe. Future developments of CEST MRI methodologies that improve detection sensitivity may improve the interrogation of the entire tumor with acidoCEST MRI [26].
Similar quantitative correlations between tumor pHe, percent uptake, and tumor size were not observed for individual mice. The MCF-7 tumors and MDA-MB-231 tumors reached their respective levels of pHe at a small size, and these tumors for individual mice maintained their respective acidity levels as the tumors grew (Fig. 5a). Similarly, each tumor model reached a level of acidity regardless of the level of percent uptake of the agent in the tumor, and this level of acidity did not change for each individual mouse (Fig. 5b). The percent uptake tended to be higher for larger tumors for the fast-growing MCF-7 model (Fig. 5c). No quantitative relationship between percent uptake and tumor size was observed for the slower growing MDA-MB-231 model (Fig. 5d). This last result reinforces that the percent uptake value from acidoCEST MRI should only be used for qualitative assessments.
Fig. 5.
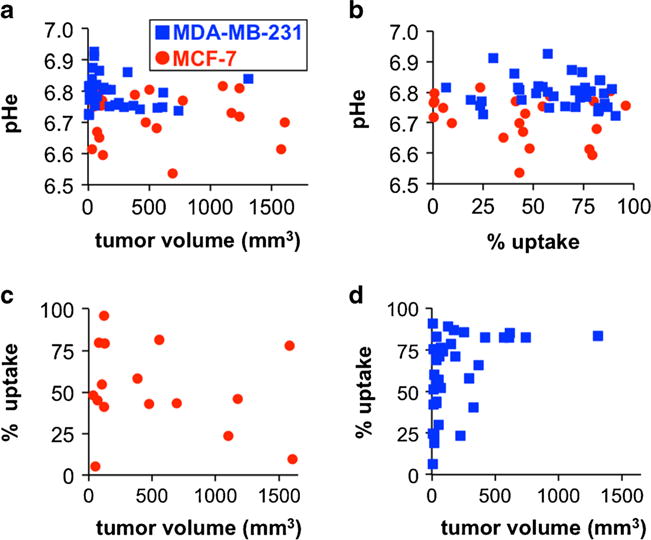
Tumor pHe was uncorrelated with a tumor volume and b percent uptake for both tumor models. c The percent uptake was not correlated with tumor volume for the MCF-7 model, d but percent uptake tended to be greater for larger MDA-MB-231 tumors. See also Supplementary Fig. S5 for a version with a log10 format for the x-axis for Fig. 5a, c, and d.
Discussion
Our study shows that acidoCEST MRI can accurately measure tumor pHe and can generate parametric maps of pHe values with excellent spatial resolution. AcidoCEST MRI improves on previous imaging methods that measure tumor pHe, because our MRI method is not limited to interrogating tumor surfaces; can measure tumor pHe with excellent spatial resolution; can measure tumor pHe in a concentration-independent manner; and can measure tumor pHe with preclinical MRI instrumentation that is readily available at many institutions.
As another advantage relative to previous imaging methods, acidoCEST MRI has strong potential to be translated to the clinic. The FISP MRI acquisition protocol is available for most clinical MRI scanners. Clinical CEST MRI protocols have been implemented to measure endogenous CEST effects in other organs [27, 28]. Although the RF saturation used for acidoCEST MRI raises safety concerns about the absorbance of high radio frequency energies in tissues, these other clinical CEST MRI protocols have used stronger saturation powers and longer saturation times than the saturation power and time used in our study. As a major advantage, iopromide is already approved for clinical X-ray and CT studies and is approved for i.v. injection into patients at a volume that is 4–5.5-fold higher than the amount used during our studies with mouse models, based on a ratio of body surface areas of mice and humans [21].
The acidoCEST MRI method has strong potential to be used for many studies with mouse models of human cancers. This report demonstrated that tumor pHe was not correlated with tumor size or percent uptake in xenograft models of MCF-7 and MDA-MB-231 mammary carcinoma. Therefore, pHe is an independent biomarker of the tumor microenvironment. Additional studies are warranted to determine if tumor pHe is correlated with biomarkers associated with acidosis such as carbonic anhydrase IX [29] or if tumor pHe is linked to hypoxia [30]. Additional studies with other xenograft, orthotopic, and transgenic models are warranted to determine if tumor location within the mouse model affects tumor pHe. These studies may be useful for ensuring that an appropriate mouse model is selected for each cancer biology study.
AcidoCEST MRI may have particular utility for predicting chemotherapeutic efficacy before a drug treatment is initiated. As shown in this study, the MCF-7 mouse model had a significantly lower average tumor pHe relative to the MDA-MB-231 mouse model. Tumor acidosis can cause chemoresistance to weak-base drugs and may potentiate the efficacy of weak-acid drugs [3, 4]. Therefore, preclinical studies of pH-dependent drugs should select a mouse model with an appropriate tumor pHe for best results. When acidoCEST MRI is translated to the clinic, clinical trials may stratify patient populations based on tumor pHe to properly assess pH-dependent drugs. Furthermore, an individual patient’s tumor pHe may provide decisive evidence for prescribing a weak-base or weak-acid drug, which can provide the paradigm of personalized medicine for each individual patient [31]. For these many reasons, acidoCEST MRI may have great potential to impact patient care.
Supplementary Material
Acknowledgments
This research was supported by the Phoenix Friends of the Arizona Cancer Center, the Community Foundation of Southern Arizona, and the Better Than Ever Program, R01CA167183-01 and P50 CA95060. L.Q.C. was supported through the Anne Rita Monahan Foundation. K.M.J. was supported through the Cardiovascular Biomedical Engineering Training Grant, T32HL007955. B.M. was supported through the NIH Minority Access to Research Careers grant T34 GM008718. The authors acknowledge the assistance of the Experimental Mouse Shared Services of the University of Arizona Cancer Center.
Footnotes
Electronic supplementary material The online version of this article (doi:10.1007/s11307-014-0816-2) contains supplementary material, which is available to authorized users.
Conflict of Interest. The authors declare no conflicts of interest.
References
- 1.Gillies R, Raghunand N, Karczmar G, Bhujwalla ZM. MRI of the tumor microenvironment. J Magn Reson Im. 2002;16:430–50. doi: 10.1002/jmri.10181. [DOI] [PubMed] [Google Scholar]
- 2.Warburg O. On the origin of cancer cells. Science. 1956;123:309–14. doi: 10.1126/science.123.3191.309. [DOI] [PubMed] [Google Scholar]
- 3.Mahoney BP, Raghunand N, Baggett B, Gillies RJ. Tumor acidity, ion trapping and chemotherapeutics. I. Acid pH affects the distribution of chemotherapeutic agents in vitro. Biochem Pharmacol. 2003;66:1207–18. doi: 10.1016/s0006-2952(03)00467-2. [DOI] [PubMed] [Google Scholar]
- 4.Raghunand N, Mahoney BP, Gillies RJ. Tumor acidity, ion trapping and chemotherapeutics. II. pH-dependent partition coefficients predict importance of ion trapping on pharmacokinetics of weakly basic chemotherapeutic agents. Biochem Pharmacol. 2003;66:1219–29. doi: 10.1016/s0006-2952(03)00468-4. [DOI] [PubMed] [Google Scholar]
- 5.Ashby BS. pH studies in human malignant tumours. Lancet. 1966;288:312–5. doi: 10.1016/s0140-6736(66)92598-0. [DOI] [PubMed] [Google Scholar]
- 6.Martin GR, Jain RK. Noninvasive measurement of interstitial pH profiles in normal and neoplastic tissue using fluorescence ratio imaging microscopy. Cancer Res. 1994;54:5670–4. [PubMed] [Google Scholar]
- 7.Dellian M, Helmlinger G, Yuan F, Jain RK. Fluorescence ratio imaging of interstitial pH in solid tumours: effect of glucose on spatial and temporal gradients. Br J Cancer. 1996;74:1206–15. doi: 10.1038/bjc.1996.518. [DOI] [PMC free article] [PubMed] [Google Scholar]
- 8.Khramtsov VV, Grigor’ev IA, Foster MA, et al. Biological applications of spin pH probes. Cell Mol Biol. 2000;46:1361–74. [PubMed] [Google Scholar]
- 9.Gallagher FA, Kettunen MI, Day SE, et al. Magnetic resonance imaging of pH in vivo using hyperpolarized 13C-labelled bicarbonate. Nature. 2008;453:940–3. doi: 10.1038/nature07017. [DOI] [PubMed] [Google Scholar]
- 10.Vāvere AL, Biddlecombe GB, Spees WM, et al. A novel technology for the imaging of acidic prostate tumors by positron emission tomography. Cancer Res. 2009;69:4510–6. doi: 10.1158/0008-5472.CAN-08-3781. [DOI] [PMC free article] [PubMed] [Google Scholar]
- 11.Visser EP, Disselhorst JA, Brom M, et al. Spatial resolution and sensitivity of the Inveon small-animal PET scanner. J Nucl Med. 2009;50:139–47. doi: 10.2967/jnumed.108.055152. [DOI] [PubMed] [Google Scholar]
- 12.Gillies RJ, Liu Z, Bhujwalla Z. 31P-MRS measurements of extracellular pH of tumors using 3-aminopropylphosphonate. Am J Physiol. 1994;267:C195–203. doi: 10.1152/ajpcell.1994.267.1.C195. [DOI] [PubMed] [Google Scholar]
- 13.Martinez GV, Zhang X, Garcia-Martin ML, et al. Imaging the extracellular pH of tumors by MRI after injection of a single cocktail of T1 and T2 contrast agents. NMR Biomed. 2011;24:1380–91. doi: 10.1002/nbm.1701. [DOI] [PMC free article] [PubMed] [Google Scholar]
- 14.Yoo B, Pagel MD. An overview of responsive MRI contrast agents for molecular imaging. Front Biosci. 2008;13:1733–52. doi: 10.2741/2796. [DOI] [PubMed] [Google Scholar]
- 15.Hingorani DV, Randtke EA, Pagel MD. A catalyCEST MRI contrast agent that detects the enzyme-catalyzed creation of a covalent bond. J Am Chem Soc. 2013;135:6396–8. doi: 10.1021/ja400254e. [DOI] [PMC free article] [PubMed] [Google Scholar]
- 16.Liepinsch E, Otting G. Proton exchange rates from amino acid side chains—implications for image contrast. Magn Reson Med. 1996;35:30–42. doi: 10.1002/mrm.1910350106. [DOI] [PubMed] [Google Scholar]
- 17.Ward KM, Balaban RS. Determination of pH using water protons and chemical exchange dependent saturation transfer (CEST) Magn Reson Med. 2000;44:799–802. doi: 10.1002/1522-2594(200011)44:5<799::aid-mrm18>3.0.co;2-s. [DOI] [PubMed] [Google Scholar]
- 18.Aime S, Barge A, Delli Castelli D, et al. Paramagnetic lanthanide(III) complexes as pH-sensitive chemical exchange saturation transfer (CEST) contrast agents for MRI applications. Magn Reson Med. 2002;47:639–48. doi: 10.1002/mrm.10106. [DOI] [PubMed] [Google Scholar]
- 19.Liu G, Li Y, Sheth VR, Pagel MD. Imaging in vivo extracellular pH with a single PARACEST MRI contrast agent. Mol Imaging. 2012;11:47–57. [PMC free article] [PubMed] [Google Scholar]
- 20.Longo DL, Dastrù W, Digilio G, et al. Iopamidol as a responsive MRI-chemical exchange saturation transfer contrast agent for pH mapping of kidneys: in vivo studies in mice at 7 T. Magn Reson Med. 2011;65:202–11. doi: 10.1002/mrm.22608. [DOI] [PubMed] [Google Scholar]
- 21.Chen LQ, Howison CM, Jeffery JJ, et al. Evaluations of extracellular pH within in vivo tumors using acidoCEST MRI. Magn Reson Med. 2013 doi: 10.1002/mrm.25053. [DOI] [PMC free article] [PubMed] [Google Scholar]
- 22.Stancanello J, Terreno E, Castelli DD, et al. Development and validation of a smoothing-splines-based correction method for improving the analysis of CEST-MR images. Contrast Media Mol Imaging. 2008;3:136–49. doi: 10.1002/cmmi.240. [DOI] [PubMed] [Google Scholar]
- 23.Liu G, Ali M, Yoo B, et al. PARACEST MRI with improved temporal resolution. Magn Reson Med. 2009;61:399–408. doi: 10.1002/mrm.21863. [DOI] [PMC free article] [PubMed] [Google Scholar]
- 24.Bhujwalla ZM, Artemov D, Ballesteros P, et al. Combined vascular and extracellular pH imaging of solid tumors. NMR Biomed. 2002;15:114–9. doi: 10.1002/nbm.743. [DOI] [PubMed] [Google Scholar]
- 25.Ocak I, Baluk P, Barrett T, et al. The biologic basis of in vivo angiogenesis imaging. Frontiers Biosci. 2007;12:3601–16. doi: 10.2741/2337. [DOI] [PubMed] [Google Scholar]
- 26.Liu G, Song X, Chan KWY, McMahon MT. Nuts and bolts of chemical exchange saturation transfer MRI. NMR Biomed. 2013;26:810–28. doi: 10.1002/nbm.2899. [DOI] [PMC free article] [PubMed] [Google Scholar]
- 27.Sun PZ, Benner T, Kumar A, Sorensen AG. Investigation of optimizing and translating pH-sensitive pulsed-chemical exchange saturation transfer (CEST) imaging to a 3 T clinical scanner. Magn Reson Med. 2008;60:834–41. doi: 10.1002/mrm.21714. [DOI] [PMC free article] [PubMed] [Google Scholar]
- 28.Zhou J, Blakeley JO, Hua J, et al. Practical data acquisition method for human brain tumor amide proton transfer (APT) imaging. Magn Reson Med. 2008;60:842–9. doi: 10.1002/mrm.21712. [DOI] [PMC free article] [PubMed] [Google Scholar]
- 29.Chiche J, Ilc K, Laferriere J, et al. Hypoxia-inducible carbonic anhydrase IX and XII promote tumor cell growth by counteracting acidosis through the regulation of the intracellular pH. Cancer Res. 2009;69:358–68. doi: 10.1158/0008-5472.CAN-08-2470. [DOI] [PubMed] [Google Scholar]
- 30.Gillies RJ, Gatenby RA. Hypoxia and adaptive landscapes in the evolution of carcinogenesis. Cancer Met Rev. 2007;26:311–7. doi: 10.1007/s10555-007-9065-z. [DOI] [PubMed] [Google Scholar]
- 31.Jingjing L, Feng F, Zhengyu J. Cancer diagnosis and treatment guidance: role of MRI and MRI probes in the era of molecular imaging. Curr Pharma Biotech. 2014;14:714–22. doi: 10.2174/1389201014666131226105916. [DOI] [PubMed] [Google Scholar]
Associated Data
This section collects any data citations, data availability statements, or supplementary materials included in this article.