

Abstract
The fat mass and obesity associated gene (FTO) has previously been associated with a variety of diseases and conditions, notably obesity, acute coronary syndrome and metabolic syndrome. Reports describing mutations in FTO as well as FTO animal models have further demonstrated a role for FTO in the development of the brain and other organs. Here, we describe a patient born of consanguineous union who presented with microcephaly, developmental delay, behavioral abnormalities, dysmorphic facial features, hypotonia, and other various phenotypic abnormalities. Whole exome sequencing revealed a novel homozygous missense mutation in FTO and a nonsense mutation in the cholesteryl ester transfer protein (CETP). Exome CNV analysis revealed no disease causing large duplications or deletions within coding regions. Patient’s, her parents’ and non-related control’ fibroblasts were analyzed for morphologic defects, abnormal proliferation, apoptosis and transcriptome profile. We have shown that FTO is located in nucleus of cells from each tested samples. Western blot analysis demonstrated no changes in patient FTO. Q-PCR analysis revealed slightly decreased levels of FTO expression in patient cells compared to controls. No morphological or proliferation differences between the patient and control fibroblasts were observed. There is still much to be learned about the molecular mechanisms by which mutations in FTO contribute to such severe phenotypes.
Introduction
The fat mass and obesity associated (FTO) gene was the first gene locus reported to be associated with body weight and metabolic disorders 1–5. Since then, a cluster of common variants in the first, and largest, intron of FTO have been described across multiple populations of different ethnicities 6–9. Recently, Boissel et al. described a consanguineous Palestinian-Arab family with a homozygous non-synonymous FTO mutation that led to an inherited life-threatening disease in nine family members – this was the first report of a homozygous FTO mutation in the literature. The identified mutation resulted in an arginine to glutamine change at position 316 (R316Q) thereby rendering FTO catalytically inert 10. The affected family members suffered from postnatal growth retardation, head and face dysmorphisms, severe psychomotor delay, functional cognitive deficits, and, in some patients, brain malformations, cardiac defects, genital abnormalities, and cleft palates. In all affected individuals, death occurred within the first 30 months of life. In this report, we describe a patient with a novel homozygous missense mutation in FTO. We further discuss the phenotypic expression of this mutation.
Materials and Methods
Ethics Statement
The study protocol was approved by the Yale School of Medicine Human Investigation Committee (HIC) (protocol number 0908005592). Institutional review board approval for genetic and MRI studies and written consent from all study subjects, were obtained by the referring physicians at participating institutions.
DNA Extraction
Blood samples were collected from patients and their parents. DNA was extracted from the blood using the commercially available Gentra Puregene Blood Kit from Qiagen.
Whole Genome Genotyping
Samples were analyzed using 610K Quad Bead Chips according to the manufacturer’s protocol (Illumina).
Whole Exome Capture and Sequencing
Exome capture for the index case was performed using the NimbleGen 2.1M human exome array (Roche Nimblegen, Inc.) according to the manufacturer’s protocol along with modifications previously described in the literature 11, 81. Exome library sequencing was performed using the HiSeq2000 with barcoding technology, paired end analysis, and six samples per lane. Image analysis and subsequent base calling was performed using the Illumina pipeline (version 1.8).
Exome Data Analysis
Analysis of the sequencing data was performed according to the previously described bioinformatics pipeline devised by our research team 82.
Sanger Sequencing
Coding regions and exon-intron boundaries of FTO were evaluated by Sanger sequencing using standard protocols. Amplicons were cycle sequenced on ABI 9800 Fast Thermo cyclers, and post cycle sequencing clean-up was carried out with the CleanSEQ System (Beckman Coulter Genomics). The amplicons were analyzed on 3730×L DNA Analyzer (Applied Biosystems Inc.).
Copy Number Variation (CNV) Analysis
The depth of coverage log ratio between the patient and control samples was calculated using the GATK-Depth of Coverage tool. Segments with CNVs were identified from the log ratio of the depth of coverage using the ExomeCNV R package 83. False positive CNV events were identified and corrected for by calculating minor allele frequencies (BAF) in each CNV segment.
Co-Expression Analysis
Co-expression patterns were analyzed using the Database for Annotation, Visualization and Integrated Discovery (DAVID) v6.7 84. Interrogation and procurement of results were performed using previously established protocols 12, 13.
Skin Biopsy and Fibroblast Culture
Four millimeter skin punch biopsies were obtained from the umbilical area of the patient (NG1305-1), her parents (NG1305-2 and NG1305-3) as well as from control individuals using a standardized procedure 85, 86. Samples were maintained in 50 ml conical tubes filled with Dulbecco’s Modified Eagle Medium (DMEM; Gibco, cat. no. 11965-084) supplemented with 10% heat-inactivated fetal bovine serum (FBS; Gibco, cat. no. 10438-026), 1% (1x) L-glutamine (Gibco, cat. no. 25030-081), and 2% (1x) Penicillin-Streptomycin (Gibco, cat. No. 15140-122), and subsequently transported to the laboratory for culture. Once they arrived in the laboratory, samples were washed at least three times in PBS (Sigma Chemical Co., Saint Louis, USA). Samples were cut into small fragments and placed in 100 mm2 Petri dishes, which were maintained for 30 minutes semi-opened in laminar flow to allow specimens to adhere to the dish surface. Afterwards, 10 ml of culture medium containing DMEM supplemented with 10% heat-inactivated fetal bovine serum, 1% (1x) L-glutamine, 1% (1x) Penicillin-Streptomycin at 37°C, was added to the dish. Cultures were maintained in a humidified incubator at 37°C, under 5% CO2 in air. The culture medium replaced initially after two days and, subsequently changed three times a week. Fibroblasts began to emerge from the biopsy fragments within in 7–9 days. Subculture (passage) of fibroblasts was performed at 70% cellular confluence.
Once there were sufficient cells, enzymatic detachment was performed using 0.25% Trypsin-EDTA (1X) (Gibco, cat. no. 25200-056) and cells were plated in 25 cm2 culture flasks for additional proliferation. Primary fibroblasts were grown at 37°C in 5% CO2 and medium was changed every two days. Cells were passaged using trypsin at approximately 70% confluence and either harvested for cryopreservation or reseeded for further proliferation. Early passages of fibroblasts were used for cell-based functional assays.
Population Doubling Assay
Cells were trypsinized upon confluency and 2000 cells per well were seeded in 135 microliters of medium. There were nine wells per individual (NG1305-1, NG1305-2, NG1305-3, CTRL-1, CTRL-2 and CTRL-3) included on a 96 well-plate. A separate plate of cells was also included using serial dilutions of cells for calibration curve. After 2nd, 5th, 7th, 9th and 11th days of incubation, we performed a CellTiter-Glo® Luminescent Cell Viability Assay (Promega). Luminescence was read using the GloMax®-Multi Detection System (Promega) and data was analyzed with Graphpad Prism software.
Fibroblast Morphology and Apoptosis Assay
Fibroblasts were seeded in 24-well plates and images were obtained on the 2nd, 5th, 7th, 9th and 11th days using an inverted microscobe at 20× magnification. Apoptosis was evaluated with an Annexin V-FITC and 7-amino-actinomysin (7-AAD) dye kit (Ebioscience) according to manufacturer’s protocol. Briefly, cells were harvested and washed in 1X PBS, and then resuspended in 1X Binding Buffer at 1–5×10⁶ cells/mL. 5 μL of fluorochrome-conjugated Annexin V was added to 100 μL of the cell suspension, which was then incubated 10–15 minutes at room temperature and protected from light. Cells were subsequently washed with 2 mL of 1X Binding Buffer and resuspended in 200 μL of 1X Binding Buffer. 5 μL of 7-AAD viability staining solution was added to the solution, which was stored at 2–8°C in the dark, and analyzed within 4 hours using flow cytometry.
Immunohistochemistry and Immunostaining
For immunohistochemistry of fibroblasts from extracted skin biopsies of index case, her parents and control sample were fixed in 3.6% formaldyhyde and washed three times with PBS. Then cells were exposed to 0.3% Triton X-100 (Sigma Chemical) in phosphate buffered saline for 1 minutes and then washed two times with PBS. Cells were blocked in blocking solution containing 1X phosphate buffered saline (PBS), 5% normal bovine serum, 5% normal goat serum, 5% normal donkey serum and 0.1% Tween for half an hour at room temperature. After blocking, specimen were extensively washed in PBS and incubated with primary antibodies diluted in blocking solution on a horizontal shaker overnight at 4°C, and washed in PBS at room temperature for three times. Cells were then incubated with secondary antibodies in blocking solution for 1 hours and washed in PBS for three times at room temperature, then washed and imaged with Zeiss microscopy system. Primary antibody used for immunohistochemistry are: a custom rabbit anti–recombinant mFTO antibody (1:100 dilution). Alexa Fluor®488 Donkey Anti-Rabbit IgG (H+L) Antibody (A-21206, Life technologies) was used as secondary antibody.
Western Blot Analysis
Protein expression was analyzed by Western blot analysis as described previously 87. Proteins were extracted from fibroblasts of patient, her father and mother and control subject, then protein blots were performed on 40 μg of total proteins. The primary antibodies used were as follows: a custom rabbit anti–recombinant mFTO antibody (1:100 dilution), anti-glyceraldehyde 3-phosphate dehydrogenase (1:100 dilution, Rabbit, catalog no.: sc-25778, Santa Cruz Biotechnology, Santa Cruz, CA). The horseradish peroxidase (HRP)-conjugated secondary antibody used was as AffiniPure goat-anti-rabbit IgG FC-fragment was used (Jackson, West Grove, PA #111-035-046).
RNA Extraction, cDNA Synthesis and Quantitative PCR analysis
FTO mRNA expression in affected individual, both parents and control sample (individual of the same ethnicity and without a FTO sequence variant is used as control) was assessed by real-time-PCR (RT-PCR). Total RNA was isolated using miRNeasy Mini Kit (Qiagen; catalog no.: 24104) from fibroblasts according to the manufacturer’s instructions and transcribed into complementary DNA (cDNA) as described previously (Applied Biosystems; catalog no.:4374966). RNA quantity was assessed using a NanoDrop spectrophotometer for cDNA synthesis. Quantitative PCR (qPCR) analysis was performed using FastStart Universal SYBR Green Master Mix (Roche; catalog no.: 04913914001). Two different FTO and the reference gene TBP (TATA box-binding protein) primers were used and the PCR efficiency of >90% (slope= −3.2 and −3.6) and R2 99% obtained. Relative changes in gene expression were analyzed with the ΔCT method 88.
Transcriptome Analysis
To further characterize the effects of the FTO mutation in the family, RNA was extracted from these fibroblast cultures and RNA expression analysis using Illumina HumanHT12.v4 chips was performed on patient, father and mother samples and analyzed using the DAVID platform. Briefly, data is normalized using normal-exponential convolution model-based background correction and quantile normalization using the limma R package. The normalized data for 3 samples were used to perform an unsupervised hierarchical clustering using the euclidean distance as the dissimilarity metric and the average agglomerative method for clustering.
Results
Clinical Report
We report the case of a five year-old female (NG1305-1) presented with a dysmorphic face and developmental delay. She was the first child born of a consanguineous union (parents were second cousins) (Fig. 1). She was born at 40 weeks gestation with 2460 g (3rd percentile) and 50 cm long (50th percentile). Her head circumference at birth was not recorded. She was immediately admitted to the neonatal intensive care unit after birth due to respiratory distress and concern given her dysmorphic facial features. During her hospitalization she began to have seizures that were managed with antiepileptic medications. She was subsequently discharged, but was later admitted at nine and a half months-old. At this time, her weight was 7650 g (10th percentile), height was 66 cm (3rd percentile), and head circumference was 41 cm (<2nd percentile). On examination, she was hypertonic and lacked the ability to control her head movements. She was microcephalic, had sparse hair and eyebrows, a prominent metopic ridge, an asymmetric skull, esotropia of her right eye, hypotelorism, a long philtrum, microretrognathia, a high palate, a prominent alveolar ridge, anteverted nostrils, a thin vermillion and lips, and a short neck (Fig. 1B). She was noted to have hepatosplenomegaly and diastasis recti. Laboratory workup revealed high AST (70 U/L), ALT (57 U/L), and CK (1191 U/L) levels. Eye examination demonstrated bilateral nystagmus, iris nodules, posterior synechia, and astigmatism. Assessment of auditory brainstem responses demonstrated bilateral conductive and sensorineural hearing loss. At 19 months of age the patient’s weight was 11 kg (<3rd percentile), height was 83.5 cm (<3rd percentile), and head circumference was 45cm (<3rd percentile). In addition to the previously noted physical exam findings, she was now also found to have difficulty swallowing. An echocardiogram was performed and demonstrated normal cardiac anatomy and function. Upper endoscopy revealed grade 1 esophageal varices. A head CT demonstrated prematurely closed metopic sutures (craniosynostosis). A brain MRI revealed a thin corpus callosum. Chromosomal analysis demonstrated a normal female karyotype. In addition to the physical exam abnormalities, the patient also demonstrated developmental delay with respect to reaching milestones – she did not develop head control until after 10 months of age, began sitting without support at 2 years-old, and walking at 4 years-old. Throughout this time, her AST, ALT and CK all remained abnormally elevated. A liver biopsy was performed but did not show any abnormalities; EMG was unremarkable. At 3 years-old, Denver testing confirmed severe developmental delay and the Wechsler Intelligence Scale for Children-Revised showed profound intellectual disability (IQ:23). At 4 years and 9 months, the patient’s weight was 15 kg (10th percentile), height was 97cm (3rd-10th percentile), and head circumference was 46cm (<3rd percentile). She was microcephalic, could walk with support, and spoke a few words. The patient also continued to have bilateral nystagmus, brachydactyly and hepatosplenomegaly. Labs demonstrated a high CK (816 U/L, normal <170), normal total cholesterol (173 mg/dl, normal 114–200), low LDL cholesterol (30 mg/dl, normal 63–130), and high HDL cholesterol (136 mg/dl, normal 30–75) (S1 Table).
Figure 1. I Phenotypic and molecular studies has been performed on materials obtained from index patient, parents and control samples.

A. Pedigree of the family. B. Clinical pictures of the patient (upper right panels) when she was 9 month-old (upper panels), 2 and half years old (left lower panel) and 4 and nine month-old (right lower panel). C and D. Representative sequence alignment figures cover the mutations in FTO and CETP, respectively. The top line in each panel represents the non-mutated reference sequence. The subsequent lines below the reference lines depict the results from exome sequence. Each line represents a distinct coverage read. Mean 20x coverage of all bases was above 81% for index patient. E and F. Chromatogram illustrations of FTO and CETP obtained via Sanger sequencing analysis of the index patient analyzed via whole-exome sequencing (NG1305-1) and her parents. Note that the respective mutations identified via whole-exome sequencing were confirmed as homozygous mutations in the index patient and as heterozygous in her parents. DNA from healthy individuals was also Sanger sequenced and these results are included as controls. G. CNV Segment Detection of NG1305-1: The log ratio comparing NG1305-1 and control sequence depths of coverage for each exon are depicted as gray dots. The black lines demonstrate regions of segmented copy neutral events, green lines are segmented deletion events and red lines are amplification events. H. mRNA levels of FTO in fibroblast cells were extracted from homozygous patient, heterozygous parents and control individual-same ethnicity and without a sequence variant- were analyzed using RT-PCR. I. The figure depicts FTO staining in patient fibroblasts. Significant nuclear accumulation is noted. J. Western blot of FTO and as an internal control GAPDH in patient, parental and control cells. No difference was detected.
She was last time evaluated 5.5 years of age. She developed seizures at 5 years old and electroencephalogram demonstrated that high amplitude and irregular waves and spikes being more prominent on the right side of posterior temporal occipital region. After seizures she lost the ability to assisted walk assisted and spoken a few words. Six months after seizure when she was 5 years, 6 months old, she gained the ability of walk with support, however speech never came back. Her weight was 19kg (25–50th percentile), height was 100.5cm (3rd–10th percentile), and head circumference was 47cm (<3rd percentile). She had also suck/swallowing disorders, frequent drooling and protruding tongue. Physical exam was also remarkable for enlargement of both her liver and spleen (5 cm and 4 cm below costal margin, respectively). Repeated blood tests demonstrated a normal AST (29 U/L) and ALT (29 U/L) levels, high CK (587 U/L, normal <174), normal total cholesterol (153 mg/dl, normal 114–200), and high HDL cholesterol (127 mg/dl, normal 30–75). In addition, she demonstrated abnormal behavior phenotype such as repetitive hand movements, frequent laughter/smiling, apparent happy demeanor and short attention span. Evoked response audiometry (ERA) revealed that moderate hearing loss at right ear and mild hearing loss at left ear. Intriguingly, her father and mother had obesity, both weight were 100 kg. The father’s height was 169 cm and the mother’s height was 161 cm, father’s head circumference was 58 cm, and mother’s was 55 cm. Blood biochemistry analysis for parents of the patient revealed high total cholesterol levels (father 264 mg/dl, and mother 240 mg/dl), and high LDL cholesterol levels (father 169 mg/dl, mother 142.2 mg/dl) in both parents, however in father triglyceride levels also was found to be high (180 mg/dl). We also have found high HgA1c level (6.4) in father which indicates increased risk for type 2 diabetes. Both parents’ blood HDL, glucose, cortisol and insulin levels were found within normal limits. Blood CPK level was normal for mother however was found to be high in father (438 mcg/L) which may be found high levels in different situations such as heart attack, myaocarditis, myopathy, hypo/hyperthyroidism etc. where problems occured normally found organs in where is mainly in the heart, brain, and skeletal muscle.
Whole Genome Genotyping and Whole Exome Sequencing
Whole genome genotyping was performed and the inbreeding coefficient for the patient (NG1305-1) was determined to be 0.01. Homozygous genomic segments (>2.5 cM each) were identified (S2 Table) and whole exome capture and sequencing of the patient’s germ line DNA (S3 Table) was used to search for disease causing mutations within these regions 11.
Variant analysis identified only 2 homozygous novel mutations located within the aforementioned regions of homozygosity (S4 Table) (Fig. 1). The first was a homozygous missense mutation (ENST00000471389.1:c.812A>C) within the FTO (fat mass and obesity associated) coding sequence at position 53,878,127 on chromosome 16. This mutation resulted in a histidine to proline change at position 271 (ENSP00000418823.1:p.His271Pro) in the amino acid sequence of the FTO protein. This FTO mutation has not been previously reported in the dbSNP, NHLBI GO ESP Exome Variant Server, or 1000 Genomes databases, nor has it been observed within the cohort of 3,000 subjects with non-neurological diseases who have been whole-exome sequenced at the Yale School of Medicine. When we interrogated these databases for the mutational burden of FTO, we found no instances of homozygous deleterious mutations in FTO.
The other detected mutation (ENST00000566128.1:c.1207C>T) was in the CETP (cholesteryl ester transfer protein, plasma) gene at position 57,017,318 on chromosome 16, resulting in an early protein truncation and likely subsequent nonsense mediated decay (ENSP00000456276.1:p.Arg403X).
Sanger sequencing of the entire coding region of FTO and CETP in the patient’s parents revealed that both were heterozygous for the identified mutations (Fig. 1). The parents were then reexamined for metabolic findings previously reported in association with FTO mutations but both were healthy and had no evidence of abnormal metabolic functioning. The patient’s exome data was analyzed for large scale CNV events, and no disease causing large duplications or deletions within coding regions were identified (Fig. 1).
Co-Expression Data Analysis
Using the Human Brain Transcriptome database 12, we investigated the spatial and temporal changes in the FTO expression during human cortical development. FTO mRNA is expressed throughout the entire brain with marked expression in the fetal cortex and cerebellum. This expression remains robust in the adult brain (S1 Fig.) 12.
We next performed co-expression analysis on FTO 12, 13 (S5 and S6 Tables). We observed that FTO expression patterns positively correlate with the expression patterns of genes involved in the ubiquitin mediated proteolysis pathway such as HUWE1, UBE3B, and others. We also found that FTO expression patterns positively correlate with genes in which mutations cause either neurodevelopmental disorders such as MECP2 (Rett syndrome, MIM:312750) and GDI1 (Mental retardation, X-linked 41, MIM:300849), or hearing impairment such as HARS (Usher syndrome type 3B, MIM:614504).
Q-PCR, Western Blot, and Immunohistochemistry
We have shown that FTO is located in nucleus of cells from the patient, her parents, and non-related controls (Fig. 1). Western blot analysis demonstrated no changes in patient FTO, as expected given the observed mutation. Q-PCR analysis revealed slightly decreased levels of FTO expression in patient cells compared to controls (Fig. 1).
Transcriptome Analysis
Interestingly, we found that type 2 diabetes associated genes (insulin-like growth factor binding protein 2, 36kDa and neurocanthocytosis), retinol metabolism genes (ALDH1A1, DHRS3 and RDH10), renin angiotensin system genes (AGT and MME), and genes related to metabolism of xenobiotics by cytochrome P450 (ALDH1A3, GSTT1 and MGST1) demonstrated at least a twofold increase in relative expression in the patient’s fibroblasts compared to her parents’ and controls’ fibroblasts. Conversely, cell cycle genes (E2F2, BUB1, CDC20 and CCNB1), and obesity susceptibility genes (including ADRB2, ENPP1) demonstrated a relative decrease level of expression of at least 2-fold in the patients cells relative to her parents’ and controls’ samples.
Fibroblast Morphology, Population doubling, and Apoptosis Assays
Fibroblast morphology was compared among the patient (NG1305-1), parent (NG1305-2 and NG1305-3), and control cultures at 11 days incubation. No morphological differences between the patient and control fibroblasts were observed (Fig. 2). The rates of apoptosis were assessed at five and nine days incubation; again, no differences were appreciated between patient and control fibroblasts (Fig. 3). In addition, fibroblasts were counted on the 2nd, 5th, 7th, 9th and 11th days and a growth curve was drawn (number of cells versus time) in order to calculate the population doublings (PD) from the exponential phase of the curve.
Figure 2. I Phenotypic and proliferation comparisons of fibroblasts extracted from index case, parents and control subjects.
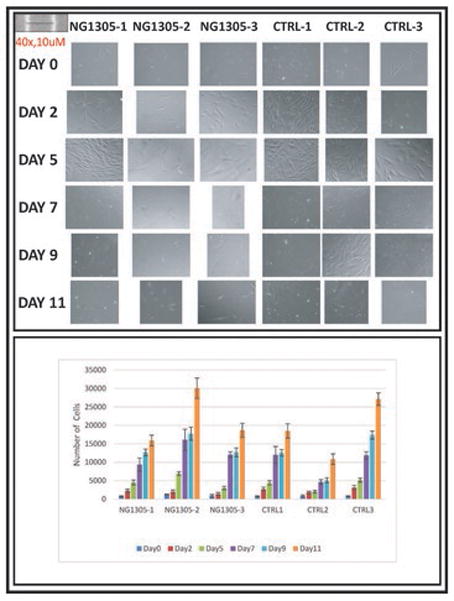
Upper panel shows comparison of fibroblast morphology of the patient, her parents and control fibroblasts. Images were taken after 2nd, 5th, 7th, 9th and 11thdays incubation under 20x objectives. Lower panel compares number of cells versus time in each study subject and there is no statistically difference between the patient and control samples.
Figure 3. I The flow cytometric analysis of apoptosis in fibroblast cells after three days incubation using FITC-annexin V and 7AAD double staining.

Quadrant analysis of the gated cells in FL-1 versus FL-3 channels was from 1,000 events. Annexin V+/7AAD− (lower left quadrant) areas stand for early apoptotic cells, and Annexin V+/7AAD+ (upper right quadrant) areas stand for late apoptotic or necrotic cells.
The PD, which occurred between the 5th and 11th days, was obtained using the equation: PD = (logN1/log2) - (logN0/log2), where N1 was the final and N0 was the initial cell count. There were no differences in proliferation between patient and control fibroblasts (Fig. 2, S7 Table).
Discussion
The FTO gene encompasses a large genomic region whose nine exons span more than 400 kb on chromosome 16q12.2 and encodes 505 amino acids FTO protein composed of two domains: an N-terminal domain carrying a catalytic core and a C-terminal domain of unknown function 14. In our patient, as well as in the previously reported case, the homozygous FTO mutation affected the catalytic domain of the protein. Using both bioinformatic and in vitro biochemical data, FTO was predicted and confirmed to be an AlkB family DNA/RNA demethylase 15–17. It has been known that the FTO protein localizes to the nucleus 15, 18, 19. However, recently Gulati et al. demonstrated that a fraction of FTO located in the cytoplasm and N-terminus of FTO is necessary for its ability to shuttle between the nucleus and cytoplasm 20, 21. Our IHC data demonstrating that FTO was localized to the nucleus of fibroblasts are consistent with this observation.
FTO expression begins early embryogenesis when it is ubiquitously expressed throughout the body, but it most highly expressed in the brain, which is consistent with the observation that multiple organ systems are affected by FTO deficiency 10, 15, 22. Similar to the FTO phenotype previously reported by Boissel et al., our patient also demonstrated intrauterine growth retardation, failure to thrive, hypertonicity, seizures, severe developmental delay, postnatal microbrachycephaly, dysmorphic craniofacium, sensory-neural hearing loss, and optic disc abnormality, a short neck, cutis marmorata, a PDA, drumstick fingers, brachydactyly. Interestingly, not all of the affected family members demonstrated all of these traits and our case’s clinical findings are less aggressive than Boissel et al cases’ especially the ones who dies due to recurrent infections. Our patient additionally had abnormal behavior phenotype including repetitive hand movements, frequent laughter/smiling, apparent happy demeanor and short attention span as well as other clinical findings such as hip dislocation, strabismus, a trigonocephaly, thin upper and lower lips, a long philtrum, and osteopenia.
Because of its well-known association with obesity, FTO is well-studied 23–49. Previous studies, have shown that even though some are predicted to have deleterious effects on FTO function, nonsynonymous mutations were equally common in both the obese and lean cohorts 50–52. Other studies in lean and obese cohorts of children brought similar findings. In both African American and Chinese Han populations, variants were identified in FTO, but the overall frequencies were similar in case and control, with none conferring risk of obesity 53, 54.
Further, Boissel et al. reported none of the parents were appeared to be obese and detailed phenotypic data on the extended family has not been reported, in our case both of the parents of the affected children were obese, interestingly based on international diabetes foundation’s (IDF) metabolic syndrome criteria, patients’ father diagnosed as a metabolic syndrome due to his increased wrist circumference and blood pressure and high trigliceride level. Since patient’s mother is also carrier for same FTO gene variant, father’s metabolic syndrome may be caused by either environmental factors and/or sex selection for the metabolic result of FTO variant.
Variants in FTO and its association with various human phenotypes continue to emerge 6, 7, 9, 11, 55–63. Intriguingly, in humans with loss-of-function mutations in FTO share phenotypic features of cases with partial trisomies of chromosome 16q including the FTO gene such as learning difficulties and behavioral problems 64, 65.
Boissel et al. demonstrated changed morphology, impaired proliferation and accelerated senescence in cultured skin fibroblasts from affected subjects. Although we did not test senescence, we were not able to detect any abnormalities in either morphology or proliferation in the patient fibroblast cultures compared to either parent or control fibroblasts. Given that we did not detect any defects in proliferation, we also tested for variability in the rates of apoptosis, and again did not see any statistically significant differences between the patient and parental.
Our patient was found to have a novel homozygous nonsense mutation in CETP, resulting in a truncated 403 amino acid protein (compared to the normal 476 amino acid protein), and likely causing a complete CETP deficiency. Human CETP is a 74kDa plasma glycoprotein that facilitates the transfer of cholesteryl esters between lipoproteins 68, 69. Genetic deficiency of cholesteryl ester transfer protein (CETP) (OMIM 607322) is well known cause of primary, also known as familial, hyperalphalipoproteinemia (HALP), and results in elevated plasma HDL (2–5× increase in the homozygous and 25–80% greater in the heterozygous genotype) and decreased LDL 70–72 and it is mostly detected in the Japanese population more than Caucasians 72–74. In Caucasians only a few cases of HALP due to CETP mutations have been reported 75–79. Despite the high HDL-C levels in patients with CETP deficiency, an increased risk of atherosclerotic coronary artery disease (CAD) has been reported 80. Our patient’s mutation in CETP was novel and laboratory findings fit with the genetic diagnosis.
Boissel et al. were the first to report its homozygous loss of function mutation as an example of a human disorder related to a defect in an AlkB-related protein. We describe the second novel homozygous missense mutation in FTO to be reported in the literature, in addition to a nonsense mutation in CETP. We further discuss some of the phenotypic consequences of such an FTO mutation. However based on studies conducted in human and other organisms fully functional FTO is critical for normal physiology and there is still much to be learned about the molecular mechanisms by which a mutation FTO leads to such a severe phenotype, as observed in our and previously reported patients.
Supplementary Material
Plasma lipid and protein levels of the NG1305 were correlated with CETF mutation that was found patient by whole exome sequencing.
Blocks of genomic homozygosity were identified via whole-genome genotyping obtained from index patient (NG1305-1). Chr – chromosome; SNP – single nucleotide polymorphism; cM – centimorgans; Mb – million base pairs.
Summary of sequencing quality metrics achieved by whole-exome sequencing performed on index patient (NG1305-1).
Summary of whole-genome genotyping and whole-exome sequencing results for index patient NG1305-1. Blocks of genomic homozygosity were identified via whole-genome genotyping. Homozygous variants were identified via whole-exome sequencing.
List of the top 100 genes with expression patterns that are positively correlated with FTO expression.
List of the top 100 genes with expression patterns that are negatively correlated with FTO expression.
Comparison of doubling time between the patient, parents and control samples in different incubation time points revealed no statistical differences.
Graph of FTO expression in various regions of the normal developing human brain over time. These data were obtained using the Human Brain Transcriptome database. Note that FTO is expressed throughout the all brain regions. Expression levels, except cerebellum, peak early in development, decrease slightly during fetal life, and then remain relatively constant throughout adult life. In cerebellum, expression levels of FTO decrease slightly during fetal life and remain high after birth and adult life.
Acknowledgments
We thank the family for participating in this study. We would like thank to Professor Roger Cox and Dr Chris Church for providing FTO antibody, Nihal Hatipoglu, Ketu Mishra and A. Gulhan Ercan-Sencicek for technical assistance.
References
- 1.Fawcett KA, Barroso I. The genetics of obesity: FTO leads the way. Trends Genet. 2010;26:266–274. doi: 10.1016/j.tig.2010.02.006. [DOI] [PMC free article] [PubMed] [Google Scholar]
- 2.Larder R, Cheung MK, Tung YC, Yeo GS, Coll AP. Where to go with FTO? Trends in endocrinology and metabolism: TEM. 2011;22:53–59. doi: 10.1016/j.tem.2010.11.001. [DOI] [PubMed] [Google Scholar]
- 3.Frayling TM, Timpson NJ, Weedon MN, Zeggini E, Freathy RM, Lindgren CM, et al. A common variant in the FTO gene is associated with body mass index and predisposes to childhood and adult obesity. Science. 2007;316:889–894. doi: 10.1126/science.1141634. [DOI] [PMC free article] [PubMed] [Google Scholar]
- 4.Speliotes EK, Willer CJ, Berndt SI, Monda KL, Thorleifsson G, Jackson AU, et al. Association analyses of 249,796 individuals reveal 18 new loci associated with body mass index. Nat Genet. 2010;42:937–U953. doi: 10.1038/ng.686. [DOI] [PMC free article] [PubMed] [Google Scholar]
- 5.Dina C, Meyre D, Gallina S, Durand E, Korner A, Jacobson P, et al. Variation in FTO contributes to childhood obesity and severe adult obesity. Nat Genet. 2007;39:724–726. doi: 10.1038/ng2048. [DOI] [PubMed] [Google Scholar]
- 6.Gustavsson J, Mehlig K, Leander K, Lissner L, Bjorck L, Rosengren A, et al. FTO Genotype, Physical Activity and Coronary Heart Disease Risk in Swedish Men and Women. Circulation. Cardiovascular genetics. 2014 doi: 10.1161/CIRCGENETICS.111.000007. [DOI] [PubMed] [Google Scholar]
- 7.Liguori R, Labruna G, Alfieri A, Martone D, Farinaro E, Contaldo F, et al. The FTO gene polymorphism (rs9939609) is associated with metabolic syndrome in morbidly obese subjects from southern Italy. Molecular and cellular probes. 2014 doi: 10.1016/j.mcp.2014.03.004. [DOI] [PubMed] [Google Scholar]
- 8.Zermeño-Rivera JJ. Association of the FTO gene SNP rs17817449 with body fat distribution in Mexican women. Genetics and molecular research. 2014;13 doi: 10.4238/2014.February.13.7. [DOI] [PubMed] [Google Scholar]
- 9.He D, Fu M, Miao S, Hotta K, Chandak GR, Xi B. FTO gene variant and risk of hypertension: A meta-analysis of 57,464 hypertensive cases and 41,256 controls. Metabolism: clinical and experimental. 2014 doi: 10.1016/j.metabol.2014.02.008. [DOI] [PubMed] [Google Scholar]
- 10.Boissel S, Reish O, Proulx K, Kawagoe-Takaki H, Sedgwick B, Yeo GSH, et al. Loss-of-Function Mutation in the Dioxygenase-Encoding FTO Gene Causes Severe Growth Retardation and Multiple Malformations. Am J Hum Genet. 2009;85:106–111. doi: 10.1016/j.ajhg.2009.06.002. [DOI] [PMC free article] [PubMed] [Google Scholar]
- 11.Bilguvar K, Ozturk AK, Louvi A, Kwan KY, Choi M, Tatli B, et al. Whole-exome sequencing identifies recessive WDR62 mutations in severe brain malformations. Nature. 2010;467:207–U293. doi: 10.1038/nature09327. [DOI] [PMC free article] [PubMed] [Google Scholar]
- 12.Kang HJ, Kawasawa YI, Cheng F, Zhu Y, Xu X, Li M, et al. Spatio-temporal transcriptome of the human brain. Nature. 2011;478:483–489. doi: 10.1038/nature10523. [DOI] [PMC free article] [PubMed] [Google Scholar]
- 13.Huang DW, Sherman BT, Lempicki RA. Systematic and integrative analysis of large gene lists using DAVID bioinformatics resources. Nat Protoc. 2009;4:44–57. doi: 10.1038/nprot.2008.211. [DOI] [PubMed] [Google Scholar]
- 14.Han Z, Niu T, Chang J, Lei X, Zhao M, Wang Q, et al. Crystal structure of the FTO protein reveals basis for its substrate specificity. Nature. 2010;464:1205–1209. doi: 10.1038/nature08921. [DOI] [PubMed] [Google Scholar]
- 15.Gerken T, Girard CA, Tung YCL, Webby CJ, Saudek V, Hewitson KS, et al. The obesity-associated FTO gene encodes a 2-oxoglutarate-dependent nucleic acid demethylase. Science. 2007;318:1469–1472. doi: 10.1126/science.1151710. [DOI] [PMC free article] [PubMed] [Google Scholar]
- 16.Jia G, Yang CG, Yang S, Jian X, Yi C, Zhou Z, et al. Oxidative demethylation of 3-methylthymine and 3-methyluracil in single-stranded DNA and RNA by mouse and human FTO. FEBS letters. 2008;582:3313–3319. doi: 10.1016/j.febslet.2008.08.019. [DOI] [PMC free article] [PubMed] [Google Scholar]
- 17.Wu Q, Saunders RA, Szkudlarek-Mikho M, de la Serna I, Chin KV. The obesity-associated Fto gene is a transcriptional coactivator. Biochemical and biophysical research communications. 2010;401:390–395. doi: 10.1016/j.bbrc.2010.09.064. [DOI] [PMC free article] [PubMed] [Google Scholar]
- 18.Berulava T, Ziehe M, Klein-Hitpass L, Mladenov E, Thomale J, Ruther U, et al. FTO levels affect RNA modification and the transcriptome. European journal of human genetics : EJHG. 2013;21:317–323. doi: 10.1038/ejhg.2012.168. [DOI] [PMC free article] [PubMed] [Google Scholar]
- 19.Jia GF, Fu Y, Zhao X, Dai Q, Zheng GQ, Yang Y, et al. N6-Methyladenosine in nuclear RNA is a major substrate of the obesity-associated FTO. Nat Chem Biol. 2011;7:885–887. doi: 10.1038/nchembio.687. [DOI] [PMC free article] [PubMed] [Google Scholar]
- 20.Gulati P, Cheung MK, Antrobus R, Church CD, Harding HP, Tung YC, et al. Role for the obesity-related FTO gene in the cellular sensing of amino acids. Proc Natl Acad Sci U S A. 2013;110:2557–2562. doi: 10.1073/pnas.1222796110. [DOI] [PMC free article] [PubMed] [Google Scholar]
- 21.Gulati P, Avezov E, Ma M, Antrobus R, Lehner PJ, O’Rahilly S, et al. Fat mass and obesity related (FTO) shuttles between the nucleus and cytoplasm. Bioscience reports. 2014 doi: 10.1042/BSR20140111. [DOI] [PMC free article] [PubMed] [Google Scholar]
- 22.Stratigopoulos G, Padilla SL, Leduc CA, Watson E, Hattersley AT, McCarthy MI, et al. Regulation of Fto/Ftm gene expression in mice and humans. Am J Physiol-Reg I. 2008;294:R1185–R1196. doi: 10.1152/ajpregu.00839.2007. [DOI] [PMC free article] [PubMed] [Google Scholar]
- 23.Tung YC, Yeo GS, O’Rahilly S, Coll AP. Obesity and FTO: Changing Focus at a Complex Locus. Cell metabolism. 2014;20:710–718. doi: 10.1016/j.cmet.2014.09.010. [DOI] [PubMed] [Google Scholar]
- 24.Bradfield JP, Taal HR, Timpson NJ, Scherag A, Lecoeur C, Warrington NM, et al. A genome-wide association meta-analysis identifies new childhood obesity loci. Nat Genet. 2012;44:526. doi: 10.1038/ng.2247. [DOI] [PMC free article] [PubMed] [Google Scholar]
- 25.Graff M, Ngwa JS, Workalemahu T, Homuth G, Schipf S, Teumer A, et al. Genome-wide analysis of BMI in adolescents and young adults reveals additional insight into the effects of genetic loci over the life course. Hum Mol Genet. 2013;22:3597–3607. doi: 10.1093/hmg/ddt205. [DOI] [PMC free article] [PubMed] [Google Scholar]
- 26.Lindgren CM, Heid IM, Randall JC, Lamina C, Steinthorsdottir V, Qi L, et al. Genome-wide association scan meta-analysis identifies three Loci influencing adiposity and fat distribution. PLoS genetics. 2009;5:e1000508. doi: 10.1371/journal.pgen.1000508. [DOI] [PMC free article] [PubMed] [Google Scholar]
- 27.Loos RJF, Yeo GSH. The bigger picture of FTO-the first GWAS-identified obesity gene. Nat Rev Endocrinol. 2014;10:51–61. doi: 10.1038/nrendo.2013.227. [DOI] [PMC free article] [PubMed] [Google Scholar]
- 28.Meyre D, Delplanque J, Chevre JC, Lecoeur C, Lobbens S, Gallina S, et al. Genome-wide association study for early-onset and morbid adult obesity identifies three new risk loci in European populations. Nat Genet. 2009;41:157–159. doi: 10.1038/ng.301. [DOI] [PubMed] [Google Scholar]
- 29.Scherag A, Dina C, Hinney A, Vatin V, Scherag S, Vogel CI, et al. Two new Loci for body-weight regulation identified in a joint analysis of genome-wide association studies for early-onset extreme obesity in French and german study groups. PLoS genetics. 2010;6:e1000916. doi: 10.1371/journal.pgen.1000916. [DOI] [PMC free article] [PubMed] [Google Scholar]
- 30.Speliotes EK, Willer CJ, Berndt SI, Monda KL, Thorleifsson G, Jackson AU, et al. Association analyses of 249,796 individuals reveal 18 new loci associated with body mass index. Nat Genet. 2010;42:937–948. doi: 10.1038/ng.686. [DOI] [PMC free article] [PubMed] [Google Scholar]
- 31.Thorleifsson G, Walters GB, Gudbjartsson DF, Steinthorsdottir V, Sulem P, Helgadottir A, et al. Genome-wide association yields new sequence variants at seven loci that associate with measures of obesity. Nat Genet. 2009;41:18–24. doi: 10.1038/ng.274. [DOI] [PubMed] [Google Scholar]
- 32.Wheeler E, Huang N, Bochukova EG, Keogh JM, Lindsay S, Garg S, et al. Genome-wide SNP and CNV analysis identifies common and low-frequency variants associated with severe early-onset obesity. Nat Genet. 2013;45:513–U576. doi: 10.1038/ng.2607. [DOI] [PMC free article] [PubMed] [Google Scholar]
- 33.Willer CJ, Speliotes EK, Loos RJF, Li SX, Lindgren CM, Heid IM, et al. Six new loci associated with body mass index highlight a neuronal influence on body weight regulation. Nat Genet. 2009;41:25–34. doi: 10.1038/ng.287. [DOI] [PMC free article] [PubMed] [Google Scholar]
- 34.Horikoshi M, Yaghootkar H, Mook-Kanamori DO, Sovio U, Taal HR, Hennig BJ, et al. New loci associated with birth weight identify genetic links between intrauterine growth and adult height and metabolism. Nat Genet. 2013;45:76–U115. doi: 10.1038/ng.2477. [DOI] [PMC free article] [PubMed] [Google Scholar]
- 35.Jess T, Zimmermann E, Kring SII, Berentzen T, Holst C, Toubro S, et al. Impact on weight dynamics and general growth of the common FTO rs9939609: a longitudinal Danish cohort study. Int J Obesity. 2008;32:1388–1394. doi: 10.1038/ijo.2008.110. [DOI] [PubMed] [Google Scholar]
- 36.Kilpelaeinen TO, den Hoed M, Ong KK, Grontved A, Brage S, Jameson K, et al. Obesity-susceptibility loci have a limited influence on birth weight: a meta-analysis of up to 28,219 individuals. Am J Clin Nutr. 2011;93:851–860. doi: 10.3945/ajcn.110.000828. [DOI] [PubMed] [Google Scholar]
- 37.Hardy R, Wills AK, Wong A, Elks CE, Wareham NJ, Loos RJF, et al. Life course variations in the associations between FTO and MC4R gene variants and body size. Hum Mol Genet. 2010;19:545–552. doi: 10.1093/hmg/ddp504. [DOI] [PMC free article] [PubMed] [Google Scholar]
- 38.Sovio U, Mook-Kanamori DO, Warrington NM, Lawrence R, Briollais L, Palmer CNA, et al. Association between Common Variation at the FTO Locus and Changes in Body Mass Index from Infancy to Late Childhood: The Complex Nature of Genetic Association through Growth and Development. PLoS genetics. 2011;7 doi: 10.1371/journal.pgen.1001307. [DOI] [PMC free article] [PubMed] [Google Scholar]
- 39.Cecil JE, Tavendale R, Watt P, Hetherington MM, Palmer CN. An obesity-associated FTO gene variant and increased energy intake in children. The New England journal of medicine. 2008;359:2558–2566. doi: 10.1056/NEJMoa0803839. [DOI] [PubMed] [Google Scholar]
- 40.Speakman JR, Rance KA, Johnstone AM. Polymorphisms of the FTO gene are associated with variation in energy intake, but not energy expenditure. Obesity. 2008;16:1961–1965. doi: 10.1038/oby.2008.318. [DOI] [PubMed] [Google Scholar]
- 41.Timpson NJ, Emmett PM, Frayling TM, Rogers I, Hattersley AT, McCarthy MI, et al. The fat mass- and obesity-associated locus and dietary intake in children. Am J Clin Nutr. 2008;88:971–978. doi: 10.1093/ajcn/88.4.971. [DOI] [PMC free article] [PubMed] [Google Scholar]
- 42.Park SL, Cheng I, Pendergrass SA, Kucharska-Newton AM, Lim U, Ambite JL, et al. Association of the FTO obesity risk variant rs8050136 with percentage of energy intake from fat in multiple racial/ethnic populations: the PAGE study. American journal of epidemiology. 2013;178:780–790. doi: 10.1093/aje/kwt028. [DOI] [PMC free article] [PubMed] [Google Scholar]
- 43.Sonestedt E, Roos C, Gullberg B, Ericson U, Wirfalt E, Orho-Melander M. Fat and carbohydrate intake modify the association between genetic variation in the FTO genotype and obesity. Am J Clin Nutr. 2009;90:1418–1425. doi: 10.3945/ajcn.2009.27958. [DOI] [PubMed] [Google Scholar]
- 44.Tanaka T, Ngwa JS, van Rooij FJA, Zillikens MC, Wojczynski MK, Frazier-Wood AC, et al. Genome-wide meta-analysis of observational studies shows common genetic variants associated with macronutrient intake. Am J Clin Nutr. 2013;97:1395–1402. doi: 10.3945/ajcn.112.052183. [DOI] [PMC free article] [PubMed] [Google Scholar]
- 45.Wardle J, Carnell S, Haworth CMA, Farooqi IS, O’Rahilly S, Plomin R. Obesity associated genetic variation in FTO is associated with diminished satiety. J Clin Endocr Metab. 2008;93:3640–3643. doi: 10.1210/jc.2008-0472. [DOI] [PubMed] [Google Scholar]
- 46.Wardle J, Llewellyn C, Sanderson S, Plomin R. The FTO gene and measured food intake in children. Int J Obesity. 2009;33:42–45. doi: 10.1038/ijo.2008.174. [DOI] [PubMed] [Google Scholar]
- 47.Tanofsky-Kraff M, Han JC, Anandalingam K, Shomaker LB, Columbo KM, Wolkoff LE, et al. The FTO gene rs9939609 obesity-risk allele and loss of control over eating. Am J Clin Nutr. 2009;90:1483–1488. doi: 10.3945/ajcn.2009.28439. [DOI] [PMC free article] [PubMed] [Google Scholar]
- 48.Kilpelainen TO, Qi L, Brage S, Sharp SJ, Sonestedt E, Demerath E, et al. Physical Activity Attenuates the Influence of FTO Variants on Obesity Risk: A Meta-Analysis of 218,166 Adults and 19,268 Children. Plos Med. 2011;8 doi: 10.1371/journal.pmed.1001116. [DOI] [PMC free article] [PubMed] [Google Scholar]
- 49.Yang J, Loos RJF, Powell JE, Medland SE, Speliotes EK, Chasman DI, et al. FTO genotype is associated with phenotypic variability of body mass index. Nature. 2012;490:267. doi: 10.1038/nature11401. [DOI] [PMC free article] [PubMed] [Google Scholar]
- 50.Meyre D, Proulx K, Kawagoe-Takaki H, Vatin V, Gutierrez-Aguilar R, Lyon D, et al. Prevalence of loss-of-function FTO mutations in lean and obese individuals. Diabetes. 2010;59:311–318. doi: 10.2337/db09-0703. [DOI] [PMC free article] [PubMed] [Google Scholar]
- 51.Deliard S, Panossian S, Mentch FD, Kim CE, Hou CP, Frackelton EC, et al. The Missense Variation Landscape of FTO, MC4R, and TMEM18 in Obese Children of African Ancestry. Obesity. 2013;21:159–163. doi: 10.1002/oby.20147. [DOI] [PMC free article] [PubMed] [Google Scholar]
- 52.Zheng ZJ, Hong L, Huang XD, Yang PR, Li J, Ding Y, et al. Screening for Coding Variants in FTO and SH2B1 Genes in Chinese Patients with Obesity. PloS one. 2013;8 doi: 10.1371/journal.pone.0067039. [DOI] [PMC free article] [PubMed] [Google Scholar]
- 53.Deliard S, Panossian S, Mentch FD, Kim CE, Hou C, Frackelton EC, et al. The missense variation landscape of FTO, MC4R, and TMEM18 in obese children of African Ancestry. Obesity. 2013;21:159–163. doi: 10.1002/oby.20147. [DOI] [PMC free article] [PubMed] [Google Scholar]
- 54.Zheng Z, Hong L, Huang X, Yang P, Li J, Ding Y, et al. Screening for coding variants in FTO and SH2B1 genes in Chinese patients with obesity. PloS one. 2013;8:e67039. doi: 10.1371/journal.pone.0067039. [DOI] [PMC free article] [PubMed] [Google Scholar]
- 55.Hubacek JA, Stanek V, Gebauerova M, Pilipcincova A, Dlouha D, Poledne R, et al. A FTO variant and risk of acute coronary syndrome. Clinica chimica acta; international journal of clinical chemistry. 2010;411:1069–1072. doi: 10.1016/j.cca.2010.03.037. [DOI] [PubMed] [Google Scholar]
- 56.Pausova Z, Syme C, Abrahamowicz M, Xiao Y, Leonard GT, Perron M, et al. A Common Variant of the Fto Gene Is Associated Not Only with Increased Adiposity but Also Elevated Blood Pressure in French-Canadian Adolescents. J Hypertens. 2009;27:S166–S166. doi: 10.1161/CIRCGENETICS.109.857359. [DOI] [PubMed] [Google Scholar]
- 57.Wehr E, Schweighofer N, Moller R, Giuliani A, Pieber TR, Obermayer-Pietsch B. Association of FTO gene with hyperandrogenemia and metabolic parameters in women with polycystic ovary syndrome. Metabolism: clinical and experimental. 2010;59:575–580. doi: 10.1016/j.metabol.2009.08.023. [DOI] [PubMed] [Google Scholar]
- 58.Cai X, Liu C, Mou S. Association between fat mass- and obesity-associated (FTO) gene polymorphism and polycystic ovary syndrome: a meta-analysis. PloS one. 2014;9:e86972. doi: 10.1371/journal.pone.0086972. [DOI] [PMC free article] [PubMed] [Google Scholar]
- 59.Elks CE, Perry JRB, Sulem P, Chasman DI, Franceschini N, He CY, et al. Thirty new loci for age at menarche identified by a meta-analysis of genome-wide association studies. Nat Genet. 2010;42:1077–U1073. doi: 10.1038/ng.714. [DOI] [PMC free article] [PubMed] [Google Scholar]
- 60.Benedict C, Jacobsson JA, Ronnemaa E, Sallman-Almen M, Brooks S, Schultes B, et al. The fat mass and obesity gene is linked to reduced verbal fluency in overweight and obese elderly men. Neurobiol Aging. 2011:32. doi: 10.1016/j.neurobiolaging.2011.02.006. [DOI] [PubMed] [Google Scholar]
- 61.Keller L, Xu W, Wang HX, Winblad B, Fratiglioni L, Graff C. The obesity related gene, FTO, interacts with APOE, and is associated with Alzheimer’s disease risk: a prospective cohort study. Journal of Alzheimer’s disease : JAD. 2011;23:461–469. doi: 10.3233/JAD-2010-101068. [DOI] [PubMed] [Google Scholar]
- 62.Alosco ML, Benitez A, Gunstad J, Spitznagel MB, McCaffery JM, McGeary JE, et al. Reduced memory in fat mass and obesity-associated allele carriers among older adults with cardiovascular disease. Psychogeriatrics : the official journal of the Japanese Psychogeriatric Society. 2013;13:35–40. doi: 10.1111/j.1479-8301.2012.00424.x. [DOI] [PMC free article] [PubMed] [Google Scholar]
- 63.Melka MG, Gillis J, Bernard M, Abrahamowicz M, Chakravarty MM, Leonard GT, et al. FTO, obesity and the adolescent brain. Human molecular genetics. 2013;22:1050–1058. doi: 10.1093/hmg/dds504. [DOI] [PMC free article] [PubMed] [Google Scholar]
- 64.Stratakis CA, Lafferty A, Taymans SE, Gafni RI, Meck JM, Blancato J. Anisomastia associated with interstitial duplication of chromosome 16, mental retardation, obesity, dysmorphic facies, and digital anomalies: Molecular mapping of a new syndrome by fluorescent in situ hybridization and microsatellites to 16q13 (D16S419-D16S503) J Clin Endocr Metab. 2000;85:3396–3401. doi: 10.1210/jcem.85.9.6776. [DOI] [PubMed] [Google Scholar]
- 65.van den Berg L, Delemarre-van de Waa H, Han JC, Ylstra B, Eijk P, Nesterova M, et al. Investigation of a Patient With a Partial Trisomy 16q Including the Fat Mass and Obesity Associated Gene (FTO): Fine Mapping and FTO Gene Expression Study. Am J Med Genet A. 2010;152A:630–637. doi: 10.1002/ajmg.a.33229. [DOI] [PMC free article] [PubMed] [Google Scholar]
- 66.Osborn DP, Roccasecca RM, McMurray F, Hernandez-Hernandez V, Mukherjee S, Barroso I, et al. Loss of FTO antagonises Wnt signaling and leads to developmental defects associated with ciliopathies. PloS one. 2014;9:e87662. doi: 10.1371/journal.pone.0087662. [DOI] [PMC free article] [PubMed] [Google Scholar]
- 67.De Calisto J, Araya C, Marchant L, Riaz CF, Mayor R. Essential role of non-canonical Wnt signalling in neural crest migration. Development. 2005;132:2587–2597. doi: 10.1242/dev.01857. [DOI] [PubMed] [Google Scholar]
- 68.Pattnaik NM, Montes A, Hughes LB, Zilversmit DB. Cholesteryl ester exchange protein in human plasma isolation and characterization. Biochimica et biophysica acta. 1978;530:428–438. doi: 10.1016/0005-2760(78)90163-7. [DOI] [PubMed] [Google Scholar]
- 69.Lamarche B, Uffelman KD, Carpentier A, Cohn JS, Steiner G, Barrett PH, et al. Triglyceride enrichment of HDL enhances in vivo metabolic clearance of HDL apo A-I in healthy men. The Journal of clinical investigation. 1999;103:1191–1199. doi: 10.1172/JCI5286. [DOI] [PMC free article] [PubMed] [Google Scholar]
- 70.Inazu A, Brown ML, Hesler CB, Agellon LB, Koizumi J, Takata K, et al. Increased high-density lipoprotein levels caused by a common cholesteryl-ester transfer protein gene mutation. The New England journal of medicine. 1990;323:1234–1238. doi: 10.1056/NEJM199011013231803. [DOI] [PubMed] [Google Scholar]
- 71.Brown ML, Inazu A, Hesler CB, Agellon LB, Mann C, Whitlock ME, et al. Molecular basis of lipid transfer protein deficiency in a family with increased high-density lipoproteins. Nature. 1989;342:448–451. doi: 10.1038/342448a0. [DOI] [PubMed] [Google Scholar]
- 72.Maruyama T, Sakai N, Ishigami M, Hirano K, Arai T, Okada S, et al. Prevalence and phenotypic spectrum of cholesteryl ester transfer protein gene mutations in Japanese hyperalphalipoproteinemia. Atherosclerosis. 2003;166:177–185. doi: 10.1016/s0021-9150(02)00327-1. [DOI] [PubMed] [Google Scholar]
- 73.Nagano M, Yamashita S, Hirano K, Takano M, Maruyama T, Ishihara M, et al. Molecular mechanisms of cholesteryl ester transfer protein deficiency in Japanese. Journal of atherosclerosis and thrombosis. 2004;11:110–121. doi: 10.5551/jat.11.110. [DOI] [PubMed] [Google Scholar]
- 74.Koizumi J, Mabuchi H, Yoshimura A, Michishita I, Takeda M, Itoh H, et al. Deficiency of serum cholesteryl-ester transfer activity in patients with familial hyperalphalipoproteinaemia. Atherosclerosis. 1985;58:175–186. doi: 10.1016/0021-9150(85)90064-4. [DOI] [PubMed] [Google Scholar]
- 75.Funke H, Wiebusch H, Fuer L, Muntoni S, Schulte H, Assmann G. Identification of Mutations in the Cholesterol Ester Transfer Protein in Europeans with Elevated High-Density-Lipoprotein Cholesterol. Circulation. 1994;90:241–241. [Google Scholar]
- 76.Teh EM, Dolphin PJ, Breckenridge WC, Tan MH. Human plasma CETP deficiency: identification of a novel mutation in exon 9 of the CETP gene in a Caucasian subject from North America. Journal of lipid research. 1998;39:442–456. [PubMed] [Google Scholar]
- 77.Rhyne J, Ryan MJ, White C, Chimonas T, Miller M. The two novel CETP mutations Gln87X and Gln165X in a compound heterozygous state are associated with marked hyperalphalipoproteinemia and absence of significant coronary artery disease. J Mol Med-Jmm. 2006;84:647–650. doi: 10.1007/s00109-006-0070-4. [DOI] [PubMed] [Google Scholar]
- 78.van der Steeg WA, Hovingh GK, Klerkx AHEM, Hutten BA, Nootenboom IC, Levels JHM, et al. Cholesteryl ester transfer protein and hyperalphalipoproteinemia in Caucasians. Journal of lipid research. 2007;48:674–682. doi: 10.1194/jlr.M600405-JLR200. [DOI] [PubMed] [Google Scholar]
- 79.Calabresi L, Nilsson P, Pinotti E, Gomaraschi M, Favari E, Adorni MP, et al. A novel homozygous mutation in CETP gene as a cause of CETP deficiency in a caucasian kindred. Atherosclerosis. 2009;205:506–511. doi: 10.1016/j.atherosclerosis.2009.01.006. [DOI] [PubMed] [Google Scholar]
- 80.de Grooth GJ, Klerkx AHEM, Stroes ESG, Stalenhoef AFH, Kastelein JJP, Kuivenhoven JA. A review of CETP and its relation to atherosclerosis. Journal of lipid research. 2004;45:1967–1974. doi: 10.1194/jlr.R400007-JLR200. [DOI] [PubMed] [Google Scholar]
- 81.Choi M, Scholl UI, Ji W, Liu T, Tikhonova IR, Zumbo P, et al. Genetic diagnosis by whole exome capture and massively parallel DNA sequencing. Proceedings of the National Academy of Sciences of the United States of America. 2009;106:19096–19101. doi: 10.1073/pnas.0910672106. [DOI] [PMC free article] [PubMed] [Google Scholar]
- 82.Clark VE, Erson-Omay EZ, Serin A, Yin J, Cotney J, Ozduman K, et al. Genomic analysis of non-NF2 meningiomas reveals mutations in TRAF7, KLF4, AKT1, and SMO. Science. 2013;339:1077–1080. doi: 10.1126/science.1233009. [DOI] [PMC free article] [PubMed] [Google Scholar]
- 83.Sathirapongsasuti JF, Lee H, Horst BA, Brunner G, Cochran AJ, Binder S, et al. Exome sequencing-based copy-number variation and loss of heterozygosity detection: ExomeCNV. Bioinformatics. 2011;27:2648–2654. doi: 10.1093/bioinformatics/btr462. [DOI] [PMC free article] [PubMed] [Google Scholar]
- 84.Dennis G, Jr, Sherman BT, Hosack DA, Yang J, Gao W, Lane HC, et al. DAVID: Database for Annotation, Visualization, and Integrated Discovery. Genome biology. 2003;4:P3. [PubMed] [Google Scholar]
- 85.Zuber TJ. Punch biopsy of the skin. Am Fam Physician. 2002;65:1155. [PubMed] [Google Scholar]
- 86.Levitt J, Bernardo S, Whang T. How to Perform a Punch Biopsy of the Skin. New Engl J Med. 2013;369:E13–E13. doi: 10.1056/NEJMvcm1105849. [DOI] [PubMed] [Google Scholar]
- 87.Church C, Lee S, Bagg EA, McTaggart JS, Deacon R, Gerken T, et al. A mouse model for the metabolic effects of the human fat mass and obesity associated FTO gene. Plos Genet. 2009;5:e1000599. doi: 10.1371/journal.pgen.1000599. [DOI] [PMC free article] [PubMed] [Google Scholar]
- 88.Schmittgen TD, Livak KJ. Analyzing real-time PCR data by the comparative C(T) method. Nat Protoc. 2008;3:1101–1108. doi: 10.1038/nprot.2008.73. [DOI] [PubMed] [Google Scholar]
Associated Data
This section collects any data citations, data availability statements, or supplementary materials included in this article.
Supplementary Materials
Plasma lipid and protein levels of the NG1305 were correlated with CETF mutation that was found patient by whole exome sequencing.
Blocks of genomic homozygosity were identified via whole-genome genotyping obtained from index patient (NG1305-1). Chr – chromosome; SNP – single nucleotide polymorphism; cM – centimorgans; Mb – million base pairs.
Summary of sequencing quality metrics achieved by whole-exome sequencing performed on index patient (NG1305-1).
Summary of whole-genome genotyping and whole-exome sequencing results for index patient NG1305-1. Blocks of genomic homozygosity were identified via whole-genome genotyping. Homozygous variants were identified via whole-exome sequencing.
List of the top 100 genes with expression patterns that are positively correlated with FTO expression.
List of the top 100 genes with expression patterns that are negatively correlated with FTO expression.
Comparison of doubling time between the patient, parents and control samples in different incubation time points revealed no statistical differences.
Graph of FTO expression in various regions of the normal developing human brain over time. These data were obtained using the Human Brain Transcriptome database. Note that FTO is expressed throughout the all brain regions. Expression levels, except cerebellum, peak early in development, decrease slightly during fetal life, and then remain relatively constant throughout adult life. In cerebellum, expression levels of FTO decrease slightly during fetal life and remain high after birth and adult life.