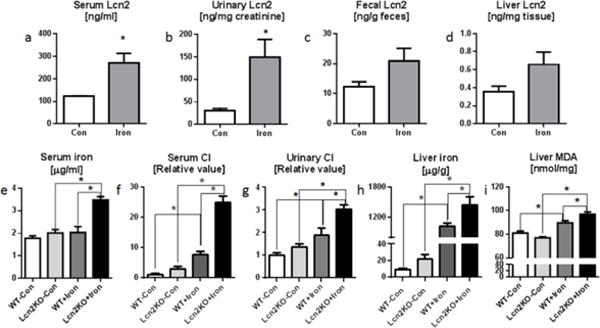
Fig. 3. Dietary iron induces hyperferremia and elevated catalytic iron in Lcn2KO mice.

Four weeks old male Lcn2KO mice and their WT littermates (n=5) were maintained on 2% carbonyl iron diet for 12 weeks and monitored regularly for body weights and food intake. Serum, urine, feces and liver tissue were collected on the day of euthanasia. Lcn2 was analyzed by ELISA in a serum, b urine, c feces, and d liver. e Bar graph represents serum total iron. Catalytic iron (CI) levels were quantified by bleomycin-detectable iron assay. Bar graphs represent CI levels in f serum and g urine. h Liver tissue iron was measured by non-heme tissue iron method. i Liver lipid peroxidation marker liver malondialdehyde (MDA) was estimated by MDA-TBA assay. Results presented as mean ± SEM. unpaired t-test (a–d) and Tukey’s post hoc test (e–i). *p< 0.05
