BACKGROUND
Dermal fillers are a popular anti-aging treatment with over 2 million procedures performed in the USA in 2013, and this figure will only increase as the aging population grows. Most FDA approved fillers last 3 to 24 months, depending on composition and injection site. There are numerous FDA-approved dermal fillers of varying compositions, with the most common being hyaluronic acid. Various fillers have optimal uses in specific skin layers corresponding to different degrees of treatment (1).
Adverse reactions to dermal fillers are infrequent, and most are mild and superficial with no permanent effects (2). However, severe complications, such as filler migration to the eyes and ocular ischemia, have been reported (3). In addition to aiding with precise localization of the filler injection, real-time visual feedback could decrease the risk of embolisms and subsequent ischemic events associated with present blind-injection techniques. Currently, physicians have no real-time visual feedback with micrometer-scale resolution. Ultrasound imaging, X-ray CT, MRI, and PET have visualized dermal fillers (4), but are impractical for real-time and/or outpatient use.
Optical coherence tomography (OCT) is a noninvasive low coherence interferometric technique which can provide depth-resolved imaging with micrometer-scale spatial resolution (5), and is rapidly emerging as a powerful tool in dermatology (s1–s4). OCT can also obtain the local mechanical properties of tissue through a functional extension, optical coherence elastography (OCE) (6, 7). Although viscoelastic and rheological properties of dermal fillers have been evaluated (s5–s7), there has not been direct study on the effects of fillers on skin biomechanical properties.
QUESTIONS ADDRESSED
In this Letter, we investigated the feasibility of OCT for visualizing dermal filler injections in real-time with micrometer-scale spatial resolution. Furthermore, we utilized a noncontact OCE method to assess the viscoelasticity of a fresh ex vivo pig skin sample after filler injections to determine whether OCE can objectively characterize the efficacy of the filler injection.
EXP. DESIGN
A commercial swept source OCT (SS-OCT) system (Model OCS1310V1, Thorlabs Inc., NJ, USA) imaged the injection. A schematic and specifications of the SS-OCT system are provided in the Supplementary Materials (Error! Reference source not found. (a) and Table 1, respectively).
A home built phase-sensitive OCE system assessed the elasticity of the pig skin after the filler injections (8). Details are provided in the Supplementary Materials (Table 1). The skin was mechanically loaded by a brief (≤1 ms) focused air-pulse (9). The OCT imaging beam and air-pulse were co-focused during all OCE measurements (s8). The sample was mounted on a pair of motorized linear stages (Model UTS100CC, Newport Inc., CA, USA) for accurate 2D translation. A schematic of the OCE setup is provided in the Supplementary Materials (Error! Reference source not found. (b)).
Dermal filler (Juvederm® Ultra XC, Allergan Inc., CA, USA) was injected ~1 mm below the surface at three locations into pig skin that was obtained fresh from a local market. The SS-OCT system imaged the injection process at 200 frames per second. After injection, the SS-OCT system acquired 3D structural images.
An area of 45 by 15 mm of 10 by 4 points, respectively, was assessed by OCE from one sample of pig skin. Air-pulses at each of the measurement positions were delivered to the skin surface at ~20 Pa. M-mode images (n=21) were acquired at each position and each air-pulse was synchronized with the M-mode frame trigger (s9). The vertical temporal displacement profiles were analyzed for their relaxation rate and for viscoelasticity reconstruction (s8, s10–s12). Details about OCE data processing, analysis, and viscoelasticity reconstruction are provided in the Supplementary Materials.
RESULTS
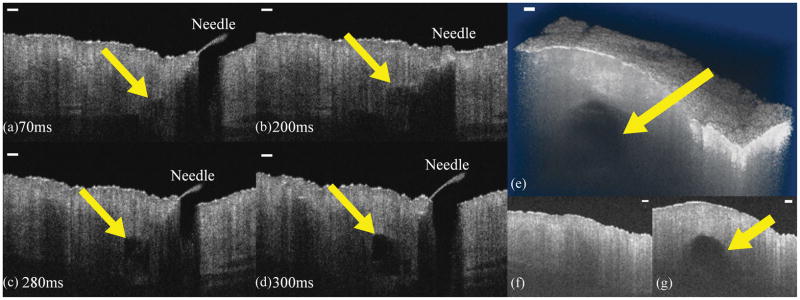
The filler injection was successfully imaged by the SS-OCT system. Figure 1(a–d) are selected frames during the injection, and Video 1 shows the injection at 10x slower than real-time. Figure 1(e–g) are images of the reshaped skin after the injection. Figure 1(e) is a 3D rendering of the skin showing the injection site of the filler. Figure 1(f) and (g) are slices corresponding to the furthest and nearest slices of Figure 1(e), respectively.
Figure 1.
(a–d) Selected OCT images acquired during dermal filler injection at the indicated times. (e) 3D visualization of the pig skin after a filler injection. (f) 2D slice of the skin where no filler was injected. (g) 2D slice of the skin showing the presence of the filler. Yellow arrows indicate the location of the filler. Scale bars are 250 μm.
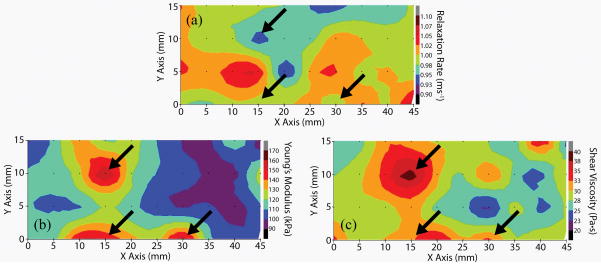
The biomechanical properties of the pig skin are mapped in Figure 2, with the black arrows and black dots indicating filler injection sites and OCE measurement positions, respectively. Figure 2(a) shows the 2D map of the relaxation rates calculated by fitting the relaxation process to an exponential equation (Equation (2) in Supplementary Materials). The injection sites are not evident because the average relaxation rate for all data points (n=945) was 0.99±0.048 ms−1, indicating a low variance and subsequent lack of filler localization.
Figure 2.
2D maps of the (a) relaxation rate of the air-pulse induced displacement and (b) Young’s modulus and (c) shear viscosity obtained from the viscoelasticity reconstruction model. Black arrows indicate positions of the filler injections and black dots indicate OCE measurement positions.
The Young’s modulus and shear viscosity quantified by the reconstruction model are mapped in Figure 2(b) and (c), respectively. Now, the fillers are easily localized from the regions of increased stiffness and viscosity. Additional experiments with saline injections also showed an increased elasticity at the injection sites, indicating that additional volume beneath the skin may be the primary source of the altered biomechanical properties. These results are provided in the Saline injections section in the Supplementary Materials.
CONCLUSIONS
We have shown the first real-time visual feedback of dermal filler injections with micrometer-scale resolution using OCT. Due to the noninvasive nature of OCT and advances in optical hardware and high performance software enabling real-time video-rate 3D imaging, OCT may be a valuable tool for aiding and evaluating other dermatological cosmetic procedures. By taking advantage of the superior displacement sensitivity of OCE in conjunction with noncontact mechanical loading by an air-pulse, the biomechanical properties of pig skin were mapped and the filler injection sites were localized.
Supplementary Material
Acknowledgments
The authors thank Dr. Salavat Aglyamov from the Department of Biomedical Engineering at the University of Texas at Austin and Dr. Zhaolong Han from the Department of Biomedical Engineering at the University of Houston for developing the model-based viscoelastic reconstruction method. The authors also thank Dr. Michael Twa from the School of Optometry at the University of Alabama at Birmingham for development of the air-pulse device.
MS, KL, and SW performed the research. RWY provided the filler. MS analyzed the data. All authors designed the research study and contributed to the manuscript.
Funding sources: 1R01EY022362, 1R01HL120140, and U54HG006348 from the NIH and PRJ71TN from DOD/NAVSEA.
References
- 1.Bray D, Hopkins C, Roberts DN. A review of dermal fillers in facial plastic surgery. Curr Opin Otolaryngol Head Neck Surg. 2010;18:295–302. doi: 10.1097/MOO.0b013e32833b5162. [DOI] [PubMed] [Google Scholar]
- 2.Lowe NJ, Maxwell CA, Patnaik R. Adverse reactions to dermal fillers: review. Dermatol Surg. 2005;31:1616–1625. [PubMed] [Google Scholar]
- 3.Beleznay K, Carruthers JD, Humphrey S, et al. Avoiding and treating blindness from fillers: a review of the world literature. Dermatol Surg. 2015;41:1097–1117. doi: 10.1097/DSS.0000000000000486. [DOI] [PubMed] [Google Scholar]
- 4.Ginat DT, Schatz CJ. Imaging features of midface injectable fillers and associated complications. Am J Neuroradiol. 2013;34:1488–1495. doi: 10.3174/ajnr.A3161. [DOI] [PMC free article] [PubMed] [Google Scholar]
- 5.Huang D, Swanson EA, Lin CP, et al. Optical coherence tomography. Science. 1991;254:1178–1181. doi: 10.1126/science.1957169. [DOI] [PMC free article] [PubMed] [Google Scholar]
- 6.Schmitt J. OCT elastography: imaging microscopic deformation and strain of tissue. Opt Express. 1998;3:199–211. doi: 10.1364/oe.3.000199. [DOI] [PubMed] [Google Scholar]
- 7.Wang S, Larin KV. Optical coherence elastography for tissue characterization: a review. J Biophotonics. 2015;8:279–302. doi: 10.1002/jbio.201400108. [DOI] [PMC free article] [PubMed] [Google Scholar]
- 8.Wang S, Lopez AL, 3rd, Morikawa Y, et al. Noncontact quantitative biomechanical characterization of cardiac muscle using shear wave imaging optical coherence tomography. Biomed Opt Express. 2014;5:1980–1992. doi: 10.1364/BOE.5.001980. [DOI] [PMC free article] [PubMed] [Google Scholar]
- 9.Wang S, Larin KV, Li JS, et al. A focused air-pulse system for optical-coherence-tomography-based measurements of tissue elasticity. Laser Phys Lett. 2013;10:075605. doi: 10.1088/1612-2011/10/7/075605. [DOI] [PMC free article] [PubMed] [Google Scholar]
Associated Data
This section collects any data citations, data availability statements, or supplementary materials included in this article.


