Abstract.
Rodent models are indispensable in studying various retinal diseases. Noninvasive, high-resolution retinal imaging of rodent models is highly desired for longitudinally investigating the pathogenesis and therapeutic strategies. However, due to severe aberrations, the retinal image quality in rodents can be much worse than that in humans. We numerically and experimentally investigated the influence of chromatic aberration and optical illumination bandwidth on retinal imaging. We confirmed that the rat retinal image quality decreased with increasing illumination bandwidth. We achieved the retinal image resolution of using a 19 nm illumination bandwidth centered at 580 nm in a home-built fundus camera. Furthermore, we observed higher chromatic aberration in albino rat eyes than in pigmented rat eyes. This study provides a design guide for high-resolution fundus camera for rodents. Our method is also beneficial to dispersion compensation in multiwavelength retinal imaging applications.
Keywords: fundus camera, retinal imaging, optical aberration
1. Introduction
Rodent models are critical in studying various human diseases due to their ease of handling, high genetic similarity to humans, and well-established gene manipulation techniques.1–4 Rodent models provide cost-effective ways to investigate the pathogenesis and therapeutic strategies in visual impairing diseases, such as macular degeneration, diabetic retinopathy, and glaucoma.5–7
Histological examination is commonly used to visualize subtle structural and functional changes in retinal tissue during disease progressions and treatments.8 However, histological examinations are limited to terminal studies. Noninvasive, high-resolution retinal imaging is advantageous for longitudinal retinal disease investigations. Various noninvasive imaging modalities have been applied for rodent retinal studies, including fundus photography, optical coherence tomography (OCT), scanning laser ophthalmoscopy, and photoacoustic ophthalmoscopy.9–12 However, severe monochromatic and chromatic aberrations in rodent eyes impair the image quality.13,14 Adaptive optics (AO) was applied to correct monochromatic aberration.15–17 However, the compensating for chromatic aberration in AO is still challenging. Despite recent improvements, researchers have yet to reach the theoretical resolution limits in AO in rodents, which have already been accomplished in human eyes.11,13
Chromatic aberration in rodent eyes ranges from 6 to 10 diopter within the visible-light spectral range (three to five times larger than that of human eyes).14,18–20 Severe image degradation is, therefore, expected in polychromatic optical techniques, such as multiwavelength oximetry, OCT, and AO (when using different wavelengths for calibration and imaging). On the other hand, few studies investigated the impact of chromatic aberration on rodent retinal image quality. The questions of how to analyze and minimize chromatic aberration induced image degradation in rodent retinal image remain unanswered.
In this work, we numerically and experimentally investigated the influence of chromatic aberration and optical illumination bandwidth on retinal fundus images in rats. We calculated the chromatic focal plane shift and correlated the shift to resolution degradation. We experimentally obtained retinal images under different illumination bandwidths using a home-built fundus camera and investigated image resolution degradation using line spread function and sharpness metrics analysis. In the simulation, we found that the optical focus shifted more than within the visible-light spectral range (for comparison, retinal layer is ). The retinal image resolution was under 300-nm-bandwidth white light illumination as used in commercial fundus camera. When the illumination bandwidth was within 100 nm, resolutions could be . Experimentally, we found that both fundus image resolution and sharpness decreased monotonically with increasing illumination bandwidth, which agreed with our simulation results. We achieved the fundus image resolution of using a 19-nm-bandwidth illumination centered at 580 nm. Furthermore, we observed more severe chromatic aberration in albino eyes than in pigmented eyes. Our study provides a guide for designing high-resolution rodent fundus cameras. Our method could also be beneficial for dispersion compensation in multiwavelength imaging techniques, including AO and hyperspectral retinal imaging, and spectral analysis related applications, such as optical retinal oximetry.
2. Numerical Studies
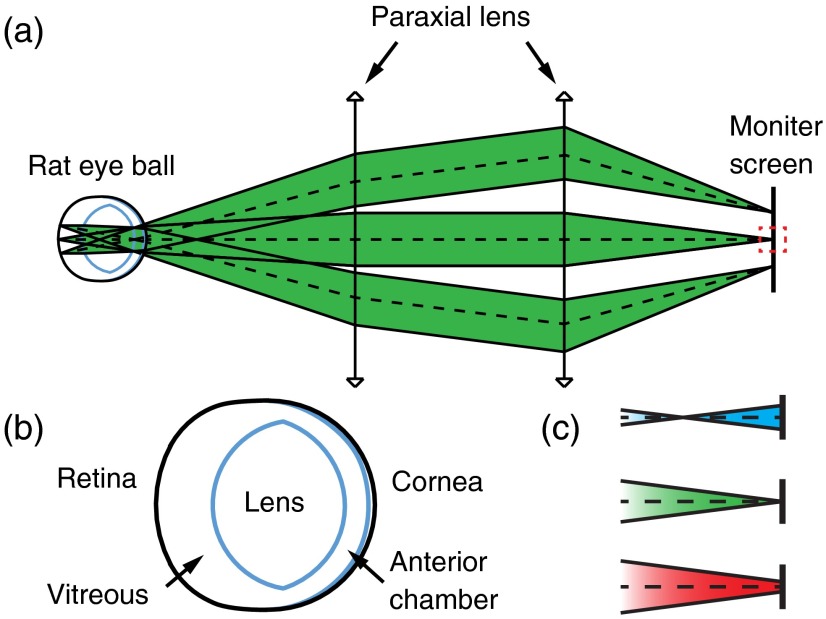
We numerically investigated the influence of chromatic aberration on rat fundus images using Zemax. As shown in Fig. 1(a), a simplified fundus imaging system is realized by two aberration-free paraxial lenses. The first lens corrects hyperopia/myopia in the eye. The second lens forms the image on the monitor screen. The rat eye model was adapted from the literature.18 The corresponding parameters are listed in Table 1 and the schematic is shown in Fig. 1(b). The dispersion curve was extended to a range of 400 to 800 nm using Sellmeier equation. 21 In the simulation, light source was at the center of the retina and the pupil diameter was 4 mm. The imaging resolution was analyzed on the monitor screen. The imaging system was optimized for the 580 nm wavelength. As illustrated in Fig. 1(c), due to chromatic aberration, when illumination wavelength changes, the focus of imaging light will shift away from the monitor screen, causing an imaging plane offset.
Fig. 1.
Schematic of simulation study: (a) simulated retinal imaging system, (b) geometry of the rat eyeball model, and (c) optical focuses of different wavelengths with respect to the monitor screen. Blue: 400 nm; green: 580 nm; red: 800 nm.
Table 1.
Geometrical and optical parameters of the rat eye used in simulation.
| Surface (content) | (mm) | (mm) | (dimensionless) | ||||
|---|---|---|---|---|---|---|---|
| 400 nm | 500 nm | 600 nm | 700 nm | 800 nm | |||
| Cornea, anterior | 0.156 | 1.4007 | 1.3863 | 1.3821 | 1.3785 | 1.3732 | |
| Cornea, posterior | |||||||
| Aqueous | 0.708 | — | 1.3441 | 1.3367 | 1.3328 | 1.3305 | 1.3291 |
| Lens, anterior | 3.814 | 1.4926 | 1.4782 | 1.4715 | 1.4678 | 1.4655 | |
| Lens, posterior | 2.441 | ||||||
| Vitreous | 1.626 | — | 1.3436 | 1.3368 | 1.3332 | 1.3310 | 1.3296 |
| Retina | — | 3.706 | — | — | — | — | — |
Note: (mm), thickness; (mm): curvature radius; (dimensionless), refractive index.
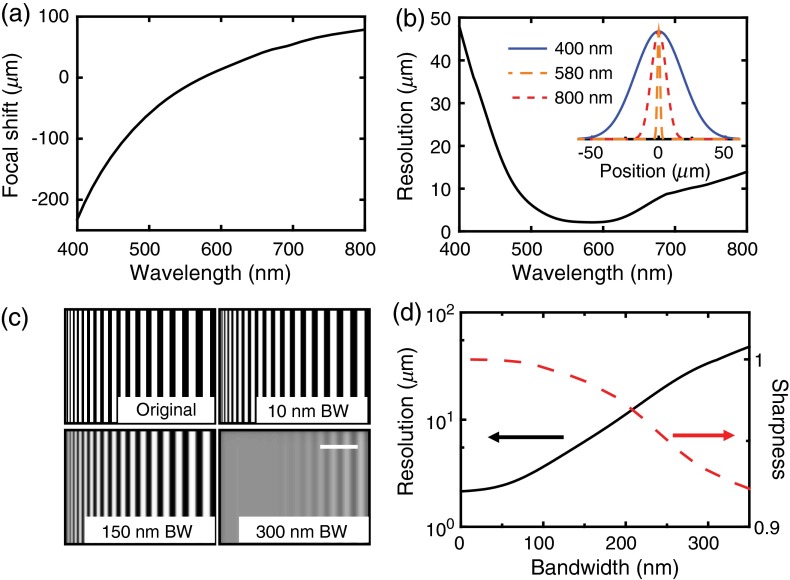
The simulation results are shown in Fig. 2. The focal shift as a function of wavelength was calculated at the center of the field of view. As shown in Fig. 2(a), focal length increases with longer wavelength. The focal shift is more than within the visible-light spectral range from 400 to 700 nm, which exceeds the thickness of rat retina ().22 This result is consistent with previously reported results.13 The simulated imaging resolution as a function of wavelength is shown in Fig. 2(b). The representative point spread functions under three wavelengths are given in the inset. The resolution at 580 nm is . Due to focal point shift, the resolution degraded to at 400 nm and at 800 nm.
Fig. 2.
Simulation results: (a) focal shift as a function of center wavelength; (b) resolution variation as a function of center wavelength, inset is the corresponding point spread function under three color-coded wavelengths (400, 580, and 800 nm); (c) computer generated grating pattern images under different illumination bandwidths. BW, bandwidth; scale bar: . (d) Resolution (black solid line) and sharpness (red dashed line) as functions of illumination bandwidth.
Figure 2(b) also implies that the resolution highly relies on the illumination bandwidth. We calculated the resolution as a function of illumination bandwidth [defined by full width at half maximum (FWHM) value] with 580 nm center wavelength. We used a rectangular spectral window to select bandwidth. Other spectral window selection may slightly change the resolution, e.g., Gaussian window reduced the resolution by compared with rectangular window in a numerical simulation. As shown in Fig. 2(d) (black solid line), the resolution degrades with increasing bandwidth. When the illumination bandwidth is , such as in retinal oximetry,23 the theoretical resolution is . Such resolution enables visualization of large capillaries. When the bandwidth is , as commonly used in commercial fundus camera (halogen lamp or Xenon lamp illumination24), the resolution is limited to , resolving only major retinal vessels.
Accurate in vivo verification of retinal image resolution in rodents could be challenging. To quantitatively compare our simulation with experiments, we adopted the image sharpness metric as the evaluation parameter.25 The sharpness is defined as
| (1) |
where is the intensity of the ’th pixel, and the summation is taken within a selected region of interest. To calculate the sharpness in our simulation, we used grating patterns (grating linewidth changes from 1 to ) as the original image. The original image was then convoluted with the point spread function of different illumination bandwidths to mimic the captured images. Typical images with different illumination bandwidths are shown in Fig. 2(c). The corresponding bandwidth-dependent sharpness is given by the red dashed line in Fig. 2(d). When the illumination bandwidth increases, resolution degrades and the sharpness decreases monotonically.
The simulation results suggest that to obtain high-resolution rat fundus images, broadband illumination should be avoided; a simple combination of fundus camera and narrow-band illumination may provide rodent fundus images at qualities comparable to human images.
3. Experimental Setup
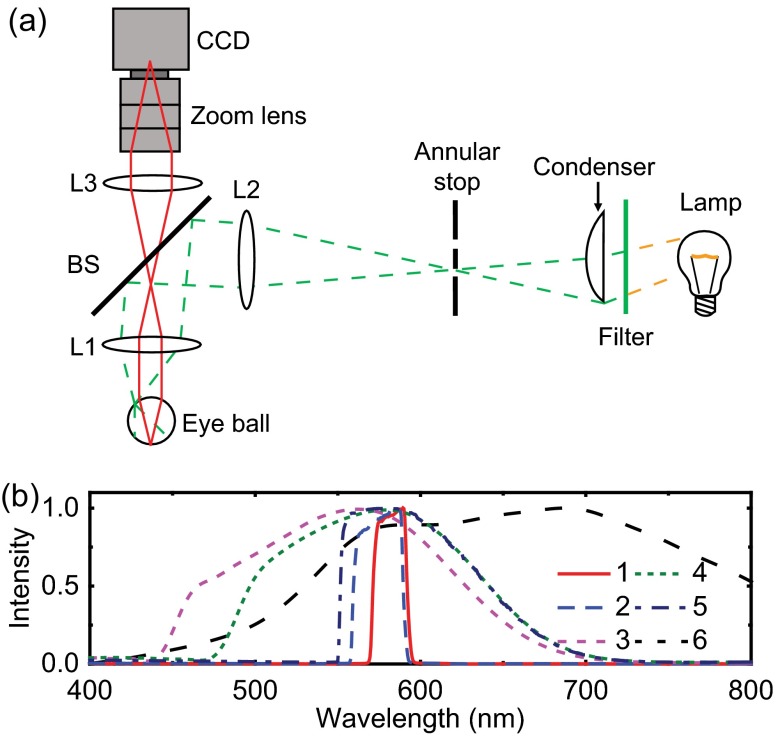
We experimentally studied the influence of chromatic aberration on rat retinal images using a home-built fundus camera and compared the experimental results with our simulated results. The schematic of the experimental setup is shown in Fig. 3. As shown in Fig. 3(a), the light from a halogen lamp was collected by a diffusive condenser (ACL2520-DG6, Thorlabs) and then passed through an annular stop to form a ring-shaped illumination pattern. The illumination ring was projected on to the rat cornea by achromatic lenses L1 () and L2 (). The reflected light from retina was collected by achromatic lenses L1 and L3 (), and imaged on a CCD (Pixelfly qe, PCO AG; video mode, 200 ms integration) after passing through a low-distortion zoom lens (M3Z1228C-MP, Computar, Japan). The rat eye hyperopia/myopia was corrected by adjusting the zoom lens focus. As shown in Fig. 3(b), we used six illumination bandwidths ranging from 19 to 270 nm, which were created by placing different band-pass filters in front of the condenser.
Fig. 3.
Schematic of the experimental setup. (a) Home-built fundus camera for rats. Green dashed line: illumination light path; red solid line: detection light path. BS, beam splitter; L1 to L3, achromatic lenses with focal lengths of 25, 60, and 50 mm, respectively. Maximum field of view: 53 deg. (b) Spectral profiles of six illuminations used in the experimental studies. Bandwidth—1: 19 nm, 2: 30 nm, 3: 89 nm, 4: 143 nm, 5: 162 nm, 6: 270 nm. Center wavelength—1: 580 nm, 2: 575 nm, 3: 595 nm, 4: 580 nm, 5: 547 nm, 6: 657 nm.
4. Animal Preparation
We imaged both wild-type albino and pigmented rats (250-g Sprague Dawley and Long Evans rats; Charles River Laboratories). During experiments, animals were anesthetized by a mixture of isoflurane and normal air (2% isoflurane at for 10 min and 1.5% at in the following experiments). The rat eyes were anesthetized using a drop of 0.5% tetracaine hydrochloride ophthalmic solution and dilated using a drop of 1% tropicamide ophthalmic solution. During experiments, rats were placed on a homemade animal holder. Artificial tears were applied every other minute.26
We carefully adjusted the image focal plane under the illumination of 580 nm center wavelength, 19 nm bandwidth, and visually determined the sharpest image quality. This focal plane was fixed and applied for all the other bandwidths to avoid displacement caused by multiple adjustments and to keep the whole procedure short. The first five images were taken with filters in a sequence from narrow to broad bandwidths (1: 19 nm; 2: 30 nm; 3: 89 nm; 4: 143 nm; and 5: 162 nm). The sixth image was taken directly with halogen light illumination (6: 270 nm, full bandwidth). At last, one more image was taken with the 19-nm-bandwidth filter to confirm the consistency of imaging condition and eye condition. The time interval between two image acquisitions was 3 min. All experiments were performed in compliance with the ARVO Statement for the Use of Animals in Ophthalmic and Vision Research and were approved by the Animal Care and Use Committee of Northwestern University.
5. In Vivo Imaging Results
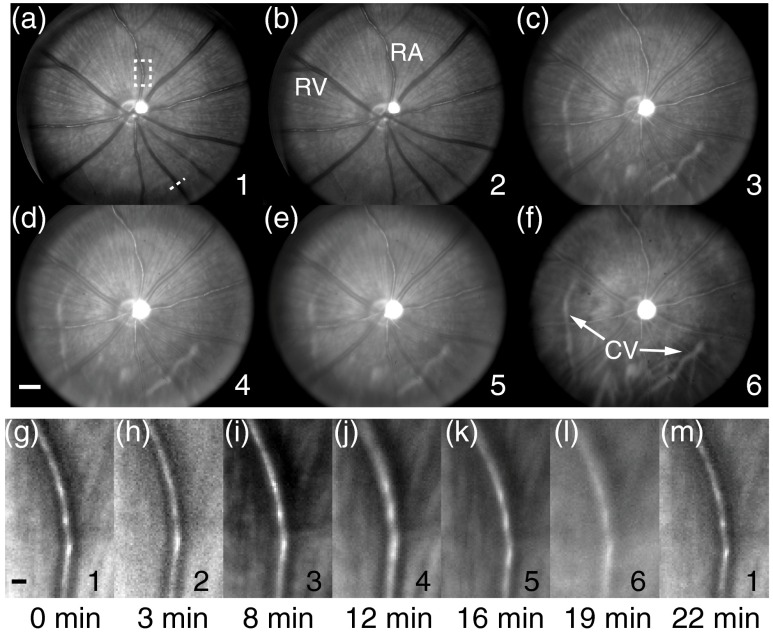
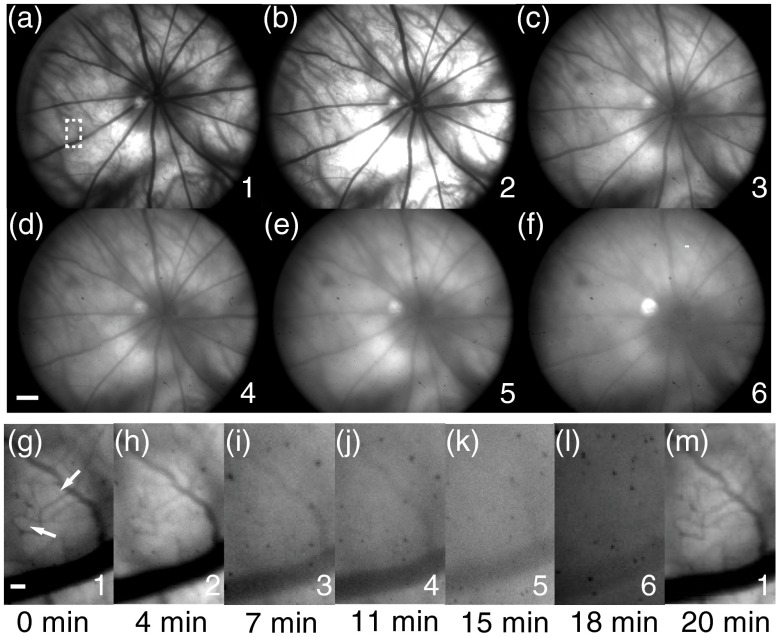
The images acquired from a pigmented rat are shown in Fig. 4. Comparing results acquired from the widest (270 nm) to the narrowest (19 nm) bandwidth [Figs. 4(a)–4(f)], we can clearly observe the sharpness degrading. The degradation is better visualized in Figs. 4(g)–4(m), where a vessel segment as highlighted in Fig. 4(a) is magnified. The observed degradation pattern is consistent with our simulation prediction. The images have no clear degradation between the 19- and 30-nm illuminations, but are gradually blurred when using broader-band illumination. The small features such as retinal nerve fibers and some retinal vessel branches are resolved under the 19-nm-bandwidth illumination but cannot be clearly seen under the 270-nm-bandwidth illumination. Arteries and veins can be distinguished as a result of different extinction coefficients of oxygenated and deoxygenated hemoglobin.26 Choroidal vessels are better visualized under broadband illumination due to increased NIR light power and low optical absorption of melanin in retinal pigment epithelium layer within the NIR spectral range.27 As shown in Fig. 4(m), we repeated the 19-nm illumination after we finished all six acquisitions at the 22nd minute. Visually, the first and last 19-nm images have similar image quality, suggesting no significant change in optical conditions in both the rodent eye and our experimental setup during data acquisition.
Fig. 4.
Retinal images of a pigment eye with six different illuminations. (a) to (f) Full-field fundus images. Numbers in the lower right represent different illuminations defined in Fig. 3. RA, retinal artery; RV, retinal vein; CV, choroidal vessel; bar: 500 mm. Dashed line in (a): location of the vessel intensity profile in Fig. 6(a). (g) to (m) Magnified views of a vessel segment highlighted by the white dashed box in (a). The capture time with respect to the first image is shown below the images. Bar: 50 mm. The image intensity for each illumination spectrum is rescaled separately to compensate for different illumination intensities.
Typical fundus images from albino rats are shown in Fig. 5. Due to the lack of pigment, retinal capillaries and choroidal vessels can all be seen under the 19-nm-bandwidth illumination [Fig. 5(a)]. Similar to what was observed in pigmented rats, the image sharpness degrades quickly with increasing bandwidth. Under the 270-nm-bandwidth illumination, only the major retinal vessels and large choroidal vessels can be vaguely observed [Fig. 5(f)].
Fig. 5.
Retinal images of an albino eye with six different illuminations. (a) to (f) Full-field fundus images. Numbers in the lower right represent different illuminations defined in Fig. 3. Bar: 500 mm. (g) to (m) Magnified views of a vessel segment highlighted by the white dashed box in (a). The white arrows in (g) indicate vessels in diameter. Bar: 50 mm. The image intensity for each illumination spectrum is rescaled separately to compensate for different illumination intensities.
Image quality and sharpness degradation become better visualized in the magnified views as shown in Figs. 5(g)–5(m). Under the 19-nm illumination, most retinal capillaries are imaged, where the smallest distinguishable capillary is estimated to be [white arrow in Fig. 5(g)]. This resolution is comparable with commercial human fundus camera performance.28,29 It is notable that Fig. 5(m) is less sharp than Fig. 5(g), but is better than Fig. 5(h), suggesting a minor change in the imaging condition. Unlike in pigmented rats, the images significantly blurred when the illumination bandwidth is broader than 30 nm and capillaries could no longer be observed beyond the 89-nm-bandwidth illumination. Such phenomenon is consistent with the impaired visual acuity of albino rats.30
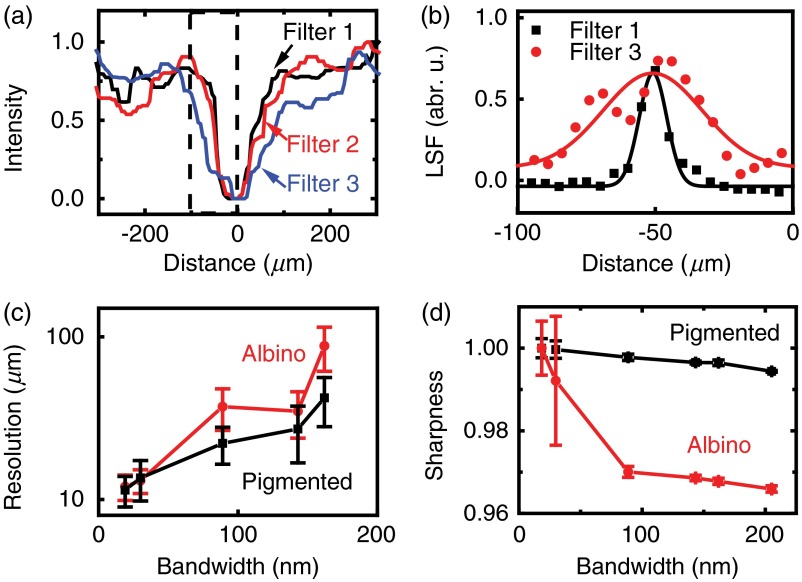
We estimated in vivo imaging resolution by measuring the line spread function of selected vessel edges. We first extracted the intensity profiles of a retinal vessel cross-section [Fig. 6(a)]. We then calculated the line spread function by taking the first derivative of the vessel edge profiles [Fig. 6(b)]. The resolution was obtained by Gaussian fitting the FWHM of the line spread function. The results are shown in Fig. 6(c). The resolution for each illumination bandwidth is the mean value calculated from all the main retinal vessels. The image resolution degrades with increasing bandwidth in both pigmented and albino eyes; however, the resolution in albino eyes degrades faster than that in pigmented eyes. The best resolution is , obtained under the 19-nm band filter. The best resolution is also consistent with our retinal image observation in Fig. 5(g).
Fig. 6.
In vivo image resolution and sharpness analysis. (a) Retinal vessel intensity profiles in the location labeled by the dashed line in Fig. 4(a), (b) line spread function calculated from the vessel edge labeled in dashed box in (a), (c) resolution as a function of illumination bandwidth in pigmented eyes and albino eyes, and (d) sharpness degradation with increasing illumination bandwidth.
We also quantified the in vivo image quality degradation through the sharpness metric [Eq. (1)] in each image shown in Figs. 4(g)–4(l) and Figs. 5(g)–5(l). The calculated results are given in Fig. 6(d). We evenly divided the image into eight square regions, calculated the individual sharpness values, and analyzed the mean value and standard deviation through the eight regions. As shown in Fig. 6(d), only a subtle sharpness decrease exists when the illumination bandwidth was changed from 19 to 30 nm. Then the sharpness drops monotonically with the increasing illumination bandwidth, which is consistent with the simulated results. We observed a faster sharpness drop in albino eyes than in pigmented eyes, which is consistent with Fig. 6(c). The simulated resolution and sharpness degradation shown in Fig. 2(d) are similar to the results from pigmented eye, but different from albino eye, suggesting that the eye model parameters listed in Table 1 represent pigmented eyes better than albino eyes. The sharpness value ratio between Figs. 4(m) and 4(g) is 0.999, and is 0.996 between Figs. 5(m) and 5(g), suggesting minor image quality changes in both pigmented and albino eyes.
In both albino and pigmented retinal images, smaller illumination bandwidths have relatively larger standard deviation of sharpness. This phenomenon is likely caused by the nonuniform distribution of small structures (nerve fibers and capillaries) on retina. Sharpness value depends on both optical resolution and the original pattern of the imaged area. Under narrow-bandwidth illumination, small and nonuniform structures could be resolved by the high resolution. The image sections with different retinal small structures could result in a large variation of sharpness value and cause a large error bar. On the other hand, under large illumination bandwidth, less small structures could be resolved by reduced resolution. The sharpness will drop and the values from different sections tend to converge, resulting in smaller error bars.
6. Discussion and Conclusion
Regarding the illumination bandwidth selection, ideally, monochromatic illumination could provide the best resolution according to our simulation. However, practically, pure monochromatic illumination is rarely used in fundus camera due to the speckle. To sufficiently reduce speckle while maintaining resolution at an acceptable level, we suggest using a 10- to 20-nm-bandwidth illumination. The simulation result in Fig. 2(c) shows only a small resolution difference between monochromatic illumination ( resolution) and 20-nm-bandwidth illumination ( resolution). Experimentally, images with resolution, comparable with human fundus camera,28,29 are also demonstrated under 19-nm-bandwidth resolution. Such narrow-band illumination could be achieved by off-the-shelf band-pass filters or directly using narrow-band light-emitting diode illuminations.
Retinal oximetry is one of the important applications of multiwavelength fundus camera.23 The reported wavelength bandwidth varies from 30 to 280 nm, depending on different methods and algorithms.23 However, the degraded image qualities under large illumination bandwidth might seriously affect the accuracy of retinal oximetry. According to Figs. 4 and 5, we suggest using wavelength ranges of 90 nm in pigmented eyes and 30 nm in albino eyes for retinal oximetry.
In conclusion, we have numerically and experimentally studied the influence of chromatic aberration and optical illumination bandwidth on rat retinal images. We achieved image resolution of 10 μm using a 19-nm-bandwidth illumination, which is comparable with commercial fundus cameras used on human eyes. Furthermore, we observed more severe chromatic aberration in albino rat eyes than pigmented eyes. Our method may also benefit the system design in multichromatic imaging methods, including adaptive optics imaging, hyperspectral retinal imaging, and optical spectroscopic applications such as retinal oximetry.
Acknowledgments
We sincerely acknowledge the generous support from the National Institutes of Health (1R01EY019951, 2R01EY019484, and 1R24EY022883) and National Science Foundation (CBET-1055379, CBET-1066776, and BDI-1353952). W. Liu is supported by the International Graduate Research Fellowship from the Howard Hughes Medical Institute. H. F. Zhang has financial interests in Opticent Health Inc., which, however, did not support this work.
Biographies
Hao Li is a postdoctoral researcher in the Biomedical Engineering Department at Northwestern University. He received his BS and PhD in optics from Fudan University, China.
Wenzhong Liu is a graduate student in the Biomedical Engineering Department at Northwestern University. He received his MS in biomedical engineering from Shanghai Jiaotong University, China.
Hao F. Zhang received his PhD in biomedical engineering from Texas A&M University, College Station, Texas, in 2006. He is currently an associate professor in the Department of Biomedical Engineering and Department of Ophthalmology at Northwestern University, Evanston, Illinois. His research interests include optical microscopy, nonlinear optics, laser-tissue interaction, retinal imaging, and image processing
References
- 1.Gibbs R. A., et al. , “Genome sequence of the brown Norway rat yields insights into mammalian evolution,” Nature 428(6982), 493–521 (2004). 10.1038/nature02426 [DOI] [PubMed] [Google Scholar]
- 2.Church D. M., et al. , “Lineage-specific biology revealed by a finished genome assembly of the mouse,” PLoS Biol. 7(5), e1000112 (2009). 10.1371/journal.pbio.1000112 [DOI] [PMC free article] [PubMed] [Google Scholar]
- 3.Capecchi M. R., “Generating mice with targeted mutations,” Nat. Med. 7(10), 1086–1090 (2001). 10.1038/nm1001-1086 [DOI] [PubMed] [Google Scholar]
- 4.Geurts A. M., et al. , “Knockout rats via embryo microinjection of zinc-finger nucleases,” Science 325(5939), 433 (2009). 10.1126/science.1172447 [DOI] [PMC free article] [PubMed] [Google Scholar]
- 5.Zeiss C. J., “Review paper: animals as models of age-related macular degeneration: an imperfect measure of the truth,” Vet. Pathol. 47(3), 396–413 (2010). 10.1177/0300985809359598 [DOI] [PubMed] [Google Scholar]
- 6.Chou J., Rollins S., Fawzi A. A., “Role of endothelial cell and pericyte dysfunction in diabetic retinopathy: review of techniques in rodent models,” Adv. Exp. Med. Biol. 801, 669–675 (2014). 10.1007/978-1-4614-3209-8_84 [DOI] [PMC free article] [PubMed] [Google Scholar]
- 7.Bouhenni R. A., et al. , “Animal models of glaucoma,” J. Biomed. Biotechnol. 2012, 692609 (2012). 10.1155/2012/692609 [DOI] [PMC free article] [PubMed] [Google Scholar]
- 8.LaVail M. M., Battelle B. A., “Influence of eye pigmentation and light deprivation on inherited retinal dystrophy in the rat,” Exp. Eye Res. 21(2), 167–192 (1975). 10.1016/0014-4835(75)90080-9 [DOI] [PubMed] [Google Scholar]
- 9.Link D., et al. , “Novel non-contact retina camera for the rat and its application to dynamic retinal vessel analysis,” Biomed. Opt. Express 2(11), 3094–3108 (2011). 10.1364/BOE.2.003094 [DOI] [PMC free article] [PubMed] [Google Scholar]
- 10.Ruggeri M., et al. , “In vivo three-dimensional high-resolution imaging of rodent retina with spectral-domain optical coherence tomography,” Invest. Ophthalmol. Vis. Sci. 48(4), 1808–1814 (2007). 10.1167/iovs.06-0815 [DOI] [PubMed] [Google Scholar]
- 11.Paques M., et al. , “High resolution fundus imaging by confocal scanning laser ophthalmoscopy in the mouse,” Vis. Res. 46(8–9), 1336–1345 (2006). 10.1016/j.visres.2005.09.037 [DOI] [PubMed] [Google Scholar]
- 12.Jiao S., et al. , “Photoacoustic ophthalmoscopy for in vivo retinal imaging,” Opt. Express 18(4), 3967–3972 (2010). 10.1364/OE.18.003967 [DOI] [PMC free article] [PubMed] [Google Scholar]
- 13.Zhou X., Bedggood P., Metha A., “Limitations to adaptive optics image quality in rodent eyes,” Biomed. Opt. Express 3(8), 1811–1824 (2012). 10.1364/BOE.3.001811 [DOI] [PMC free article] [PubMed] [Google Scholar]
- 14.Geng Y., et al. , “Optical properties of the mouse eye,” Biomed. Opt. Express 2(4), 717–738 (2011). 10.1364/BOE.2.000717 [DOI] [PMC free article] [PubMed] [Google Scholar]
- 15.Geng Y., et al. , “In vivo imaging of microscopic structures in the rat retina,” Invest. Ophthalmol. Vis. Sci. 50(12), 5872–5879 (2009). 10.1167/iovs.09-3675 [DOI] [PMC free article] [PubMed] [Google Scholar]
- 16.Jian Y., et al. , “Wavefront sensorless adaptive optics optical coherence tomography for in vivo retinal imaging in mice,” Biomed. Opt. Express 5(2), 547–559 (2014). 10.1364/BOE.5.000547 [DOI] [PMC free article] [PubMed] [Google Scholar]
- 17.Geng Y., et al. , “Adaptive optics retinal imaging in the living mouse eye,” Biomed. Opt. Express 3(4), 715–734 (2012). 10.1364/BOE.3.000715 [DOI] [PMC free article] [PubMed] [Google Scholar]
- 18.Chaudhuri A., Hallett P. E., Parker J. A., “Aspheric curvatures, refractive indices and chromatic aberration for the rat eye,” Vis. Res. 23(12), 1351–1363 (1983). 10.1016/0042-6989(83)90146-3 [DOI] [PubMed] [Google Scholar]
- 19.Hughes A., “A schematic eye for the rat,” Vis. Res. 19(5), 569–588 (1979). 10.1016/0042-6989(79)90143-3 [DOI] [PubMed] [Google Scholar]
- 20.Bedford R. E., Wyszecki G., “Axial chromatic aberration of the human eye,” J. Opt. Soc. Am. 47(6), 564_1–565 (1957). 10.1364/JOSA.47.0564_1 [DOI] [PubMed] [Google Scholar]
- 21.Li C. L., Sasian J., “Adaptive dispersion formula for index interpolation and chromatic aberration correction,” Opt. Express 22(1), 1193–1202 (2014). 10.1364/OE.22.001193 [DOI] [PubMed] [Google Scholar]
- 22.Luan H., et al. , “Retinal thickness and subnormal retinal oxygenation response in experimental diabetic retinopathy,” Invest. Ophthalmol. Vis. Sci. 47(1), 320–328 (2006). 10.1167/iovs.05-0272 [DOI] [PubMed] [Google Scholar]
- 23.Harris A., et al. , “A review of methods for human retinal oximetry,” Ophthal. Surg. Las. Im. 34(2), 152–164 (2003). [PubMed] [Google Scholar]
- 24.Topcon Inc., “Retinal Diagnosis Instruments,” http://www.topcon.com.sg/medical/trc.html
- 25.Sulai Y. N., Dubra A., “Non-common path aberration correction in an adaptive optics scanning ophthalmoscope,” Biomed. Opt. Express 5(9), 3059–3073 (2014). 10.1364/BOE.5.003059 [DOI] [PMC free article] [PubMed] [Google Scholar]
- 26.Song W., et al. , “A combined method to quantify the retinal metabolic rate of oxygen using photoacoustic ophthalmoscopy and optical coherence tomography,” Sci. Rep. 4, 6525 (2014). 10.1038/srep06525 [DOI] [PMC free article] [PubMed] [Google Scholar]
- 27.Liu T., et al. , “Near-infrared light photoacoustic ophthalmoscopy,” Biomed. Opt. Express 3(4), 792–799 (2012). 10.1364/BOE.3.000792 [DOI] [PMC free article] [PubMed] [Google Scholar]
- 28.Boes D. A., Clifton B. C., Mills R. P., “Resolution of Nidek 3-dx, Zeiss, Canon, and Topcon fundus cameras,” J. Glaucoma 3(3), 190–200 (1994). 10.1097/00061198-199400330-00003 [DOI] [PubMed] [Google Scholar]
- 29.NIDEK CO., LTD, “Auto Fundus Camera ORION,” http://www.nidek-intl.com/product/ophthaloptom/diagnostic/dia_retina/orion.html.
- 30.Prusky G. T., et al. , “Variation in visual acuity within pigmented, and between pigmented and albino rat strains,” Behav. Brain Res. 136(2), 339–348 (2002). 10.1016/S0166-4328(02)00126-2 [DOI] [PubMed] [Google Scholar]


