

Abstract
Objectives
To assess variation in the use of computed tomography (CT) for pediatric injury-related emergency department (ED) visits.
Study design
Retrospective cohort study of visits to 14 network-affiliated EDs from November 2010 through February 2013. Visits were identified by International Classification of Diseases, 9th revision, Clinical Modification diagnosis codes. Primary outcome was CT use. We used descriptive statistics and performed multivariable logistic regression to evaluate the association of patient and ED covariates on any and body region-specific CT use.
Results
Of the 80,868 injury-related visits, 11.4% included CT, and 28.4% of those had more than one study. Across EDs, CT use ranged from 7.6%- 25.5% of visits and did not correlate with institutional injury severity score (P=0.33) or admission/transfer rates (P=0.07). In multivariable analysis of non-pediatric EDs, trauma centers and non-academic EDs were associated with CT use. Higher pediatric volume was associated with any CT use, however, there was an inverse relationship between volume and non-head CT use. When the pediatric ED was included in multivariable modeling, the effect of level 1-3 trauma center designation remained, and the pediatric level 1 trauma center was less likely to use most body region-specific CTs.
Conclusions
There is wide variation in CT imaging for pediatric injury-related visits not solely attributable to case mix. Future work to optimize CT utilization should focus on additional factors contributing to imaging practices and interventions.
Keywords: emergency department, injury severity score, trauma
Injuries are the leading cause of morbidity and mortality among children in the United States.(1) Computed tomography (CT) is the most sensitive modality to evaluate for acute traumatic injuries.(2) In general, advanced imaging for injury-related diagnoses has increased over time without comparable increases in the severity of diagnoses or changes in management.(3,4) CT-associated radiation as a cause of future cancers, particularly in the radiosensitive pediatric population, has been a topic of high concern, specifically in light of recent epidemiologic data.(5-7) The increase in CT use has led to concerns from the public, policy makers, and patients regarding cost, resource utilization, radiation risk, and overall appropriateness of use.(8-10) The increase in use is not uniform across all diagnoses and institutions,(11-13) and identification of significant variation in CT use presents an opportunity for practice improvement and the potential for optimizing CT utilization. Our objective was to assess ED-level variation in CT utilization for pediatric injury-related visits.
Methods
We performed a retrospective observational study of visits to 14 EDs within a large, regional, integrated health network from November 2010 through February 2013. The health system represents the largest in the area and receives transfers from within and outside of the network. Transfers from within the health system to an ED outside of the network are rare. We included visits by patients less than 19 years of age with at least one final injury-related International Classification of Diseases, 9th revision, Clinical Modification (ICD9-CM) diagnosis(14) (of 25 possible diagnosis positions in the medical record) (Table I). In cases of transferred patients, we included imaging at the transferring institution, and excluded the visit to the receiving ED in order not to underestimate CT use at the receiving ED. We defined transfers as those visits to a second ED that were within 1 calendar day of the index visit. We also excluded those visits with only an ICD9-CM diagnosis code related to a burn as the Injury Severity Score (ISS), which was used as a measure of injury severity in our study, is not applicable to burn patients. The institutional review board at our institution approved the protocol with a waiver of informed consent.
Table 1. Characteristics of visits by discharge diagnosis codes (N= 80,868).
| Number of visits (%) | Number of visits with CT performed (%)1 | |
|---|---|---|
| ICD9-CM diagnosis2 | ||
| 851-854 Intracranial injury, excluding skull fracture and concussion | 203 (0.3) | 142 (70.0) |
| 800-804 Fracture of skull | 1233 (1.5) | 851 (69.0) |
| 805-806 Fracture of vertebral column with or without spinal cord injury | 188 (0.2) | 118 (62.8) |
| 860-869 Internal injury of thorax, abdomen, and pelvis | 382 (0.5) | 203 (53.1) |
| 807-809 Fracture of bones of the trunk (e.g. ribs, pelvis) | 247 (0.3) | 130 (52.6) |
| 850 Concussion | 5135 (6.3) | 2565 (50.0) |
| 950-957 Injury to nerves and spinal cord | 83 (0.1) | 30 (36.1) |
| 900-904 Injury to blood vessels | 54 (0.1) | 16 (29.6) |
| 958-959 Certain traumatic complications and unspecified injuries | 9497 (11.7) | 2677 (28.2) |
| 905-908, 909.2, 909.4, 909.9 Late effects of injuries, poisonings, toxic effects, and other external causes | 285 (0.4) | 77 (27.0) |
| 920-924 Contusion with intact skin | 16350 (20.2) | 2571 (15.7) |
| 995.5, 995.80-995.85 Child and adult maltreatment, neglect, or abuse | 644(0.8) | 101 (15.7) |
| 990-994.9 Other and unspecified effects of external causes | 245 (0.3) | 33 (13.5) |
| 996-999 Complications of surgical and medical care, not elsewhere classified | 2622 (3.1) | 312 (11.9) |
| 910-919 Superficial injury | 8162 (10.1) | 935 (11.5) |
| 870-879 Open wound of head, neck, and trunk | 12096 (15.0) | 1152 (9.5) |
| 820-829 Fracture of lower limb | 3204 (4.0) | 295 (9.2) |
| 840-848 Sprains and strains of joints and adjacent muscles | 14557 (18.0) | 1066 (7.3) |
| 810-819 Fracture of upper limb | 7912 (9.8) | 340 (4.3) |
| 960-979 Poisoning by drugs, medicinal and biological substances | 1366 (1.7) | 59 (4.3) |
| 830-839 Dislocation | 1738 (2.1) | 72 (4.1) |
| 890-897 Open wound of lower limb | 2340 (2.9) | 78 (3.3) |
| 880-887 Open wound of upper limb | 3506 (4.3) | 86 (2.5) |
| 980-989 Toxic effects of substances chiefly nonmedicinal as to source | 1127 (1.4) | 21 (1.9) |
| 925-929 Crushing injury | 271 (0.3) | 5 (1.8) |
| 930-939 Effects of foreign body entering through body orifice | 2833 (3.5) | 33 (1.2) |
| Age | ||
| <1 year | 2733 (3.4) | 579 (21.2) |
| 1-4 years | 19017 (23.5) | 1354 (7.1) |
| 5-9 years | 16592 (20.5) | 1294 (7.8) |
| 10-14 years | 22954 (28.4) | 2567 (11.2) |
| 15-18 years | 19572 (24.2) | 3419 (17.5) |
| Sex- Male | 46847 (57.9) | 5768 (12.3) |
| Race/ethnicity | ||
| White, non-Hispanic | 60198 (74.4) | 7426 (12.3) |
| Black, non-Hispanic | 18302 (22.6) | 1539 (8.4) |
| Other3 | 1181 (1.5) | 119(10.1) |
| Missing | 1187 (1.5) | 129 (10.9) |
| Insurance | ||
| Private | 46230 (57.2) | 5251 (11.4) |
| Medicaid | 29453 (36.4) | 2836 (9.6) |
| Self-pay | 2829 (3.5) | 255 (9.0) |
| Other4 | 2350 (2.9) | 871 (37.1) |
| Missing | 6 (0) | 0 (0) |
| Disposition | ||
| Discharged | 76995 (95.2) | 7770 (10.1) |
| Transferred | 866 (1.1) | 195 (22.5) |
| Admitted (floor) | 2464 (3.0) | 930 (37.7) |
| Admitted (ICU) | 543 (0.7) | 318 (58.6) |
| Number of injuries5 | ||
| 1 | 68580 (84.8) | 5735 (8.4) |
| 2 | 9757 (12.1) | 2338 (24.0) |
| 3 | 1734 (2.1) | 712 (41.1) |
| 4 | 507 (0.6) | 257 (50.7) |
| 5 | 164 (0.2) | 86 (52.4) |
| 6 | 71 (0.1) | 45 (63.4) |
| ≥7 | 55 (0.1) | 40 (72.7) |
| ISS | ||
| Mild 1-8 | 79416 (98.2) | 8501 (10.7) |
| Moderate 9-15 | 1125 (1.4) | 506 (45.0) |
| Severe >15 | 3247(0.4) | 206 (63.0) |
Percentages represent proportion of visits that included at least one CT
Each visit could be associated with more than one injury-related ICD9-CM diagnosis code
Asian (N=721), Hispanic (N=338), American Indian/Native Hawaiian (N=122)
Auto accident insurance (N=2087), worker's compensation(N=260), other not specified (N= 3)
Number of ICD9-CM injury diagnosis codes for an individual visit
We collected the following demographic variables: age, sex, race/ethnicity, primary insurance, and final disposition. We defined age based on clinically significant categories, specifically including those 15-18 years of age in a separate category, as some of the non-pediatric EDs preferentially care for this group of patients (i.e. in many cases, patients <15 years of age who are designated as trauma patients prior to arrival to the ED, will be taken to the pediatric trauma center). We defined injury severity based on the ISS. Scores of 1 through 8 were considered minor, 9 through 15 were considered moderate, and scores greater than 15 were considered severe.(15) We used the ICD Programs for Injury Categorization,(16) a validated method to translate ICD9-CM diagnosis codes into ISS scores.(15,17) Some ICD9-CM codes (N=5961) were translated into ISS scores of 0 (905-908, 909.2, 909.4, 909.9, 920-924, 930-939, 958-959, 960-979, 980-994, 995.5, 995.80-995.85) and were included in the “minor” ISS category. We collected the following ED-level covariates: trauma center designation, academic status, and annual pediatric visit volume. Pediatric annual visit volume was categorized by quartiles based on the mean annual volumes of pediatric patients across the years of the study for each ED. Trauma center designation was defined according to the accreditation assigned by the state Trauma Systems Foundation and level I trauma centers were further categorized as pediatric and non-pediatric. An academic ED was defined as one in which emergency medicine residents rotated.
The primary outcome was whether CT was performed during the ED visit, as extracted from the documented radiology procedures performed during the patient's visit. We consolidated CTs into 8 meaningful categories: head, cervical spine, abdomen, chest, face, spine (non-cervical), extremity, and neck (eg, pelvis CT was included as an abdomen, orbit CT was included as a face CT, neck CT were those CTs not of the cervical spine, including neck CT angiography and neck soft tissue CT).
We used descriptive statistics to summarize patient, visit, and ED demographic data as well as for reporting the frequency of imaging use. We calculated the visit-level proportions of CT use, ISS>8, and admissions/transfers for each ED and used Spearman's rho to evaluate the correlation between CT use and both ISS and disposition from the ED. Across the study period, approximately 20% of visits involved patients with multiple ED visits during the study period, with most of those patients appearing only twice. We, therefore, considered using generalized estimating equations, a method for dealing with correlated data while accounting for case-mix. We performed multivariable modeling with generalized estimating equations with various correlation structures, as well as logistic regression, to evaluate the association of patient and ED covariates on any CT use as well as on the most common body region-specific CT types. The differences between the two types of models were small (ie, <10% difference for odds ratios and confidence intervals without changes in statistical significance); therefore, we report the logistic regression model, which treats each visit as an independent observation. We used the Hosmer-Lemeshow goodness-of-fit test to assess the calibration of the model.
We included covariates in the model that were determined a priori to be associated with CT use, either through previous work or scientific plausibility.(12,18) When constructing the logistic regression model, we noted an age-related referral trend, with most visits by those in the youngest age group being treated at the pediatric ED and most visits by those in the oldest age group being treated at non-pediatric EDs. Given that CT imaging utilization patterns are significantly different in infants than older children,(19) likely due to several factors including difficulty in clinical evaluation and concern for non-accidental trauma, we developed logistic regression models as follows. For the first model, we included only non-pediatric EDs and evaluated the effects of trauma center designation, academic status and annual pediatric volume as ED-level covariates, as well as patient-level covariates on any and body region-specific CT use. For the second model, we included all EDs and evaluated the effects of trauma center designation and patient-level covariates (including a diagnosis of abuse) on any and body region-specific CT use. There was neither sufficient variation of academic status nor of pediatric volume within trauma center type; therefore, these variables could not be included in the second model. In addition, the variable indicating a diagnosis of abuse could not be included in the first model, given the low prevalence of abuse in the non-pediatric EDs.
We report results as odds ratios (ORs) with 95% confidence intervals (CIs). We considered P values <0.05 significant. We used SPSS, version 21, (IBM Corp, Armonk, NY) to perform all statistical analyses.
Results
There were a total of 287,409 pediatric visits to network EDs during the study period. After excluding visits by transferred patients to receiving EDs, visits without injury-specific ICD9-CM diagnosis codes, and those for isolated burns, there were 80,868 visits by 64,474 individual patients in the final cohort (Figure 1; available at www.jpeds.com). The median patient age was 10.5 years (interquartile range: 4.6-14.9); and more than half of patients were male (57.9%), White, non-Hispanic (74.4%), and had private insurance (57.2%; Table I). The vast majority of visits resulted in discharge from the ED. Of visits resulting in admission (3.7%), 18.1% required management in the intensive care unit. Most visits were by patients with injuries of minor severity, with 98.2% having an ISS ≤8. The most common injury diagnoses were contusion, sprains and strains, and open wounds of the head, neck, and trunk (Table I). The diagnoses resulting in the highest proportion of CT use were intracranial injury, skull fracture, and spine fracture. Of all injury-related visits, 11.4% (N=9213) had at least one CT performed. Of those visits in which a CT was performed, 28.4% were associated with more than one CT, 8.0% with more than 2 CTs, and the maximum number of CTs performed during a visit was 7 (n=10 visits).
Figure 1. online- Visits included in the cohort.
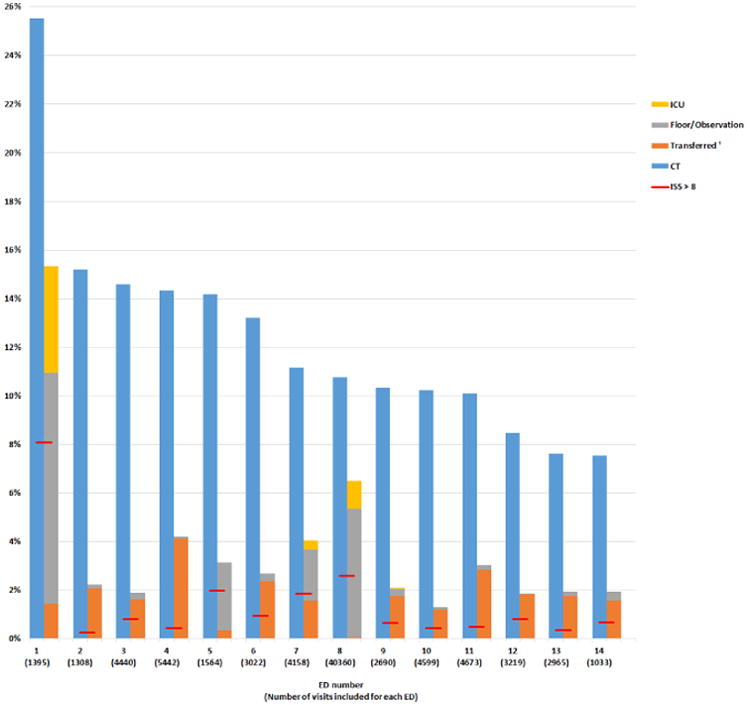
The proportion of injury-related visits resulting in CT across the 14 EDs varied from 7.6% to 25.5% (Figure 2). Proportions of visits resulting in either admission or transfer ranged from 1.3% to 15.3% and the proportion of visits with ISS>8 was 0.3% to 8.1%. There was neither a correlation between ED CT use and the proportion of patients with ISS>8 (Spearman rho= 0.28, P value= 0.33) nor ED CT use and the proportion of patients admitted/transferred (Spearman rho= 0.51, P value= 0.07).
Figure 2. Proportions of visits with a CT, admitted or transferred, and with ISS>8.
Horizontal red line represents the proportion of visits with ISS>8 at each ED
1Transferred refers to patients transferred into that hospital
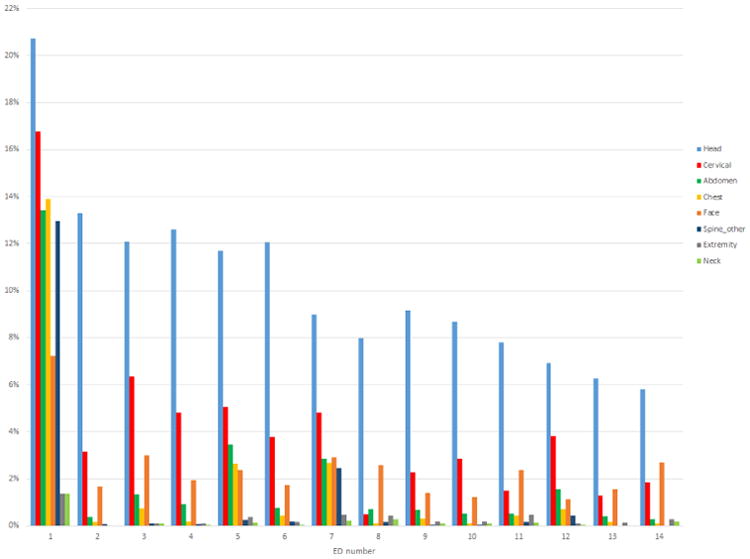
Across all EDs, head CTs were the most commonly performed CTs, and for 10 EDs, cervical spine CTs were the second most frequent type (Figure 3). Three EDs (numbers 1, 5, and 7) performed more than 2 CTs for more than 20% of their visits (Figure 4; available at www.jpeds.com). These EDs also had the highest utilization of chest and abdomen CT imaging (Figure 3), with similar utilization patterns within each of these institutions for chest and abdominal imaging, suggesting the two CTs were most often ordered together in these institutions.
Figure 3. Types of CTs across EDs.
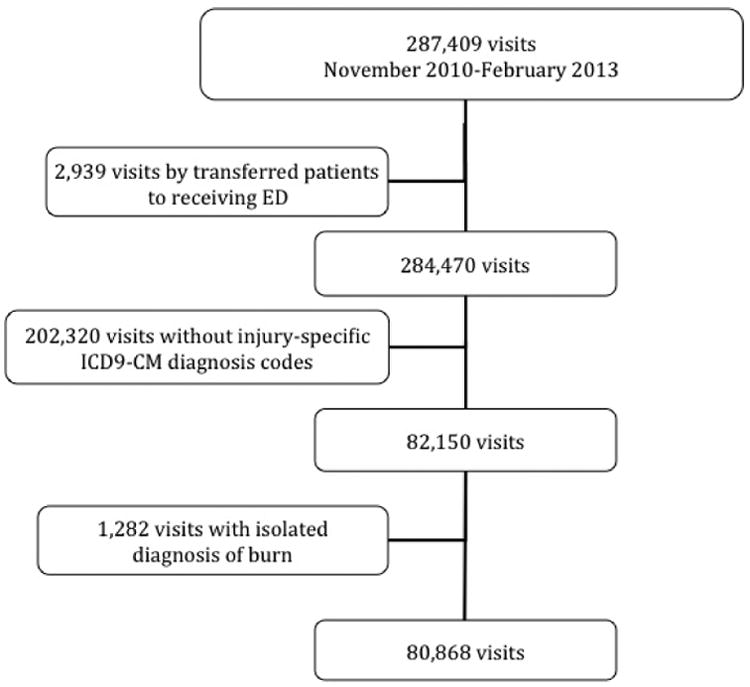
Figure 4. online- Frequency of multiple CTs in patients who underwent at least one CT.

*If a patient received more than one CT of the same type (e.g. head CT and head CT angiogram), it was counted as 2 CTs
In multivariable analysis of the non-pediatric EDs (Table II), the trauma centers and non-academic EDs had higher odds of using CT for injury-related visits. In addition, EDs with larger volumes of pediatric visits were found to have higher odds of using any CT. However, when evaluating the relationship between volume and the most common CT types, we found that for c-spine, chest, and abdomen CTs, compared with the smallest volume EDs, those with higher volumes of pediatric patients had lower odds of performing these types of CTs (Figure 5; available at www.jpeds.com). Compared with infants, patients between 1 and 9 years of age were at lower odds of CT; adolescents older than 15 years of age were at higher odds of having CT performed. Patients who were male, white, or had private or “other” insurance had higher odds of having CT during a visit for injury-related diagnoses. In addition, those with a higher ISS had higher odds of having CT performed.
Table 2. Multivariable regression model of ED and patient factors associated with performance of CT among non-pediatric EDs.
| Any CT Adjusted OR (95%CI) | Head CT Adjusted OR (95%CI) | C-spine CT Adjusted OR (95%CI) | Chest CT Adjusted OR (95%CI) | Abdomen CT Adjusted OR (95%CI) | |
|---|---|---|---|---|---|
| ED characteristics | |||||
| Trauma designation | |||||
| Not a trauma center | Referent | Referent | Referent | Referent | Referent |
| Level 1 | 1.54 (1.18, 2.00) | 1.49 (1.11, 2.00) | 3.43 (2.10, 5.58) | 75.62 (10.49, 545.00) | 20.94 (6.60, 66.37) |
| Level 2 or 3 | 1.31 (1.15, 1.49) | 1.34 (1.17, 1.54) | 3.47 (2.65, 4.54) | 2.06 (1.23, 3.44) | 2.79 (1.77, 4.39) |
| Non-academic ED | 1.51 (1.16, 1.96) | 1.54 (1.15, 2.06) | 1.84 (1.12, 3.02) | 4.62 (0.62, 34.49) | 3.88 (1.20, 12.54) |
| Annual pediatric volume | |||||
| 1st quartile | Referent | Referent | Referent | Referent | Referent |
| 2nd quartile | 1.03 (0.91, 1.16) | 1.05 (0.93, 1.20) | 1.05 (0.87, 1.28) | 0.92 (0.55, 1.53) | 0.82 (0.59, 1.14) |
| 3rd quartile | 1.33 (1.19, 1.48) | 1.39 (1.23, 1.56) | 1.10 (0.93, 1.30) | 0.37 (0.29, 0.49) | 0.54 (0.43, 0.68) |
| 4th quartile | 1.28 (1.11, 1.48) | 1.20 (1.03, 1.41) | 0.68 (0.51, 0.92) | 1.67 (0.91, 3.09) | 0.72 (0.45, 1.18) |
| Patient characteristics | |||||
| Age | |||||
| <1 year | Referent | Referent | Referent | Referent | Referent |
| 1-4 years | 0.41 (0.31, 0.53) | 0.40 (0.30, 0.52) | 0.69 (0.31, 1.54) | 0.45 (0.05, 3.93) | 0.67 (0.08, 5.45) |
| 5-9 years | 0.59 (0.46, 0.76) | 0.49 (0.38, 0.64) | 1.43 (0.66, 3.09) | 0.85 (0.11, 6.66) | 2.94 (0.40, 21.59) |
| 10-14 years | 0.93 (0.72, 1.19) | 0.77 (0.60, 1.00) | 2.81 (1.31, 5.99) | 1.89 (0.26, 13.92) | 4.52 (0.63, 32.68) |
| 15-18 years | 1.60 (1.25, 2.05) | 1.23 (0.98, 1.61) | 5.95 (2.80, 12.65) | 6.46 (0.90, 46.69) | 11.12 (1.55, 79.77) |
| Male | 1.23 (1.15, 1.31) | 1.18 (1.10, 1.26) | 1.09 (0.98, 1.21) | 1.40 (1.12, 1.75) | 1.26 (1.05, 1.51) |
| Non-White or Hispanic1 | 0.75 (0.68, 0.82) | 0.69 (0.62, 0.76) | 0.61 (0.52, 0.72) | 0.69 (0.52, 0.90) | 0.63 (0.50, 0.81) |
| Insurance status | |||||
| Private | Referent | Referent | Referent | Referent | Referent |
| Medicaid | 0.81 (0.76, 0.88) | 0.80 (0.74, 0.87) | 0.79 (0.69, 0.90) | 0.91 (0.69, 1.20) | 0.86 (0.69, 1.08) |
| Self-pay | 0.80 (0.68, 0.94) | 0.84 (0.70, 1.00) | 0.92 (0.70, 1.21) | 0.52 (0.26, 1.04) | 0.92 (0.58, 1.47) |
| Other | 3.33 (2.97, 3.73) | 3.45 (3.06, 3.88) | 6.80 (5.91, 7.83) | 9.60 (7.43, 12.40) | 7.14 (5.76, 8.86) |
| ISS | |||||
| ≤8 | Referent | Referent | Referent | Referent | Referent |
| 9-15 | 9.48 (7.45, 12.06) | 6.51 (5.13, 8.26) | 7.89 (5.96, 10.44) | 19.03 (13.33, 27.17) | 14.93 (10.85, 20.56) |
| >15 | 9.50 (5.99, 15.05) | 9.06 (5.80, 14.16) | 8.74 (5.31, 14.39) | 11.19 (6.47, 19.35) | 8.93 (5.29, 15.08) |
Non-White defined as Black, non-Hispanic, or Other compared with White as the referent group
Figure 5. online- Proportions of body region-specific CTs by annual pediatric volume quartile.

In a second multivariable model (Table III; available at www.jpeds.com) which included the pediatric ED, we found a slightly higher odds of performance of any CT at the pediatric Level 1 trauma center compared with non-trauma centers, though Level 1 and Level 2 trauma centers had up to a 42% higher odds of CT use compared with non-trauma centers. However, when evaluating the body region-specific CTs, the pediatric level I trauma center had significantly lower odds of imaging compared with non-trauma centers for head, c-spine, and chest CTs, and level 1, 2, and 3 trauma centers had substantially higher odds (Figure 6; available at www.jpeds.com). The diagnosis of abuse was associated with increased odds of imaging compared with other diagnoses. In this model, compared with infants, all age groups had decreased odds of any CT and head CT specifically.
Table 3. Multivariable regression model of ED and patient factors associated with performance of CT among all EDs.
| Any CT Adjusted OR (95%CI) | Head CT Adjusted OR (95%CI) | C-spine CT Adjusted OR (95%CI) | Chest CT Adjusted OR (95%CI) | Abdomen CT Adjusted OR (95%CI) | |
|---|---|---|---|---|---|
| ED characteristics | |||||
| Trauma designation | |||||
| Not a trauma center | Referent | Referent | Referent | Referent | Referent |
| Pediatric level 1 | 1.15 (1.09, 1.21) | 0.93 (0.88, 0.98) | 0.23 (0.19, 0.27) | 0.43 (0.29, 0.64) | 1.23 (1.01, 1.50) |
| Level 1 | 1.17 (1.07, 1.28) | 1.11 (1.01, 1.22) | 2.03 (1.77, 2.32) | 11.25 (8.65, 14. 62) | 5.38 (4.41, 6.56) |
| Level 2 or 3 | 1.42 (1.30, 1.54) | 1.33 (1.22, 1.46) | 2.36 (2.07, 2.70) | 4.1 (2.96, 5.69) | 2.69 (2.11, 3.42) |
| Patient characteristics | |||||
| Age | |||||
| <1 year | Referent | Referent | Referent | Referent | Referent |
| 1-4 years | 0.30 (0.27, 0.33) | 0.26 (0.23, 0.29) | 1.12 (0.56, 2.26) | 2.05 (0.26, 16.30) | 1.09 (0.47, 2.51) |
| 5-9 years | 0.32 (0.29, 0.36) | 0.23 (0.21, 0.26) | 1.93 (0.97, 3.85) | 2.88 (0.37, 22.58) | 3.15 (1.41, 7.02) |
| 10-14 years | 0.48 (0.43, 0.54) | 0.34 (0.31, 0.38) | 4.21 (2.15, 8.25) | 6.39 (0.85, 48.16) | 4.60 (2.09, 10.11) |
| 15-18 years | 0.77 (0.69, 0.85) | 0.53 (0.47, 0.59) | 8.41 (4.30, 16.46) | 19.87 (2.66, 148.71) | 8.66 (3.94, 19.04) |
| Male | 1.25 (1.20, 1.31) | 1.20 (1.14, 1.26) | 1.10 (0.99, 1.21) | 1.45 (1.18, 1.80) | 1.34 (1.15, 1.55) |
| Non-White or Hispanic1 | 0.70 (0.66, 0.75) | 0.67 (0.63, 0.72) | 0.56 (0.48, 0.64) | 0.66 (0.51, 0.85) | 0.57 (0.47, 0.69) |
| Insurance status | |||||
| Private | Referent | Referent | Referent | Referent | Referent |
| Medicaid | 0.90 (0.86, 0.95) | 0.89 (0.84, 0.95) | 0.80 (0.71, 0.90) | 0.89 (0.79, 1.15) | 0.94 (0.79, 1.12) |
| Self-pay | 0.78 (0.68, 0.89) | 0.81 (0.70, 0.93) | 0.93 (0.71, 1.21) | 0.57 (0.29, 1.10) | 0.86 (0.56, 1.33) |
| Other | 3.50 (3.18, 3.85) | 3.73 (3.38, 4.12) | 6.38 (5.58, 7.29) | 8.52 (6.70, 10.84) | 7.81 (6.52, 9.37) |
| ISS | |||||
| ≤8 | Referent | Referent | Referent | Referent | Referent |
| 9-15 | 5.88 (5.19, 6.67) | 4.92 (4.31, 5.62) | 6.89 (5.46, 8.70) | 20.17 (14.88, 27.32) | 12.56 (10.04, 15.71) |
| >15 | 10.31 (8.10, 13.10) | 9.52 (7.51, 12.07) | 12.90 (8.89, 18.72) | 30.27 (18.95, 48.34) | 21.36 (15.15, 30.10) |
| Diagnosis of abuse2 | 1.30 (1.03, 1.67) | 1.52 (1.18, 1.96) | 1.94 (0.84, 4.44) | 3.06 (0.72, 13.08) | 2.14 (0.98, 4.71) |
Non-White defined as Black, non-Hispanic, or Other compared to White as the referent group
ICD9-CM diagnosis codes: 995.5-995.59, 995.80-995.85
Figure 6. online- Proportions of body region-specific CTs by trauma center designation.

Discussion
We demonstrate wide variation in CT utilization for pediatric injury-related visits across various types of EDs within a health network. Case mix, as measured by ISS and disposition, did not account for the variability in CT use, which raises the possibility that non-clinical factors influence the decision to obtain imaging in these patients. Understanding factors associated with CT utilization in injured children could be important to both limit exposure to unnecessary radiation as well as contain costs in this setting.
We found that non-pediatric trauma centers and non-academic EDs had higher odds of using CT during injury-related visits. We hypothesize that trauma centers may not distinguish between pediatric and adult trauma patients when evaluating injured patients. This may explain the high use of multi-scanning protocols (ie, chest, abdomen, and other CTs done concomitantly) at several EDs in our study. This finding also may reflect adherence to a protocol, consistent approach to the care of injured patients at trauma centers. Previous national data suggests that trauma centers are more likely to perform head CT imaging for pediatric head trauma(11) and our study further supports these findings. Non-academic EDs, specifically, may not have the personnel or space to engage in a period of observation, which in select patients can be used in lieu of CT imaging. In addition, these EDs compared with academic medical centers, may not engage in the same evidence-based protocols designed to optimize CT usage, and therefore, employ more liberal scanning practices. Among the non-pediatric EDs, there was an inverse relationship between annual pediatric patient volume and c-spine, chest, and abdominal CTs. One possible explanation for this finding is that physicians in EDs with higher pediatric volumes are more comfortable in their clinical assessment and management of injured children and do not rely as heavily on CT imaging.
We found that injured infants have higher odds of receiving any CT imaging compared with other age groups and this finding was largely driven by use of head CT, specifically. Patterns of CT utilization in this age group may reflect difficulty in relying on the physical examination, especially in the youngest of infants. Another possible explanation for the increased odds of imaging in infants may be the concern for non-accidental trauma in this population. Most children <1 year of age are non-ambulatory, and therefore, physicians may be more vigilant in their diagnostic evaluation of an injured infant in the absence of a plausible mechanism. Guidelines for evaluations in suspected abuse often include screening with head, in particular, and abdominal CT imaging.(20-22) It should be noted that although only <0.1% of our population had an ICD9-CM diagnosis code of abuse, this does not reflect the true prevalence of physician suspicion for abuse. For example, a physician may evaluate for findings of abuse, however, if the diagnostic work-up is negative, the visit would not be coded with an ICD9 code to reflect the initial concern. Our finding of lower odds of CT imaging in racial and ethnic minorities is consistent with that found by others and may reflect disparities among parental preferences versus physician biases.(12,18)
In addition to patient- and ED-level characteristics associated with CT utilization across institutions, we found increased CT utilization was consistent across imaging subtypes within individual institutions. Several EDs in our study demonstrated high utilization across several different types of CT, specifically, head, cervical spine, chest, and abdomen, suggesting the practice of “pan scanning.” In adult trauma patients this has been suggested to be an effective and safe method in which to evaluate for injuries.(23) However, this liberal approach to CT scanning in pediatric trauma patients has come into question for several reasons.(24,25) First, injury patterns in pediatric patients are different from those in adults. Specifically, routine chest CT in the setting of high-speed deceleration injuries is advocated in adult patients regardless of chest radiograph results, given the high incidence risk of aortic injuries.(26) However, the prevalence of pediatric aortic injury is exceedingly low (0.1%)(27) and one study found that chest radiograph alone had a negative predictive value of up to 98% for diagnosing these injuries.(28) In addition, pulmonary contusions in children do not yield the high morbidity seen in adult patients, who have higher risks of respiratory failure and acute respiratory distress syndrome.(29) Although chest CT is more accurate in diagnosing rib fractures(30) and pulmonary contusions,(31) these findings don't translate into clinical interventions not otherwise made based on radiographs and clinical monitoring.(31,32) Second, ISS in the adult trauma population is generally much higher than in most pediatric populations, including ours; therefore, increased CT evaluation may be warranted to assess for these more severe injuries.(23,33) Third, as part of the list of “Five things physicians and patients should question” for the Choosing Wisely campaign, the American College of Surgery recommends against the routine performance of whole-body CT in patients with minor or single system trauma.(34) Finally, pediatric trauma patients are subjected to high levels of CT radiation(35), and given the increased susceptibility of children to the effects of diagnostic radiation, it is prudent for physicians to be judicious in their approach.
The second most common CT performed in our study was that of the cervical spine. This is particularly noteworthy, as the incidence of cervical spine injury is very low in pediatric patients. In our study, there was a 0.3% incidence of any spinal fracture or spinal cord injury, meaning an even lower incidence of injuries involving the cervical region, specifically, which has been previously described.(36) Decision rules are designed to minimize unnecessary use of imaging, and there are several related to pediatric cervical spine injuries.(37) In addition, plain radiographs are highly sensitive (up to 94%)(38) for diagnosing cervical spine fractures in pediatric patients, and in many cases, may obviate the need for more advanced imaging.(39) Moreover, the pediatric thyroid gland is among the most radiosensitive organs, and a cervical spine CT exposes the thyroid to 90-200 times more radiation than a plain radiograph.(40) Therefore, use of cervical spine CT imaging in children should be done with caution.(41) We found that the pediatric trauma center was at much lower odds of performing c-spine imaging than non-trauma centers and trauma centers had up to double the odds of using this imaging modality for pediatric patients, even when adjusting for relevant confounders. Cervical CT utilization patterns outside the pediatric trauma center setting may reflect protocols derived from adult-based decision rules(42,43) and guidelines(44) that may not be appropriate in the pediatric setting. However, because the majority of children are cared for in general emergency departments, further attention to pediatric-specific radiation-sparing protocols is warranted.
Our study has certain limitations. First, our data were derived from administrative billing data and therefore, we were unable to assess specific clinical factors, such as the Glasgow Coma Score, which is commonly used as a marker of injury severity. However, we used ISS and disposition as markers of injury severity, with the assumption that those who were discharged were not significantly injured. Second, we report visits with ICD9-CM injury codes and whether a CT was performed, however, a CT may have been ordered for a non-injury related issue despite having an injury-related diagnosis as well. Third, in the case of transferred patients, we included imaging utilization from the transferring facility only. It is possible that imaging was withheld at the initial ED with the expectation that it would be most appropriately performed at the referral ED. However, because only a small percentage of visits in this study resulted in transfer (1.1%), including visits to accepting facilities would be unlikely to alter the results substantively. Fourth, there may be unmeasured confounders related to the decision to obtain a CT. Our study did not attempt to assess the appropriateness of CT use at each visit but rather explore the variation across EDs. Finally, this study was performed within a single, regional health system and the results may not generalize to all EDs. However, our study includes 14 different EDs, which serve a large catchment area.
We demonstrate wide individual ED variation in CT imaging for injured pediatric patients not attributable to injury severity. The speed, accuracy, and noninvasiveness of CT scanning make it an attractive modality in pediatric trauma. However, several lines of evidence suggest that practice patterns regarding evaluation of adults by CT are not appropriate in the pediatric setting. Understanding system-level as well as individual physician factors that lead to wide practice variation in CT utilization in pediatric patients could lead to targeted initiatives to optimize utilization.
Acknowledgments
Supported by the National Institutes of Health (UL1TR000005). J.M. received support from the Agency for Healthcare Research and Quality for a conference on diagnostic imaging (R13HS023498).
Abbreviations
- CT
Computed tomography
- ED
emergency department
- ICD9-CM
International Classification of Diseases, 9th revision, Clinical Modification
- ISS
injury severity score
- OR
odds ratio
- CI
confidence interval
Footnotes
The authors declare no conflicts of interest.
Publisher's Disclaimer: This is a PDF file of an unedited manuscript that has been accepted for publication. As a service to our customers we are providing this early version of the manuscript. The manuscript will undergo copyediting, typesetting, and review of the resulting proof before it is published in its final citable form. Please note that during the production process errors may be discovered which could affect the content, and all legal disclaimers that apply to the journal pertain.
Contributor Information
Jennifer R. Marin, Departments of Pediatrics and Emergency Medicine, University of Pittsburgh School of Medicine, Pittsburgh, PA.
Li Wang, Clinical and Translational Science Institute, University of Pittsburgh, Pittsburgh, PA.
Daniel G. Winger, Clinical and Translational Science Institute, University of Pittsburgh, Pittsburgh, PA.
Rebekah C. Mannix, Division of Emergency Medicine, Department of Pediatrics, Boston Children's Hospital, Boston, MA.
References
- 1.Borse NN, Gilchrist J, Dellinger AM, Rudd RA, Ballesteros MF, Sleet DA. CDC Childhood Injury Report: Patterns of Unintentional Injuries among 0 -19 Year Olds in the United States, 2000-2006. Atlanta (GA): Centers for Disease Control and Prevention, National Center for Injury Prevention and Control; 2008. Available from: http://www.cdc.gov/safechild/images/CDC-childhoodinjury.pdf. [Google Scholar]
- 2.Roberts JL. CT of abdominal and pelvic trauma. Semin Ultrasound CT MR. 1996 Apr;17(2):142–69. doi: 10.1016/s0887-2171(96)90013-x. [DOI] [PubMed] [Google Scholar]
- 3.Korley FK, Pham JC, Kirsch TD. Use of advanced radiology during visits to US emergency departments for injury-related conditions, 1998-2007. JAMA. 2010 Oct 6;304(13):1465–71. doi: 10.1001/jama.2010.1408. [DOI] [PMC free article] [PubMed] [Google Scholar]
- 4.Arnold M, Moore SW. Paediatric blunt abdominal trauma - are we doing too many computed tomography scans? S Afr J Surg. 2013 Feb;51(1):26–31. doi: 10.7196/sajs.1230. [DOI] [PubMed] [Google Scholar]
- 5.Pearce MS, Salotti JA, Little MP, McHugh K, Lee C, Kim KP, et al. The Lancet. 9840. Vol. 380. Elsevier Ltd; 2012. Aug 4, Radiation exposure from CT scans in childhood and subsequent risk of leukaemia and brain tumours: a retrospective cohort study; pp. 499–505. [DOI] [PMC free article] [PubMed] [Google Scholar]
- 6.Mathews JD, Forsythe AV, Brady Z, Butler MW, Goergen SK, Byrnes GB, et al. Cancer risk in 680 000 people exposed to computed tomography scans in childhood or adolescence: data linkage study of 11 million Australians. BMJ (Clinical research ed) 2013 May 21;346(may21 1):f2360–0. doi: 10.1136/bmj.f2360. [DOI] [PMC free article] [PubMed] [Google Scholar]
- 7.Miglioretti DL, Johnson E, Williams A, Greenlee RT, Weinmann S, Solberg LI, et al. The use of computed tomography in pediatrics and the associated radiation exposure and estimated cancer risk. JAMA Pediatr. 2013 Aug 1;167(8):700–7. doi: 10.1001/jamapediatrics.2013.311. [DOI] [PMC free article] [PubMed] [Google Scholar]
- 8.National Quality Forum. National voluntary consensus standards for imaging efficiency: A consensus report [Internet] [cited 2013 Nov 15]; Available from: http://www.qualityforum.org/Publications/2012/01/National_Voluntary_Consensus_Standards_for_Imaging_Efficiency__A_Consensus_Report.aspx.
- 9.Medicare Imaging Demonstration | Center for Medicare & Medicaid Innovation [Internet] [cited 2013 Oct 15]; Available from: http://innovation.cms.gov/initiatives/Medicare-Imaging/
- 10.Sternberg S. Unnecessary CT scans exposing patients to excessive radiation [Internet] [cited 2013 Oct 15];2007 usatoday.com. Available from: http://usatoday30.usatoday.com/news/health/2007-11-28-dangerous-scans_N.htm.
- 11.Marin JR, Weaver MD, Barnato AE, Yabes JG, Yealy DM, Roberts MS. Variation in Emergency Department Head Computed Tomography Use for Pediatric Head Trauma. In: Stevenson M, editor. Acad Emerg Med. 9. Vol. 21. 2014. Oct 1, pp. 987–95. [DOI] [PubMed] [Google Scholar]
- 12.Mannix R, Nigrovic LE, Schutzman SA, Hennelly K, Bourgeois FT, Meehan WP, et al. Factors associated with the use of cervical spine computed tomography imaging in pediatric trauma patients. Acad Emerg Med. 2011 Sep 1;18(9):905–11. doi: 10.1111/j.1553-2712.2011.01154.x. [DOI] [PMC free article] [PubMed] [Google Scholar]
- 13.Tasian GE, Pulido JE, Keren R, Dick AW, Setodji CM, Hanley JM, et al. Use of and Regional Variation in Initial CT Imaging for Kidney Stones. Pediatrics. 2014 Oct 27;134(5):909–15. doi: 10.1542/peds.2014-1694. [DOI] [PMC free article] [PubMed] [Google Scholar]
- 14.Villaveces A, Mutter R, Owens PL, Barrett ML. Causes of Injuries Treated in the Emergency Department, 2010: Statistical Brief #156. Rockville (MD): Agency for Health Care Policy and Research (US); 2006. [PubMed] [Google Scholar]
- 15.Sears JM, Blanar L, Bowman SM. Injury. Elsevier Ltd; 2013. Jan 19, Predicting work-related disability and medical cost outcomes: A comparison of injury severity scoring methods; pp. 1–7. [DOI] [PubMed] [Google Scholar]
- 16.Clark DE, Osler TM, Hahn DR. ICDPIC: Stata Module to Provide Methods for Translating International Classification of Diseases (Ninth Revision) Diagnosis Codes into Standard Injury Categories and/or Scores. [Accessed Jun 21, 2014]; Available at: http://ideas.repec.org/c/boc/bocode/s457028.html.
- 17.Fleischman RJ, Mann NC, Wang NE, Hsia RY, Rea TD, Liao M, et al. Validating The Use Of ICD9 Codes To Generate Injury Severity Score: The ICDPIC Mapping Procedure. [Abstract] Academic Emergency Medicine. 2012 Dec 6;19:S314. [Google Scholar]
- 18.Natale JE, G JJ, Rogers AJ, Mahajan P. Cranial computed tomography use among children with minor blunt head trauma: association with race/ethnicity. Arch Pediatr Adolesc Med. 2012 Aug 7;166(8):732–7. doi: 10.1001/archpediatrics.2012.307. [DOI] [PubMed] [Google Scholar]
- 19.Kuppermann N, Holmes JF, Dayan PS, Hoyle JD, Atabaki SM, Holubkov R, et al. Identification of children at very low risk of clinically-important brain injuries after head trauma: a prospective cohort study. The Lancet. 2009 Oct 3;374(9696):1160–70. doi: 10.1016/S0140-6736(09)61558-0. [DOI] [PubMed] [Google Scholar]
- 20.Rubin DM, Christian CW, Bilaniuk LT, Zazyczny KA, Durbin DR. Occult head injury in high-risk abused children. Pediatrics. 2003 Jun;111(6 Pt 1):1382–6. doi: 10.1542/peds.111.6.1382. [DOI] [PubMed] [Google Scholar]
- 21.Kellogg ND the Committee on Child Abuse and Neglect. Evaluation of Suspected Child Physical Abuse. Pediatrics. 2007 Jun 1;119(6):1232–41. doi: 10.1542/peds.2007-0883. [DOI] [PubMed] [Google Scholar]
- 22.Wilson PM, Chua M, Care M, Greiner MV, Keeshin B, Bennett B. The Journal of Pediatrics. 6. Vol. 164. Elsevier Ltd; 2014. Jun 1, Utility of Head Computed Tomography in Children with a Single Extremity Fracture; pp. 1274–9. [DOI] [PubMed] [Google Scholar]
- 23.Huber-Wagner S, Lefering R, Qvick LM, Körner M, Kay MV, Pfeifer KJ, et al. The Lancet. 9673. Vol. 373. Elsevier Ltd; 2009. Apr 25, Effect of whole-body CT during trauma resuscitation onsurvival: a retrospective, multicentre study; pp. 1455–61. [DOI] [PubMed] [Google Scholar]
- 24.Hershkovitz Y, Zoarets I, Stepansky A, Kozer E, Shapira Z, Klin B, et al. American Journal of Emergency Medicine. 7. Vol. 32. Elsevier Inc; 2014. Jul 1, Computed tomography is not justified in every pediatric blunt trauma patient with a suspicious mechanism of injury; pp. 697–9. [DOI] [PubMed] [Google Scholar]
- 25.Hsiao KH, Dinh MM, McNamara KP, Bein KJ, Roncal S, Saade C, et al. Whole-body computed tomography in the initial assessment of trauma patients: Is there optimal criteria for patient selection? Emergency Medicine Australasia. 2013 Jan 11;25(2):182–91. doi: 10.1111/1742-6723.12041. [DOI] [PubMed] [Google Scholar]
- 26.Demetriades D, Gomez H, Velmahos GC, Asensio JA, Murray J, Cornwell EE, et al. Routine helical computed tomographic evaluation of the mediastinum in high-risk blunt trauma patients. Archives of Surgery. 1998 Oct;133(10):1084–8. doi: 10.1001/archsurg.133.10.1084. [DOI] [PubMed] [Google Scholar]
- 27.Heckman SR, Trooskin SZ, Burd RS. Risk factors for blunt thoracic aortic injury in children. J Pediatr Surg. 2005 Jan;40(1):98–102. doi: 10.1016/j.jpedsurg.2004.09.004. [DOI] [PubMed] [Google Scholar]
- 28.Mirvis SE, Bidwell JK, Buddemeyer EU, Diaconis JN, Pais SO, Whitley JE, et al. Value of chest radiography in excluding traumatic aortic rupture. Radiology. 1987 May;163(2):487–93. doi: 10.1148/radiology.163.2.3562831. [DOI] [PubMed] [Google Scholar]
- 29.Hamrick MC, Duhn RD, Carney DE, Boswell WC, Ochsner MG. Pulmonary contusion in the pediatric population. Am Surg. 2010 Jul;76(7):721–4. doi: 10.1177/000313481007600727. [DOI] [PubMed] [Google Scholar]
- 30.Hong TS, Reyes JA, Moineddin R, Chiasson DA, Berdon WE, Babyn PS. Value of postmortem thoracic CT over radiography in imaging of pediatric rib fractures. Pediatr Radiol. 2011 Jan 25;41(6):736–48. doi: 10.1007/s00247-010-1953-7. [DOI] [PubMed] [Google Scholar]
- 31.Holscher CM, Faulk LW, Moore EE, Burlew CC, Moore HB, Stewart CL, et al. Journal of Surgical Research. 1. Vol. 184. Elsevier Ltd; 2013. Sep 1, Chest computed tomography imaging for blunt pediatric trauma: not worth the radiation risk; pp. 352–7. [DOI] [PubMed] [Google Scholar]
- 32.Kwon A, Sorrells DL, Jr, Kurkchubasche AG, Cassese JA, Tracy TF, Jr, Luks FI. Isolated computed tomography diagnosis of pulmonary contusion does not correlate with increased morbidity. J Pediatr Surg. 2006 Jan;41(1):78–82. doi: 10.1016/j.jpedsurg.2005.10.009. [DOI] [PubMed] [Google Scholar]
- 33.Tracy ET, Englum BR, Barbas AS, Foley C, Rice HE, Shapiro ML. J Pediatr Surg. 6. Vol. 48. Elsevier Inc; 2013. Jun 1, Pediatric injury patterns by year of age; pp. 1384–8. [DOI] [PMC free article] [PubMed] [Google Scholar]
- 34.American College of Surgeons, Choosing Wisely: Five Things Physicians and Patients Should Question [Internet] [cited 2014 Dec 5]; choosingwisely.org. Available from: http://www.choosingwisely.org/doctor-patient-lists/american-college-of-surgeons/
- 35.Kim PK, Zhu X, Houseknecht E, Nickolaus D, Mahboubi S, Nance ML. Effective Radiation Dose from Radiologic Studies in Pediatric Trauma Patients. World J Surg. 2005 Dec 5;29(12):1557–62. doi: 10.1007/s00268-005-0106-x. [DOI] [PubMed] [Google Scholar]
- 36.Viccellio P, Simon H, Pressman BD, Shah MN, Mower WR, Hoffman JR, et al. A prospective multicenter study of cervical spine injury in children. Pediatrics. 2001 Aug;108(2):E20. doi: 10.1542/peds.108.2.e20. [DOI] [PubMed] [Google Scholar]
- 37.Leonard JC, Kuppermann N, Olsen C, Babcock-Cimpello L, Brown K, Mahadevappa M, et al. Ann Emerg Med. 2. Vol. 58. Elsevier Inc; 2011. Aug 1, Factors Associated With Cervical Spine Injury in Children After Blunt Trauma; pp. 145–55. [DOI] [PubMed] [Google Scholar]
- 38.Garton HJL, Hammer MR. Detection of pediatric cervical spine injury. Neurosurgery. 2008 Mar;62(3):700–8. doi: 10.1227/01.NEU.0000311348.43207.B7. discussion700–8. [DOI] [PubMed] [Google Scholar]
- 39.Hernandez JA, Chupik C, Swischuk LE. Cervical spine trauma in children under 5 years: productivity of CT. Emerg Radiol. 2004 Feb;10(4):176–8. doi: 10.1007/s10140-003-0320-5. [DOI] [PubMed] [Google Scholar]
- 40.Jimenez RR, DeGuzman MA, Shiran S, Karrellas A, Lorenzo RL. CT versus plain radiographs for evaluation of c-spine injury in young children: do benefits outweigh risks? Pediatr Radiol. 2008 Mar 27;38(6):635–44. doi: 10.1007/s00247-007-0728-2. [DOI] [PubMed] [Google Scholar]
- 41.Hannon M, Mannix R, Dorney K, Mooney D, Hennelly K. Ann Emerg Med. American College of Emergency Physicians; 2014. Oct 14, Pediatric Cervical Spine Injury Evaluation After Blunt Trauma: A Clinical Decision Analysis; pp. 1–9. [DOI] [PubMed] [Google Scholar]
- 42.Stiell IG, Wells GA, Vandemheen KL, Clement CM, Lesiuk H, De Maio VJ, et al. The Canadian C-spine rule for radiography in alert and stable trauma patients. JAMA. 2001 Oct 17;286(15):1841–8. doi: 10.1001/jama.286.15.1841. [DOI] [PubMed] [Google Scholar]
- 43.Hoffman JR, Mower WR, Wolfson AB, Todd KH, Zucker MI. Validity of a set of clinical criteria to rule out injury to the cervical spine in patients with blunt trauma. National Emergency X-Radiography Utilization Study Group. NEJM. 2000 Jul 13;343(2):94–9. doi: 10.1056/NEJM200007133430203. [DOI] [PubMed] [Google Scholar]
- 44.American College of Radiology Appropriateness Criteria: Suspected Spine Trauma [Internet] [cited 2015 May 19]; Available from: http://www.acr.org/∼/media/f579c123f999479c88390a3df976be77.pdf.