Abstract
Recent long-term studies showed an unsatisfactory recurrence rate of severe mitral regurgitation 3–5 years after surgical repair, suggesting that excessive tissue stresses and the resulting strain-induced tissue failure are potential etiological factors controlling the success of surgical repair for treating mitral valve (MV) diseases. We hypothesized that restoring normal MV tissue stresses in MV repair techniques would ultimately lead to improved repair durability through the restoration of MV normal homeostatic state. Therefore, we developed a micro- and macro- anatomically accurate MV finite element model by incorporating actual fiber microstructural architecture and a realistic structure-based constitutive model. We investigated MV closing behaviors, with extensive in vitro data used for validating the proposed model. Comparative and parametric studies were conducted to identify essential model fidelity and information for achieving desirable accuracy. More importantly, for the first time, the interrelationship between the local fiber ensemble behavior and the organ-level MV closing behavior was investigated using a computational simulation. These novel results indicated not only the appropriate parameter ranges, but also the importance of the microstructural tuning (i.e., straightening and re-orientation) of the collagen/elastin fiber networks at the macroscopic tissue level for facilitating the proper coaptation and natural functioning of the MV apparatus under physiological loading at the organ level. The proposed computational model would serve as a logical first step toward our long-term modeling goal—facilitating simulation-guided design of optimal surgical repair strategies for treating diseased MVs with significantly enhanced durability.
Keywords: Mapped fiber microstructural architecture, Image-based FE simulation, Simplified structural constitutive model, Affine fiber kinematics, In vitro validations
1 Introduction
The mitral valve (MV) is one of the four heart valves located between the left atrium and left ventricle, and it regulates the flow between these two respective chambers. The MV is considered an “apparatus” (Komeda et al. 1997)with four primary components: the anterior and posterior leaflets (MVAL and MVPL), the papillary muscles (PMs) that project from the left ventricular wall, the chordae tendineae that provide connections between the papillary muscles and the MV leaflets and prevent the leaflets from prolapse during MV functioning, and the annulus that is part of the conceptual transition between the MV leaflets and the left atrium. The opening of the MV allows blood flow from the left atrium to left ventricle in diastole of the cardiac cycle. During systole, the MV closes to prevent blood backflow into the left atrium accompanied by the contraction of the MV annulus, PM shortening, and loading of the MV chordae tendineae. Structurally, MV leaflets consist of the following four-layers (Kunzelman et al. 1993b; Sacks and Yoganathan 2008): the atrialis facing the atrium, the ventricularis on the ventricular side, and the inner spongiosa and fibrosa layers. The fibrosa is the thickest and primary load-bearing layer consisting mainly of a dense network of type-I collagen fibers oriented along the circumferential direction. The ventricularis and atrialis layers are composed of collagen and radially aligned elastin fiber networks, which provides sufficient resistance to large radial strains when the mitral valve is fully closed. The spongiosa layer contains a high concentration of hydrated glycosaminoglycans (GAGs) and proteoglycans (PGs) as the lubricant of shear deformation between the fibrosa and ventricularis layers. Each of these four layers has its distinct microstructure and mechanical properties, resulting in MV highly nonlinear and anisotropic mechanical behaviors.
In clinical practice, MV repair and replacement are two typical options for treating MV diseases, such as mitral regurgitation (MR) presumably caused by MV prolapse (Adams et al. 2010; Gillinov et al. 2008) and ischemic mitral regurgitation (IMR) due to post-infarction ventricular remodeling (Gorman and Gorman 2006). After two decades of emphasis on valve replacement, cardiac surgeons have gradually turned to MV surgical repair (Shuhaiber and Anderson 2007; Vassileva et al. 2011) to treat valvular dysfunctions and disease. Promising MV repair concepts include leaflet augmentation that restores leaflet mobility (Jassar et al. 2012; Kincaid et al. 2004; Robb et al. 2011), saddle-shaped annuloplasty that reinstates normal annular shape (Jensen et al. 2011; Mahmood et al. 2010), leaflet resection for repairing leaflet prolapse (Carpentier 1983; Carpentier et al. 1978), and chordal replacement for ruptured or inadequately functioning native chordae (David et al. 1998; Frater et al. 1990). However, recent long-term studies showed an unsatisfactory recurrence rate of severe MR 3–5years after surgical repair (Braunberger et al. 2001; Flameng et al. 2003, 2008; Gillinov et al. 2008). It has been suggested that excessive tissue stress and the resulting strain-induced tissue failure are possible etiological factors controlling the success of MV surgical repair (David et al. 2005; Schoen and Levy 2005). The resulting surgery-induced excessive tissue stresses will then lead to changes in MV interstitial cell (MVIC) metabolism and protein biosynthesis, which are essential in understanding the mechanobiological responses at the organ, tissue, and cellular levels (Dal-Bianco et al. 2009; Grande-Allen et al. 2005; Rabkin-Aikawa et al. 2004).
Based on these observations, we hypothesized that restoration of MV leaflet tissue stresses in MV repair techniques which most closely approximate the normal range would ultimately lead to improved repair durability. This would occur through the restoration of normal MVIC biosynthetic responses and homeostatic state. We are now entering a level of technical capability wherein computational modeling approaches become realistically applicable to better understanding how heart valve tissues behave in their native way and how the MV functions. The pioneering anatomic sectioning and finite element (FE) simulation work by Kunzelman et al. (1993a, 1998) and Reimink et al. (1995) have clearly demonstrated how computational modeling can provide insightful information about the effect of variations of the MV components on the MV functioning. Einstein et al. (Einstein et al. 2004; Kunzelman et al. 2007) further integrated this developed computational model into a fluid-structure interaction framework to study early acoustics for better understanding of MV diseases. Prot et al. (Prot and Skallerud 2009; Prot et al. 2007) proposed constitutive models of the MV apparatus for both transversely isotropic membrane and layer-specific nonlinear solid elements. More recently, FE simulations have been extensively utilized for in vivo and patient-specific modeling as well as surgical remodeling and planning (Choi et al. 2014; Mansi et al. 2012; Stevanella et al. 2011; Votta et al. 2013; Wang and Sun 2013), by incorporating image-based patient-specific geometry, in vivo dynamic boundaries, and/or physiopathological and surgically intervened conditions into the modeling platform. Computer simulations have also been applied to estimating in vivo stresses of the MVAL tissue for understanding how valvular stress variations affect MV function under healthy and diseased conditions (Krishnamurthy et al. 2008;Lee et al. 2014).
Although these models represent an important step toward developing physiologically realistic MV computational models, few in vitro or in vivo validations have been thoroughly performed. Moreover, organ-level computational modeling only gives us basic information about the deformed geometry and overall pseudo-elastic responses. The ability to reproduce the native valve function is only the first step, and understanding why the MV is designed, in its natural and functional way, is essential to provide insights into the MV apparatus considering normal, pathological, and optimally repaired scenarios. Therefore, a multiscale, biomechanical computational modeling framework could thus provide a means for accomplishing this by connecting cellular transduction to adaptions of tissue structure and further to organ-level mechanical responses. As a feasible first step toward our long-term modeling goals, we aimed, in the present study, at developing an anatomically and microstructurally accurate MV finite element model in conjunction with the direct use of realistic MV leaflet tissue microstructure and realistic structurally driven constitutive model to investigate the effects of the MV leaflet microstructure and mechanical properties on the MV closing behavior. Extensive in vitro experimental data were utilized for thorough validations of the proposed computational model for simulations of the functioning MV apparatus. Comparative and parametric studies were performed to provide insights into what requisite information is needed in the organ-level simulations for achieving desirable modeling accuracy and to clarify why the MV is structured and functions.
2 Methods
We developed a comprehensive framework for modeling the MV (Fig. 1), which consisted of four key components: (1) imaged-based organ-level geometry, (2) incorporation of the fiber morphology, (3) realistic tissue-level mechanical behavior characterized from available biomechanical testing data, and (4) applicable boundary and loading conditions for simulating MV closing mechanism. This computational framework was then implemented, by integrating an anatomically accurate FE model based on high-resolution micro-CT images, structurally driven constitutive model for describing MV leaflet mechanical behaviors, and mapping of the fiber microstructural architecture via affine fiber kinematics, into a standard nonlinear, large-deformation FE analysis procedure. The details of the proposed model were provided in the subsequent sections.
Fig. 1.
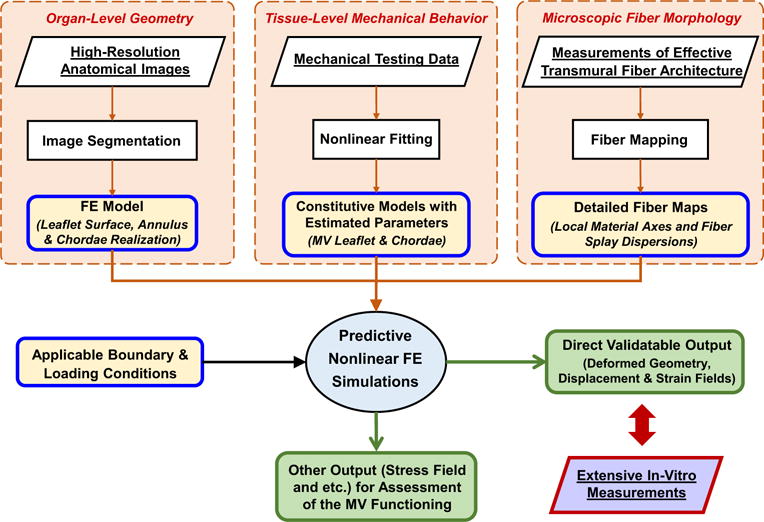
A schematic diagram of the proposed FE computational framework for modeling the MV with the following four key ingredients: (1) anatomically accurate organ-level geometry obtained from high-resolution images for construction of the computationally tractable MV FE model, (2) constitutive models for MV components based on available mechanical testing data, (3) microscopic fiber morphological architecture incorporated with the FE model via the mapping based on affine fiber kinematics, and (4) applicable boundary and loading conditions
2.1 Specimen preparation and acquisition of the in vitro MV geometry
A fresh ovine heart from a 35 kg sheep was acquired from a local USDA approved abattoir. The MV apparatus, including the anterior leaflet, posterior leaflet, chordae tendineae, and papillary muscles (PMs), was excised from the explanted ovine heart, and the surrounding myocardium was carefully trimmed from the above MV components. A modified left heart simulator developed previously (Rabbah et al. 2013) (Fig. 2a), which allows for precise control of the annular and subvalvular MV geometry, was utilized for acquiring the in vitro MV geometry at the fully open state chosen as the reference configuration in the subsequent FE simulations, and at two pressure loading states (with 30 and 70mmHg transvalvular pressures) used for the strain computations as presented in “Appendix 2” and for validations of the proposed computational MV models. First, ebony glass beads (0.2–0.4mm in diameter and 0.01–0.09 mg in weight) were glued to the two leaflets in a regular array (110 and 166 fiducial markers for the MVAL and MVPL, respectively, c.f. Fig. 12). The ovine MV annulus was then sutured to a 32mm Carpentier-Edwards Physio annuloplasty ring (Edwards Lifesciences Corp., CA, USA), which was mounted onto an acrylic plate in between the left atrial and left ventricular chambers. The papillary muscles were attached to mechanical holders in the left ventricle and were positioned to ensure proper physiological MV function by achieving normal hemodynamic conditions (120mmHg peak left ventricular pressure, 4.8 L/min average cardiac output at a heart rate of 70 beats per minute, with 24.7mm papillary muscle separation distance and 27.6mm distance from the acrylic plate) as previously described (Jimenez et al. 2003; Rabbah et al. 2013). The left heart simulator was then placed in a vivaCT40 system (Scanco Medical AG, Switzerland) to acquire micro-computed tomography (micro-CT) images for the above three configurations with 55 keV energy and at 39 μm resolution with isotropic voxels (Bouxsein et al. 2010). Note that a wet sponge was placed in the ventricular chamber to maintain tissue moisture levels, and the annulus and papillary muscles were fixed in the left ventricular chamber during the scans. The first scan was performed at the fully open (left ventricular diastolic) state. A subsequent scan was performed with 30mmHg transvalvular air pressure (early systole). The MV leaflets were fixed under 70mmHg hydrostatic pressure in 4% paraformaldehyde (PFA) for 12h before the last scan.
Fig. 2.
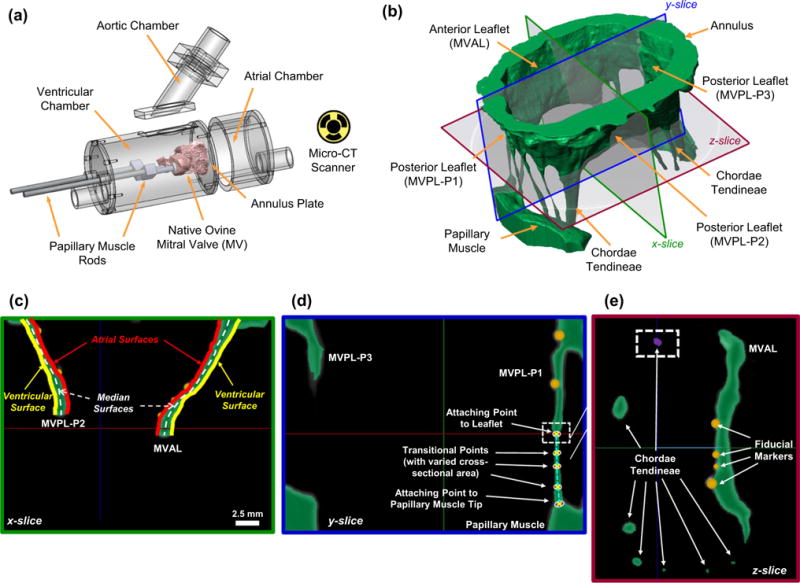
a Modular left heart simulator for acquiring micro-CT images of native ovine MVs (figure modified from Rabbah et al. 2013), b 3D reconstruction of the MV organ-level geometry (green) based on high-resolution micro-CT images with representative slices for illustrations of how the FE model was constructed: c atrial and ventricular MV leaflet surfaces were extracted from the 3D reconstructed MV geometry, whereas the median leaflet surfaces (white-dashed lines) were determined, and spatially varied thicknesses were computed for the developed FE model; d representative landmark points, denoted by white crosses, were determined for idealization of the chordae tendineae; e the cross-sectional area associated with each chordae landmark point as identified in c was measured based on the encompassed pixels (purple), and segmentation of the fiducial markers (in orange) was performed via a separate mask with a brighter gray-scale threshold
Fig. 12.
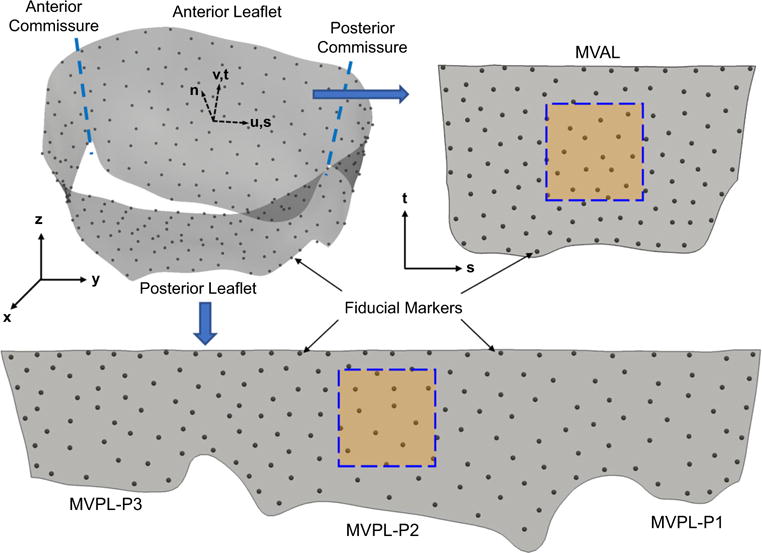
An illustrative diagram showing the unfolding process from the 3D geometry of the MV leaflet surfaces in the global coordinates (x, y, z) to the unfolded MVAL and MVPL on the 2D parametric domain (s, t) for visualization of the displacement errors and in-surface principal strains and computation of cubic spline functions as discussed in “Appendix 2”. The squared boxes denote the central regions of the MVAL and MVPL in which the mean values, and standard deviations of the principal stretches were evaluated
2.2 Image segmentation and development of the MV finite element model
The stack of 3D micro-CT images was segmented using ScanIP (Simpleware Ltd., United Kingdom) to obtain anatomically accurate geometry of the MV apparatus at the stress-free (Fig. 2b), 30 and 70mmHg pressure-loaded states. The atrial and ventricular leaflet surfaces were identified from the segmented MV geometry at each state, and a median MV leaflet surface was reconstructed in Geomagic Studio (Morrisville, NC, USA) based on these two leaflet surfaces (Fig. 2c). Local MV leaflet thicknesses were determined using the distance between the spline-parametrized atrial and ventricular surfaces and were part of the FE input data. Then, the FE mesh at the fully open (reference) configuration associated with this MV leaflet median surface was generated in HyperMesh (Altair Engineering, Inc., MI, USA). For idealization of the MV chordae tendineae via truss elements, 3D locations of the landmark points, such as MV papillary muscle attaching points, chordae branching points, transitional points with distinguishable changes in cross-sectional area and MV leaflet attaching points, were quantified based on the reconstructed micro-CT images (Fig. 2d). Note that the cross-sectional area of each of the above key points was measured directly from the voxel region in the CT images (Fig. 2e) and was used for the section property of each 3D truss element. Finally, 3D positions of fiducial markers at three loading states were obtained via a separate segmentation mask with a distinct gray-scale threshold in ScanIP (Fig. 2c–e) and were used in computation of the displacement errors (“Appendix 1”) and served as the material points in the strain calculation (“Appendix 2”) as well as the mapping of fiber architecture as will be introduced in the next subsection.
2.3 Quantification and mapping of the fiber microscopic architecture
After acquisition of the micro-CT image data at various configurations, the MV anterior and posterior leaflets were separated along the anterior and posterior commissures (c.f. Fig. 12) and prepared for the measurement of the gross (effective) fiber microscopic architecture using the small-angle light scattering (SALS) technique developed previously (Sacks et al. 1997). In brief, each excised, flatten MV leaflet was placed in glycerol for dehydration and scanned in the SALS device. The light scattering patterns were measured at 254-μm increments over the entire MV leaflet specimen, and the measurements were analyzed to quantify the effective fiber orientation distribution function (ODF) Γ(θ) with the local preferred fiber direction μf and the degree of fiber splay σf derived from the orientation index (OI) by assuming a Gaussian distribution. Note that the OI value was defined as the angular width in which 50 % of the total number of fibers occurs, and the fiber splay alignment can be computed via erf (Sacks 2003; Sacks et al. 1997).
To incorporate the measured fiber microstructural architecture with the constructed MV FE model, we developed the following two-stage mapping algorithm (Fig. 3) based on affine fiber kinematics (Lee et al. 2015a, b,c). Briefly, the fundamental property of affine fiber kinematics states that the total number of fibers remains constant within an infinitesimal angular element undergoing given in-plane deformation F2D, and the fiber ODF at the deformed configuration Γ(β) can then be related to the ODF at the reference state Γ(θ) by
| (1) |
where N(θ) denotes the unit vector of the local fiber axis at the undeformed configuration, C2D = (F2D)T(F2D) is the right Cauchy-Green deformation tensor, J2D is the determinant of the in-plane deformation gradient, and λn is the stretch ratio along N. The fiber angle at the current configuration can be computed by
| (2) |
Fig. 3.
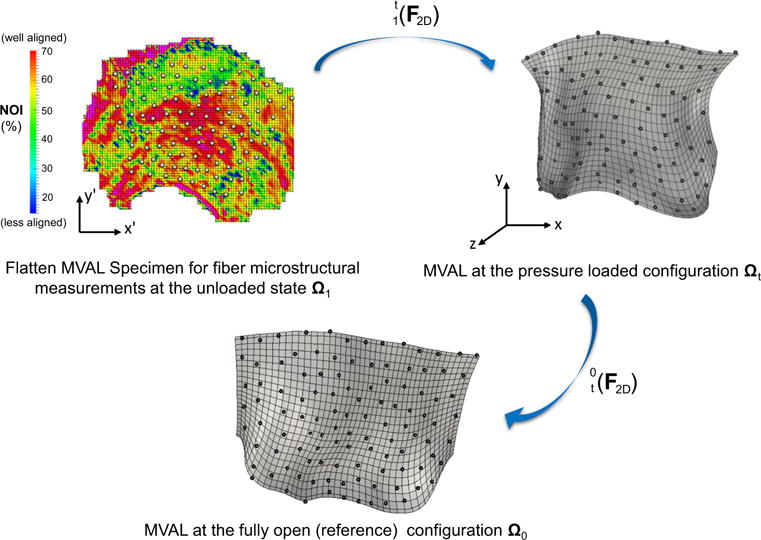
A schematic diagram of the proposed technique for mapping the collagen fiber architecture onto the 3D FE mesh (MVAL as an illustration). Fiber splay microstructural morphology was measured via the SALS technique for the flatten MV leaflet tissues at the unloaded state Ω1, showing both the preferred fiber directions and strengths of fiber splay alignment. The measured fiber architecture was first mapped onto the generated MVAL FE mesh at the pressure-loaded state Ωt via the mapping based on affine fiber kinematics and using the deformation gradient computed from the fiducial marker positions between states Ω1 and Ωt. The corresponding fiber microstructural architecture was then transformed onto the MVAL FE mesh at the reference state Ω0 using to obtain element local material axes and the degree of fiber splay for the simplified structural constitutive model
This rendered the general framework for describing the fiber microstructural architecture with tissue-level deformations. The MV leaflets at the unloaded, full pressure loaded (where the SALS measurements were made), and fully open state be Ω1, Ωt and Ω0, respectively, with the corresponding local material axes , and , respectively. Since the fiber architectural measurements were made after the MV leaflets were fixed under 70mmHg hydrostatic pressure, the local material axes at state Ωt were determined by using the in-plane deformation gradient computed based on the fiducial marker positions between state Ωt and state Ω1 (see more details in “Appendix 2”)
| (3) |
Therefore, we reached the fiber dispersion and local material axes for both leaflets at the pressure-loaded state Ωt. Following the similar procedure, the corresponding fiber ODF and fiber angle at the reference state Ω0, which can be incorporated with a structure-based constitutive model as introduced in the subsequent section and served as part of the FE input, were calculated via the reverse affine mapping in the second step of our mapping algorithm using the in-plane deformation gradient computed from the fiducial marker positions at states Ωt and Ω0.
2.4 Constitutive models for the MV apparatus
We employed an incompressible, transversely isotropic simplified structural model (SSM) in this work to simulate the in vitro passive mechanical behaviors of the MV leaflet tissues by assuming a homogeneous pseudo-hyperelastic, collagenous fiber-reinforced composite material (Fan and Sacks 2014; Fung 1993; Lanir 1983; Sacks 2003). The adopted SSM enables the integration of tissue composition and structure into the function and mechanics of the MV leaflet tissues and allows full in-plane coupling responses within the physiological loading range and the direct use of the mapped fiber microstructural architecture. In brief, the MV leaflet tissues are assumed to consist of two major load-bearing components, a ground matrix material with non-fibrous substances and water and an effective fibrous material model that homogenized the elastin and type-I collagen fibers. The corresponding total strain-energy function (SEF) Ψ is expressed as
| (4) |
where Ψm is the SEF associated with the matrix component using a neo-Hookean material with a neo-Hookean constant μm responsible for the low-strain response and the incompressibility of the planar tissues, Ψens is the SEF associated with the effective fiber networks as the sum of the SEF of each individual fiber Ψf, Γ(θ) is the orientation distribution function (ODF) of the fiber ensembles, Ef(θ) = NT(θ)EN(θ) is the effective fiber strain, N(θ) = [cos(θ), sin(θ), 0]T, E = (C – I)/2 is the Green-Lagrange strain tensor, C = FTF is the right Cauchy-Green deformation tensor, F is the deformation gradient tensor, I is the identity tensor, I1 = trace(C), J = det(F), and p is the Lagrange multiplier to enforce the incompressibility of the planar tissues. Based on the pseudo-hyperelastic formation (Fung 1993), the second Piola–Kirchhoff stress tensor Sleaflet can be derived by
| (5) |
Here, is the consequence of the incompressibility condition, p = − μmC33 is derived from the plane-stress condition , and ⊕ denotes the dyadic tensor product. In this work, we adopted an exponential model with a terminal stiffness for the highly nonlinear fiber stress-strain behavior (Fan and Sacks 2014)
| (6) |
Herein, Sf is the fiber stress, c0 and c1 are material constants, and Eub is the cutoff fiber strain above which a linear fiber tangent modulus is considered. The effective fiber ODF was expressed by a Gaussian distribution function:
| (7) |
where θ ∈ [−π/2, +π/2], and . The Cauchy stress tensor can then be obtained by the push-forward operation σleaflet = FSleafletFT.
For modeling the MV chordae tendineae, we adopted an incompressible, isotropic hyperelastic material with the following stress–strain relationship
| (8) |
where is the uniaxial strain of the chordae tendineae, and C10 and C01 are the material constants.
2.5 Parameter estimation based on an inverse modeling approach
For characterization of the planar mechanical behavior of the ovine MV leaflet tissues, we employed load-controlled biaxial testing protocols previously developed (Grashow et al. 2006). In brief, square central regions (20 mm × 20 mm) of ovine MV anterior and posterior leaflets were dissected, submerged in isotonic saline, and then connected to the biaxial testing equipment with the tissue preferred fiber (circumferential, C) and cross-preferred fiber (radial, R) directions approximated aligned with the device axes. The stress and strain behaviors in the two directions under equi-biaxial loading were recorded and used for the following parameter estimation. Note that the shear strains in this study were negligible.
To estimate the model parameters associated with the simplified structural model, we adopted an inverse modeling approach based on the nonlinear fit of the stress–strain curves between the simulated results and the biaxial testing data. Briefly, the SSM was first implemented in FE software ABAQUS (SIMULIA, Dassault Systèmes, Providence, RI, USA) via the user-defined material subroutine (c.f. details in Fan and Sacks 2014). The equi-biaxial loading protocol was then model, and the simulated stress–strain behaviors in both circumferential and radial directions were compared to the experimental data for characterizing the material parameters by iteratively minimizing the errors of the stress–strain curves between the simulation results and experimental data. Similarly, the uniaxial stress–strain behavior of the chordae tendineae was simulated by three-dimensional truss elements (T3D2). Prescribed force and fixed boundary condition were applied on the opposite ends of the truss element, respectively. The simulated stress–strain curves of both the basal and marginal chordae were compared to available uniaxial testing data (Ritchie et al. 2006), and parameters C10 and C01 were then characterized.
2.6 Finite element simulations of the MV closing behavior
We first assumed that the interaction between blood flow and the MV apparatus is idealized by transvalvular surface pressure loads acting on the MV leaflets, and the effect of the left ventricular contraction on the MV mechanics is mimicked by prescribed boundary motions of the MV annulus and PMs. Alterations of the MV stress and strain fields in response to external loading were of the interest in the current study, and simulations of MV closure were performed in ABAQUS. Nodal displacements and rotations, and elemental strain and stress fields were the primary output from the simulations and were post-processed via a Python script to compute the predicted fiducial marker 3D positions as well as the in-surface maximum and minimum principal stretches compared with the in vitro data at 30 and 70mmHg transvalvular pressures. More details about the computations of the displacement errors evaluated at the fiducial marker positions and the in-surface principal strains of the central leaflet regions (Fig. 12) based on the in vitro measurements were provided in “Appendices 1 and 2”. The following FE modeling specifications were considered:
Explicit dynamics was utilized as a more general computational framework for future extensions, such as in vivo modeling and surgical simulations. Proper mass scaling (dt = 1 × 10⁻⁶) of the inertial effects was employed to simulate the quasi-static behavior associated with the in vitro experimental condition.
Shell (S4) and 3D uniaxial truss (T3D2) elements were used for the MV leaflets and chordae, respectively.
Spatially varied, element-based thicknesses determined from anatomically accurate micro-CT images were supplied as part of input using DISTRIBUTION TABLE (length).
Element-based local material coordinate obtained from the mapped preferred fiber directions was defined using ORIENTATION feature along with DISTRIBUTION TABLE (coor3d).
User-defined subroutine VUSDFLD was adopted to specify element-based fiber splay dispersion σ.
Constitutive models of the MV apparatus were implemented in user-defined subroutine VUMAT
AMPLITUDE feature in conjunction with DSLOAD was used to prescribe the transvalvular pressure loading.
Although clamped boundary conditions were considered in the in vitro experiments, subroutine VDISP was implemented for prescribing displacement boundary conditions of the MV annulus and PM tips.
General self-contact algorithm was adopted for handling the coaptation and interactions of the MV leaflets during MV closing process, and a separate element set consisting of all leaflet elements is defined for treating both leaflets as a contiguous entity and their faces toward the left atrium as potential contacting surfaces. A surface interaction/behavior with a sliding-friction coefficient of 0 (frictionless) and a linear pressure–overclosure coefficient of 0.5.
2.7 Comparative and parametric studies
In addition to thorough validations with extensive in vitro data, we further investigated the effect of the MV leaflet structural properties on the numerically predicted closing behavior of the MV through simulations of the following four perturbations with an increasing level of modeling fidelity: level I—an exponential-type isotropic material (σ = 180°), level II—a transversely isotropic material with uniformly curvilinear fiber directions1 and identical fiber dispersions, level III—a transversely isotropic material with uniformly curvilinear fiber directions and mapped fiber dispersions based on Eq. (1), and level IV—a transversely isotropic material with mapped fiber directions and mapped fiber dispersions based on the proposed mapping algorithms. Comparisons of the numerically predicted displacements and in-plane principal stretches were made among these four cases to examine whether a higher model fidelity yielded more accurate solutions. Moreover, we conducted a series of parametric studies on how the micromechanical ensemble fiber stress–strain behavior (Fig. 4a, b) affects the predicted MV deformations (Fig. 4c), von Mises stress field, and the deformed fiber architecture (represented by NOI values) subject to transvalvular pressure loading up to 100mmHg.
Fig. 4.
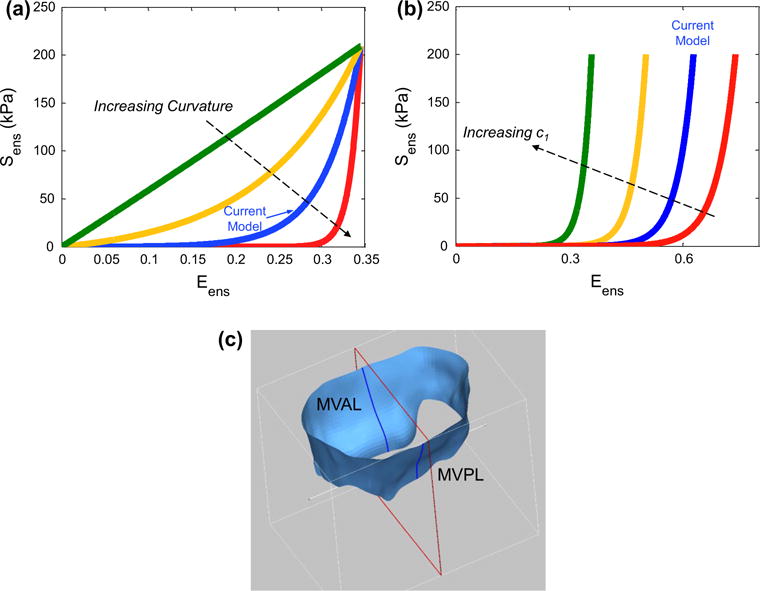
Two conducted parametric studies: a considering the variation in the curvature of the ensemble fiber stress–strain relationship and b considering the variation in parameter c1. c An illustrative diagram of the MV leaflet surfaces and the cut-view used for comparing the deformed profiles in the above parameter studies
3 Results
3.1 FE model information
The final FE model, constructed in this study for the native ovine MV was composed of 6836 nodes (6720 nodes corresponding to the MV leaflets, 192 nodes representing the MV annulus, and 16, 39, 48, and 13 nodes associated with the chordae branching points, chordae transitional points, leaflet attachment points, and papillary muscle tips, respectively, c.f. Fig. 2d), 6528 leaflet elements (2176 and 4352 four-node shell elements for the MVAL and MVPL, respectively), and 297 chordae tendineae 3D truss elements (Fig. 5a). For the anatomical information about the MV chordae tendineae, 4 and 2 intermediary chordae attaching to the leaflet belly regions were identified for the MVAL and MVPL, respectively, and 6 and 2 basal chordae were reconstructed for the MVPL and two commissure regions, respectively. Each of the above intermediary and basal chordae contained various numbers of marginal chordae branches attaching to the free-edge of the MV leaflets. Note that 189 nodes on the MV leaflet shell elements were connected with the above-mentioned leaflet attachment points in a fork fashion (Fig. 5a) to avoid the stress concentration via the single-node attachment of the chordae truss elements to the leaflet elements. Element-based thicknesses determined from the median leaflet surfaces were 1.11 ±0.29 and 0.93 ±0.22 mm for the MVAL and MVPL, respectively (Fig. 5b).
Fig. 5.
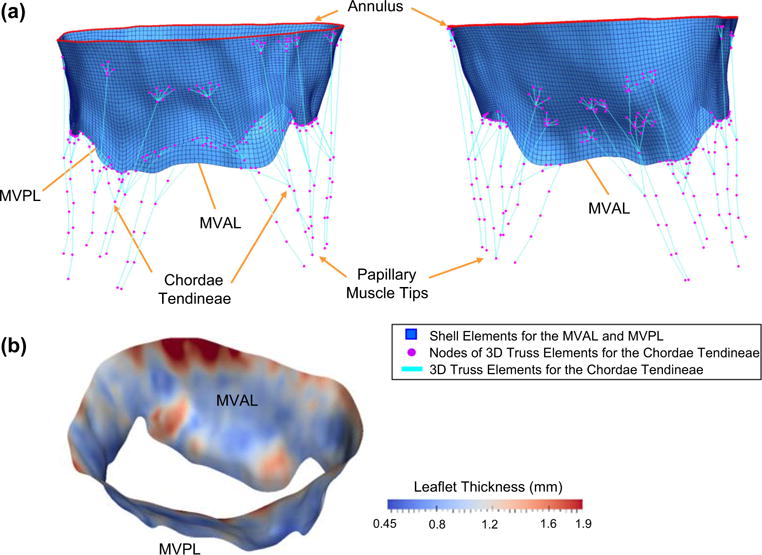
a Different views of the reconstructed FE model for the ovine MV apparatus with anatomically accurate leaflets represented by shell elements (blue), flat annulus that mimics the in vitro experimental clamped condition (red) and idealized chordae tendineae represented by 3D truss elements (cyan) with identified landmark points as FE nodes of the truss elements (magenta); b spatially varied thicknesses for both MVAL and MVPL, determined from the extracted atrial and ventricular leaflet surfaces, as part of input data for FE simulations
3.2 Fiber microstructural mapping
The measured fiber microstructural information, including the preferred fiber direction μf and the OI value, was mapped onto the FE mesh of both leaflets (Fig. 6, top panel), accounting for the transformation and deformation between the excised state Ω1 and the in vitro pressure-loaded state Ωt. Note that the gross fibers were fairly continuous for the MVAL and MVPL, which provide smooth local material axes for contiguous leaflet elements, with higher aligned fibers observed in the central regions of both leaflets which sustain the greater amount of stretching under pressure loading. The fiber architecture associated with the FE mesh at the reference configuration (state Ω0) was determined by the affine-transformation reverse mapping (Fig. 6, bottom panel). Clearly, the gross fibers were less aligned at state Ω0, whereas the fibers at state Ωt were re-oriented due to stretches in both circumferential and radial direction, and became better aligned during the MV closing process.
Fig. 6.
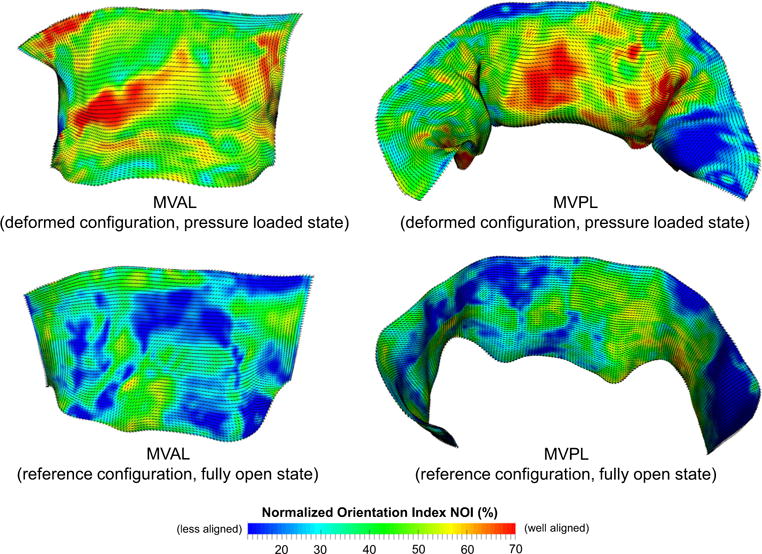
Results of the mapped fiber microstructural architecture for the MV FE mesh at the pressure-loaded state Ωt (top panel) and at the unloaded/reference state Ω0 (bottom panel). Dashed lines denote element-based local material axis direction and the color contour represents the strength of fiber splay. Note that the normalized orientation index is computed by NOI = (90° − OI)/90°
3.3 Estimated material model parameters
The parameters for both MVAL and MVPL were estimated based on the fit to the equi-biaxial loading data (r2 = 0.991 and r2 = 0.986 for the MVAL and MVPL, respectively, Table 1). The stress–strain responses of the MV leaflet tissues, including a long-toe region primarily governed by the load-bearing mechanism of bending and a highly nonlinear region in which fibers gradually became straightened and recruited, were successfully captured by the simplified structural constitutive model (Fig. 7a). Similarly, the parameters for the MV chordae tendineae were quantified based on the fit to the uniaxial data (r2 = 0.975 and r2 = 0.987 for the based/intermediary and marginal chordae, respectively, Fig. 7a; Table 1). Note that both leaflets have very similar stress–strain response in the circumferential direction parallel to the preferred fiber axis, whereas the MVPL seems to be much more compliant in the radial direction (perpendicular to the preferred fiber axis) than the MVAL. Moreover, the MV chordae tendineae were remarkably stiffer than the MV leaflet tissues, as they played a critical role in regulating the proper opening and closing of the MV and particularly in preventing the prolapse of the MV leaflets. It is also noteworthy that the simplified structural constitutive model was capable of describing the widespread mechanical behaviors of the MV leaflet tissues (Fig. 7b), from an exponential-type isotropic material to the one with fully transversely isotropic stress–strain responses, by simply adjusting the fiber splay dispersion in Eq. (7).
Table 1.
Characterized in vitro material parameters associated with the constitutive models of the ovine MV leaflets and chordae tendineae
| Constitutive model of MV leaflets based on Eqs. (5)–(7) | μm (kPa) | c0 (kPa) | c1 | σ (deg.) | Eub |
|---|---|---|---|---|---|
| MV anterior leaflet | 10.11 | 0.0485 | 24.26 | 22.94 | 0.55 |
| MV posterior leaflet | 10.43 | 0.0695 | 19.94 | 19.32 | 0.75 |
|
| |||||
| Constitutive model of MV chordae tendineae based on Eq. (8) | C10 (kPa) | C01 | |||
| Marginal chordae | 0.038 | 15.73 | |||
| Basal and intermediary chordae | 0.249 | 11.65 | |||
Fig. 7.
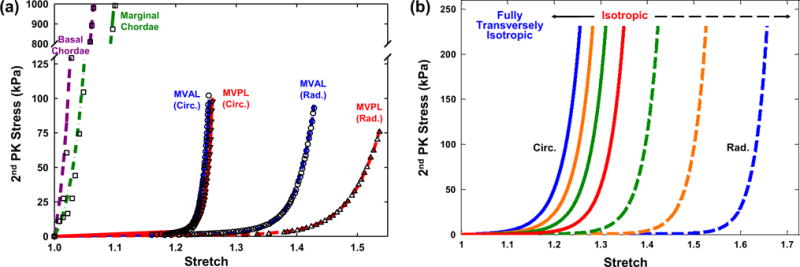
a Comparisons of the fitting results and tissue-level mechanical testing data of the MV components: equi-biaxial loading data and fitted stress–strain curves in both the circumferential and radial directions for the MV anterior leaflet (r2 = 0.992) and posterior leaflet (r2 = 0.986), and uniaxial loading data and fitted stress–strain curves for the basal chordae (r2 = 0.975) and the marginal chordae (r2 = 0.987); b illustration of the fiber splay dispersion effect on the stress–strain curves, showing the capability of the adopted simplified structural constitutive model for describing wide-spectrum mechanical behaviors of the MV leaflet tissues by adjusting parameter σ
3.4 Validations of the MV closing behavior with in vitro experimental data
In the FE simulations2 of the MV closing behavior by the proposed computational framework, the MV leaflets were coapted and partially closed at 30mmHg transvalvular pressure (Fig. 8a) and became completely closed under 70mmHg transvalvular pressure (Fig. 8b) with all chordae tendineae being straightened, demonstrating proper functioning of the MV apparatus. The predicted MV deformed median surfaces at these two pressures levels agreed well with the micro-CT reconstructed MV leaflet geometries. For quantitative assessment of the modeling accuracy, we computed the displacements errors evaluated at 266 fiducial marker locations between the numerical predictions and in vitro experimental measurements, and the results were reported as follows: 0.10±0.05 and 0.19 ±0.06mm for the MVAL and MVPL, respectively, at 30 mmHg transvalvular pressure and 0.13 ± 0.09 and 0.26 ± 0.09mm for the MVAL and MVPL, respectively, at 70mmHg transvalvular pressure (Table 2). Moreover, the in-surface principal strains obtained by the FE simulations using the simplified structural constitutive model and the proposed fiber mapping technique were also in fairly good agreement with the in-vitro strains computed from the fiducial markers between the reference configuration and two different deformed configurations (Table 3; Appendix 3). In addition to the above in vitro validations, we further investigated how the fiber architecture of the MV leaflets changes in response to external pressure loading, in terms of the NOI values in the deformed configurations (Fig. 9). Note that the gross fibers became much better aligned in the central regions of both MVAL and MVPL, which underwent relatively larger deformations (Figs. 13, 14). These results provides us better insight into important micromechanisms, such as fiber straightening and re-alignment, within MV leaflets for maintaining proper functioning of the MV apparatus under physiological loading.
Fig. 8.
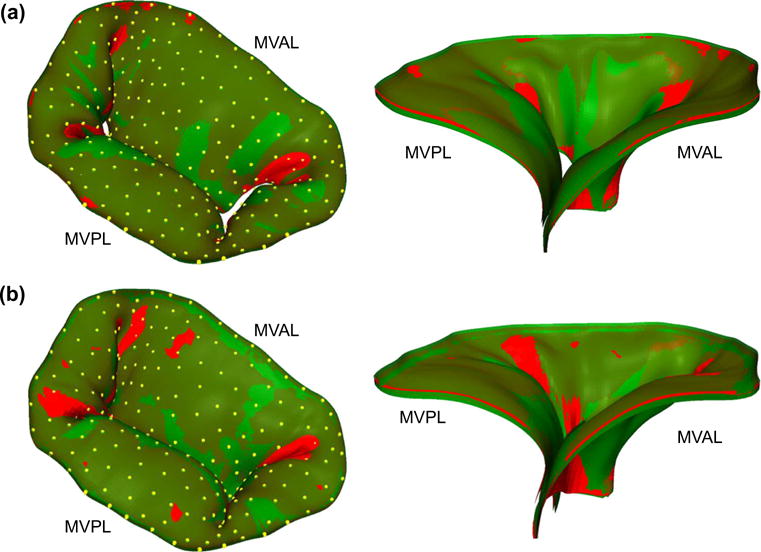
Comparisons of the predicted deformed median surfaces (red) and the micro-CT reconstructed leaflet geometries (green) with fiducial markers (yellow): a MV loaded at 30 mmHg transvalvular pressure and b MV at 70mmHg transvalvular pressure (left 3D deformed surface and geometry; right cross-sectional cut-view of the deformed surface and geometry)
Table 2.
Comparisons of the displacement errors evaluated at the fiducial marker positions of the MV leaflets for FE numerical predictions with various levels of model fidelity
| MVAL
|
MVPL
|
|||
|---|---|---|---|---|
| Mean ± SD (mm) | Max/Min (mm) | Mean ± SD (mm) | Max/Min (mm) | |
| 30 mmHg transvalvular pressure | ||||
| FE predictions—Level I | 0.368 ± 0.174 | 0.774/0.014 | 0.325 ± 0.175 | 0.867/0.076 |
| FE predictions—Level II | 0.208 ± 0.117 | 0.591/0.012 | 0.277 ± 0.103 | 0.564/0.072 |
| FE predictions—Level III | 0.117 ± 0.081 | 0.342/0.012 | 0.231 ± 0.083 | 0.454/0.067 |
| FE predictions—Level IV | 0.096 ± 0.049 | 0.258/0.005 | 0.194 ± 0.061 | 0.405/0.078 |
| 70 mmHg transvalvular pressure | ||||
| FE predictions—Level I | 0.531 ± 0.257 | 0.931/0.019 | 0.516 ± 0.302 | 1.197/0.093 |
| FE predictions—Level II | 0.337 ± 0.179 | 0.708/0.016 | 0.413 ± 0.199 | 0.907/0.082 |
| FE predictions—Level III | 0.183 ± 0.131 | 0.563/0.013 | 0.299 ± 0.112 | 0.609/0.081 |
| FE predictions—Level IV | 0.128 ± 0.085 | 0.425/0.007 | 0.257 ± 0.089 | 0.475/0.061 |
Table 3.
Comparisons of the local in-surface principal strains in the central regions of the MV leaflets between the in vitro measurements and FE numerical predictions with various levels of model fidelity
| λR
|
λC
|
|||
|---|---|---|---|---|
| MVAL | MVPL | MVAL | MVPL | |
| 30 mmHg transvalvular pressure | ||||
| FE predictions—Level I | 1.393 ± 0.054 | 1.487 ± 0.048 | 1.068 ± 0.023 | 1.048 ± 0.023 |
| FE predictions—Level II | 1.365 ± 0.039 | 1.448 ± 0.049 | 1.061 ± 0.023 | 1.043 ± 0.022 |
| FE predictions—Level III | 1.357 ± 0.041 | 1.437 ± 0.044 | 1.057 ± 0.021 | 1.038 ± 0.023 |
| FE predictions—Level IV | 1.341 ± 0.035 | 1.414 ± 0.039 | 1.049 ± 0.020 | 1.034 ± 0.021 |
| In vitro measurements | 1.336 ± 0.031 | 1.421 ± 0.035 | 1.048 ± 0.019 | 1.031 ± 0.016 |
| 70 mmHg transvalvular pressure | ||||
| FE predictions—Level I | 1.452 ± 0.059 | 1.556 ± 0.049 | 1.149 ± 0.038 | 1.126 ± 0.037 |
| FE predictions—Level II | 1.431 ± 0.037 | 1.532 ± 0.053 | 1.139 ± 0.039 | 1.118 ± 0.036 |
| FE predictions—Level III | 1.416 ± 0.044 | 1.508 ± 0.052 | 1.137 ± 0.037 | 1.115 ± 0.036 |
| FE predictions—Level IV | 1.393 ± 0.034 | 1.477 ± 0.047 | 1.124 ± 0.035 | 1.109 ± 0.032 |
| In vitro measurements | 1.386 ± 0.034 | 1.483 ± 0.037 | 1.116 ± 0.035 | 1.108 ± 0.021 |
Fig. 9.
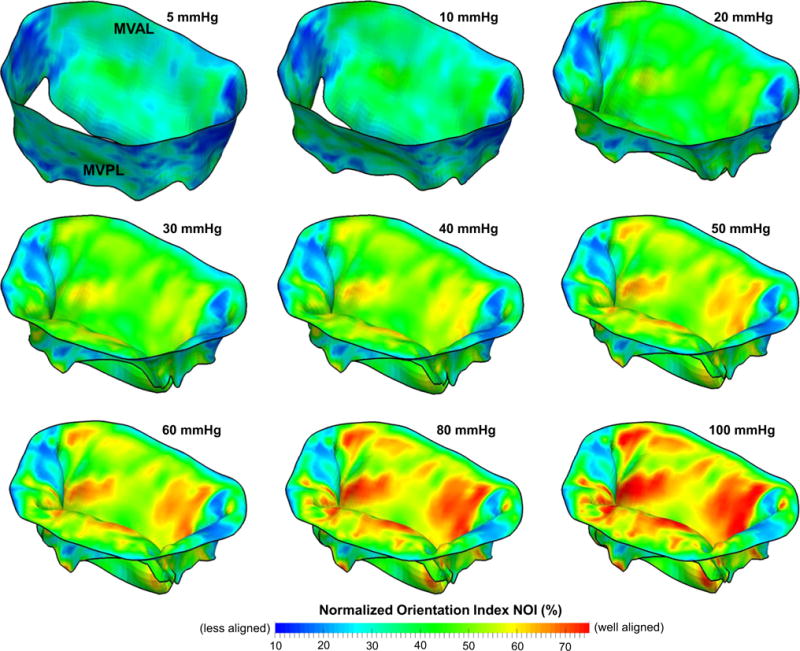
Predicted NOI values of the MV leaflets at various transvalvular pressure levels
Fig. 13.
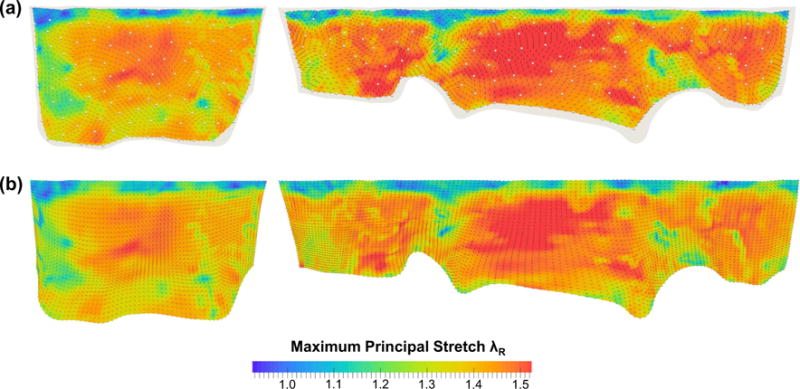
Comparisons of the maximum principal stretches λR and directions at 70mmHg transvalvular pressure: a in vitro measurements and b FE predictions. (Left MVAL; right MVPL)
Fig. 14.
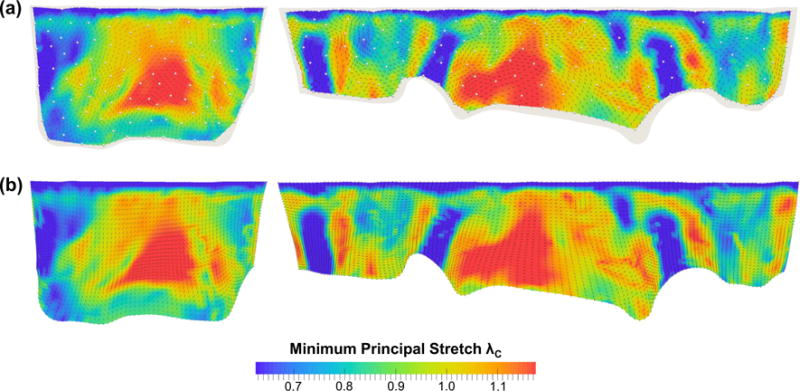
Comparisons of the minimum principal stretches λC and directions at 70mmHg transvalvular pressure: a in vitro measurements and b FE predictions. (Left MVAL; right MVPL)
3.5 Sensitivity analysis of the model fidelity: MV leaflet microstructural information
We evaluated the effect of leaflet microstructural information on the predicted MV closure behavior by considering four perturbed models with increasing levels of model fidelity (Tables 2, 3, “Appendix 3”). First, the exponential-type isotropic material model (level I) was able to capture the highly nonlinear leaflet stress–strain response and yielded a reasonable deformed geometry with displacement errors of 0.53 ±0.26 and 0.52 ± 0.31mm for the MVAL and MVPL, respectively, at 70mmHg transvalvular pressure. However, much larger errors (0.93 and 1.19mm for the MVAL and MVPL, respectively) were found particularly in the coaptation region of the MV due to the model’s inadequacy in describing the distinct anisotropic response. Second, switching from the above material to a transversely isotropic material with uniformly curvilinear fiber directions (level II) reduced the displacement errors at 70mmHg transvalvular pressure by ~36 and ~15% for the MVAL and MVPL, respectively; noticeably less accurate prediction of the leaflet coaptation was still found in this study case. Third, by assigning fiber splay dispersion parameter σ based on the fiber mapping results (level III), the prediction errors were significantly decreased by ~44 and ~28% for the MVAL and MVPL, respectively, compared to level II study case. Finally, additional improvement of the accuracy was achieved by using both the mapped fiber directions as element-based local material axes and fiber splay dispersions in level IV study case. Comparisons of the principal stretches were also made between the four study cases and the in vitro experimental data (Fig. 10a, b; Table 3), and, as expected, more accurate predictions were observed with an increasing level of model fidelity.
Fig. 10.
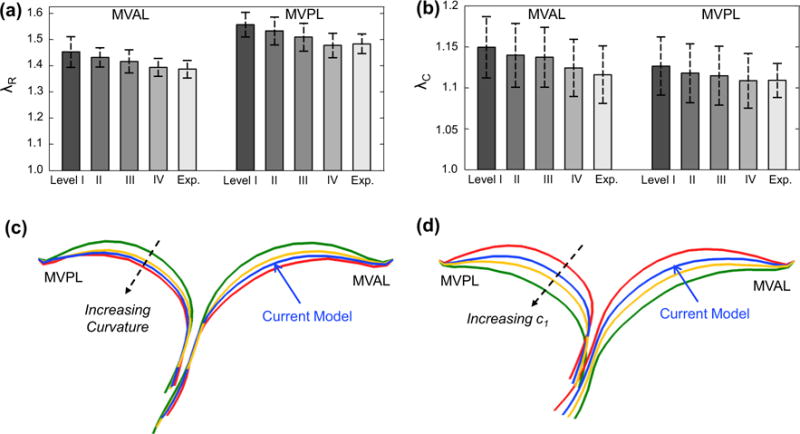
Comparison of the principal stretches of the MV leaflets at 70mmHg transvalvular pressure between the in vitro measurements and the FE predictions with various levels of model fidelity: a radial stretch and b circumferential stretch. Cross-sectional cut-views showing the comparisons of the predicted deformed leaflet surfaces at 100 mmHg transvalvular pressure in the two parameter studies: c considering the variation in the curvature of the ensemble fiber stress–strain relationship, and d considering the variation in parameter c1
3.6 Effects of local ensemble fiber mechanical behavior on the MV closure
We found that increasing curvature of the microscopic fiber stress–strain relationship led to earlier contact interaction and coaptation of both anterior and posterior leaflets at lower transvalvular pressure loading which corresponds to the low stress–strain region primarily governed by material parameter μm, and less leaflet deformation toward the atrial chamber at higher pressure loading which is predominantly influenced by the progressive engagement of the straightening of collagen and elastin fiber networks (Fig. 10c). This finding underscores the importance of adopting a microstructurally informed constitutive model, which is able to capture both the long-toe region and the rapid growth region in material nonlinearity of the MV leaflet tissue’s overall stress–strain behavior, for simulating physiological deformed profiles of the functioning MV. The predicted von Mises stress field and the NOI values at 100 mmHg transvalvular pressured were compared among these models (Figs. 11, 12), and the results showed that a linear ensemble fiber stress–strain model (red in Fig. 4a) yielded lower tissue stresses and better aligned fibers typically in the central regions of both leaflets compared to the current model (blue in Fig. 4a) and a fiber stress–strain model with much larger curvature (greenin Fig. 4a),suggesting an important balancing between microscopic straightening and re-alignment of collagen fiber network and the overall tissue-level stresses for maintaining proper functioning of the MV apparatus. Moreover, the change in parameter c1 had a pronounced effect on the predicted MV deformation (Fig. 10d), which highlights the essential role that the microscopic fiber mechanical properties plays in the MV closing behavior as well as in preserving the realistic deformed geometry of the MV leaflets.
Fig. 11.
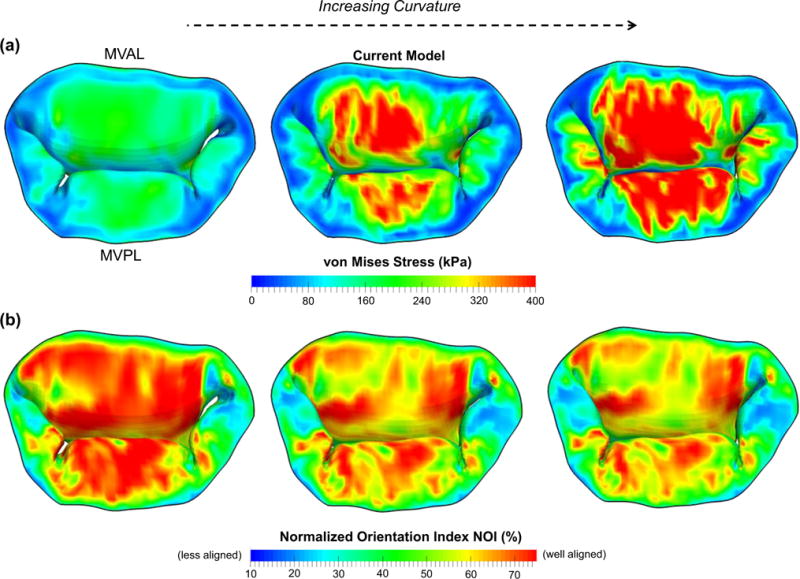
Comparison of the a predicted von Mises stress and b predicted normalized orientation index (NOI) of the MV leaflets considering different curvatures of the ensemble fiber stress–strain relationship at 100mmHg transvalvular pressure
4 Discussion
4.1 Overall findings and implications
In this study, we developed a FE computational model for analyses of the MV closure, which comprised of an anatomically accurate organ-level geometry reconstructed from high-resolution micro-CT images, the incorporation of the measured microscopic fiber morphology, and a realistic structure-based constitutive model for direct employment of the fiber orientation and fiber splay dispersion. The proposed computational model addressed some of the challenges in the state-of-the-art MV modeling field (Choi et al. 2014; Mansi et al. 2012; Stevanella et al. 2011; Votta et al. 2013; Wang and Sun 2013) with our substantial improvements, such as the capability of reconstructing all the main components of the MV apparatus, a more detailed and precise description of the MV leaflet thicknesses, a better idealization of the chordae tendineae structures with realistic key points and cross section areas identified and the detailed mapping of actual fiber microstructure. One of the main contributions in the present work was the acquisition of extensive in vitro experimental data for thorough and rigorous validations of the accuracy of our models, and, in the meantime, the sample integrity was carefully maintained throughout the entire model development process, including micro-CT imaging, measurements of fiber microstructural architecture, and mechanical testing for the same ovine mitral valve specimen. In addition, we demonstrated in the sensitivity study that a computational model with the highest model fidelity yielded more accurate predictions in the displacement field (Fig. 15) as well as in the strain field (Fig. 10a, b) during systolic closure. These results underscored the necessary information to be included in the computational model for achieving desirable accuracy and provide guidance in clinical practice by compromising between model simplification (efficiency) and simulation accuracy.
Fig. 15.
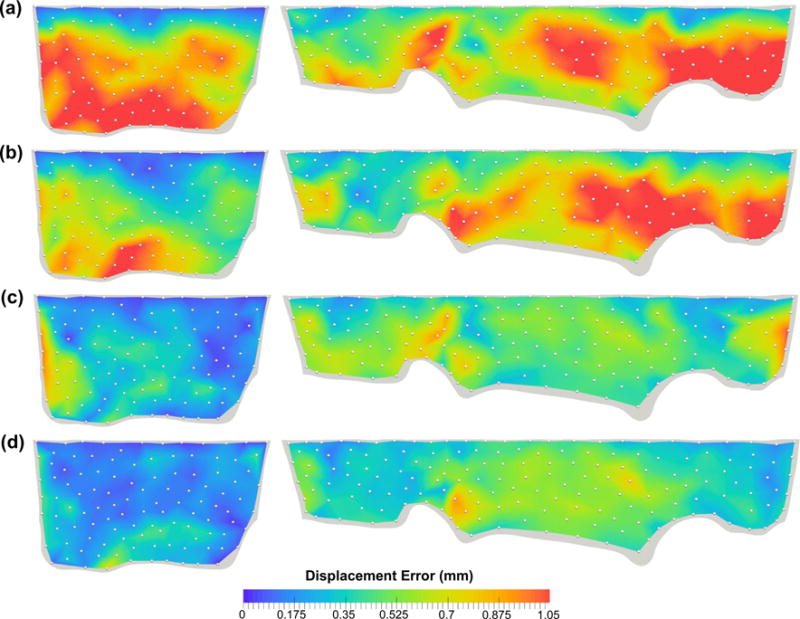
Comparison of the FE-predicted displacement errors at 70mmHg transvalvular pressure with an increasing level of model fidelity: a level I—isotropic material, b level II—transversely isotropic material with uniformly curvilinear fiber directions and identical fiber dispersions, c level III—transversely isotropic material with uniformly curvilinear fiber directions and mapped fiber dispersions, and d level IV—transversely isotropic material with mapped fiber directions (via the proposed mapping technique) and mapped fiber dispersions
More importantly, for the first time, we investigated the interrelationship between the local fiber ensemble mechanical behavior (Fig. 4a, b) and the MV closing behavior (Fig. 10c, d) via computer simulations. These novel results indicated not only the appropriate parameter ranges but also the importance of the microstructural tuning (like straightening and re-orientation) of the collagen/elastin fiber networks at the microscopic tissue level for facilitating the proper coaptation and natural functioning of the MV at the organ level (Fig. 11a, b). Understanding the important underlying mechanisms of the normal MV allows us to reiterate and design the surgical repair procedures, and, in the meantime, maintain the above physiological loading scenario. Furthermore, the proposed computational framework with reasonable future extensions, as will be discussed in the subsequent section, will serve as the basis for utilizing simulations (1) to better understand the MV biomechanics and physiological functionality, including how the MV response to disease- or repair-induced stress alteration particularly associated with the hypo- and hyper-physiological states, (2) to gain better insight into the remodeling of the MV due to disease progression and surgical intervention, and (3) to ultimately provide guideline for improving treatment strategies and surgery planning. Any such modeling effort would essentially depend on currently unavailable quantitative data for determination of the local stresses at the cellular, tissue, and organ levels within complex functioning physiological systems.
4.2 Comparisons with relevant research
The focus of the current study was on the development of a high-fidelity model for investigating the effects of MV leaflet microstructure and mechanical properties on the predicted MV closing behaviors as well as the extensive in vitro validations. Direct comparisons to the relevant research in literature may not be possible due to different species for the MV apparatus considered, various complexities of MV geometry reconstructed for the reference configuration, distinct constitutive models employed, and disparate boundary and loading conditions. Therefore, we made the following qualitative and quantitative assessments of our computational model with the existing models in the field. First, the MV leaflet FE model in the undeformed configuration were reconstructed from much simplified leaflet geometry in the earlier development stage (Einstein et al. 2004; Prot et al. 2007) to anatomically more accurate ones (Mansi et al. 2012; Stevanella et al. 2011; Wang and Sun 2013), such as the proposed model, as higher-resolution medical imaging and powerful segmentation techniques became available. Second, the MV FE models with assumed chordae tendineae (Kunzelman et al. 2007; Stevanella et al. 2009) were commonly adopted for simplicity and due to limited chordae structures, whereas more realistic and detailed chordae structures were employed in the present study. Moreover, unlike the fiber microstructural information gathered, mapped, and utilized from the same specimen in the current modeling work, the MV leaflet fiber orientations were assigned either based on previous observations (Mansi et al. 2012; Prot et al. 2009; Skallerud et al. 2011) or from the measurements taken from separate studies (Einstein et al. 2005). Finally, the quantitative comparison of the principal stretches was made among the predicted in-surface strain field in the leaflet center regions via the proposed model (MVAL: λC = 1.12 ± 0.04,λR = 1.39 ± 0.03 and MVPL: λC = 1.11 ±0.03, λR= 1.48 ±0.05), the previous in vitro measurements of the porcine MVs (MVAL: λC = 1.11 ± 0.04,λR= 1.32 ±0.08 and MVPL: λC = 1.03 ±0.1,λR= 1.23 ±0.14) (He et al. 2005; Sacks et al. 2002), and other numerical predictions (MVAL: λC = 1.09, λR= 1.46 and MVPL: λC = 1.10, λR= 1.43) (Stevanella et al. 2009).
4.3 Limitations of the current study and perspectives
The adopted simplified structural constitutive model allowed direct employment of the measured preferred fiber directions and fiber splay dispersions and provided more valuable insights into soft tissue function by integrating microscopic fiber structure, kinematics, and structural adaption with the tissue-level stress-strain responses compared to conventional invariant-based constitutive models (May-Newman and Yin 1998; Prot et al. 2007) which were based on phenomenological observations and lacked appropriate physical interpretation. More realistic structure-based constitutive models for the MV tissues, which accounts for complex multilayer microstructure and composition as well as separated SEFs to model the mechanical responses of elastin and collagen fibers, are currently developed in our laboratory and will be presented in the forthcoming publications.
Parameters of the structural constitutive model are characterized based on the in vitro passive mechanical data, for modeling the in vivo mechanical behaviors of the MV apparatus by taking account of the previously observed pre-strain effects (Amini et al. 2012) to avoid consideration of the active contraction effect. This additional pre-strain effect can be considered by adding the corresponding pre-stretches into the overall deformation gradient tensor as well as modifying the fiber orientation function and fiber recruitment considering the deformation and transformation from the in vitro reference (excised, stress-free) state to the in vivo reference (minimum left ventricular pressure-loaded) state (see Figs.6 and 8 in Amini et al. 2012 for more details). The validness of this novel structurally-driven constitutive model will be justified by extensive in vitro and in vivo data integrated with our previously developed inverse modeling technique (Lee et al. 2014).
In vivo and patient-specific modeling of the functioning MV as an intermediate step toward our long-term modeling goals, several key aspects as future extensions of the proposed computational framework need to be addressed, including (1) integration of the dynamic motions of the MV annulus and PMs due to left ventricular contraction, (2) incorporation of the pre-strain effects between the in vitro excised and the in vivo reference states, the construction of population-based geometry of the MV leaflets and representative chordae tendineae primitives, and (3) development of morphable geometry and attributes. Note that the MV leaflet computational model can be reconstructed directly from real-time 3D echocardiographic patient-specific image data using previously developed automatic segmentation technique (Pouch et al. 2014), and dynamic annulus and PM motions can be quantified by 3D echocardiography and sonomicrometry techniques developed previously (Eckert et al. 2009; Gorman et al. 1996), and the measured in vivo data can be integrated with the currently ready user-defined subroutine VDISP as prescribed displacement boundary conditions in the nonlinear FE analyses. Therole of the MVICs in MV leaflet function can also be added in a similar manner as this information becomes available.
Furthermore, utilizing available, extensive high-resolution image datasets, a population-averaged MV leaflet template geometry is currently underway, which captures essential features of the MV leaflets. Moreover, a series of chordae 3D geometric primitives, such as main intermediary chordae and chordae branches, will be constructed for more realistic idealization of the chordae representation for the computational modeling. General-purpose computational geometry tools will be subsequently devised for versatile manipulation and modification of the above leaflet template according to certain patient’s image data, for flexible integration of the developed chordae primitives with the modified leaflet geometry, and for accurate morphing of important attributes, such as the fiber ODF, fiber recruitment, preferred fiber directions, and other model parameters.
Although the fiber mapping algorithm represented a reasonable step for integrating the measured fiber microstructural architecture with the structure-based constitutive model for FE simulations of the MV, a non-invasive mapping technique for incorporation of the fiber architecture, which does not require a fiducial marker array, will be more attractive in clinical practice. Therefore, we are currently acquiring extensive MV leaflet fiber microstructural data from a large number of specimens from healthy and diseased human subject groups, creating population-averaged fiber microstructural information, and utilizing a spline-based parametric mapping approach developed recently (Aggarwal et al. 2013, 2014) for mapping essential and necessary attributes. This future extension will allow for identifying population-averaged changes of microstructure due to MV diseases and will make our computational models more tractable for patient-specific MV modeling in clinical applications.
Finally, to better understand MV mechanical behavior and remodeling, it would be necessary to gain fundamental insight into the connection of altered MV leaflet geometry and tissue stresses with the local changes of MVIC phenotypic state and biosynthesis in response to mechanical stress overload, MV pathologies and surgical intervention, and on how these microscopic changes lead to the subsequent adaption of tissue adaption to restore overall tissue homeostasis. Hence, we are currently investigating the interrelationship between the MVIC microenvironment and tissue-level deformations via an integrated computational–experimental methodology in our parallel study (Lee et al. 2015b) and will ultimately incorporate MVIC mechanobiology within an organ-level simulation framework for multiscale modeling and remodeling of normal, diseased, and surgically modified MVs.
4.4 Conclusions
In summary, we have developed a computational framework for modeling of the functioning MV and successfully implemented a computational model into the nonlinear FE simulation procedure, which included microscale and meso scale anatomically accurate geometry of the MV apparatus, mapped fiber microstructural architecture, and a structure-based constitutive model directly integrated with tissue microstructure. This computational model, to our knowledge, is the first of this kind that has been thoroughly validated with extensive in vitro data for its model accuracy and robustness. Displacement errors evaluated at the fiducial markers between the model predictions and in vitro data were satisfactory: 0.096 ± 0.049 and 0.19 ± 0.061mm at 30mmHg transvalvular pressure and 0.13 ± 0.085 and 0.26 ± 0.089 mm at 70 mmHg transvalvular pressure for the MVAL and MVPL, respectively. Numerically predicted in-surface principal strains also agreed qualitatively and quantitatively well with the in vitro measurements. Moreover, we showed in the comparative study that the proposed model with the highest fidelity yielded the most accurate predictions compared with other model perturbations with varying MV leaflet microstructural information. This study underscored the necessary model fidelity and information to be included in the simulations for achieving desirable accuracy. Furthermore, the parametric studies conducted in this work demonstrated appropriate parameter ranges and micromechanical fiber responses for representing the proper coaptation and natural functioning behaviors of the MV apparatus under physiological loading. Understanding the underlying mechanisms of the normal MV could help in reiterating and designing surgical repair procedures for maintaining the proper physiological loading scenario. Finally, the computational model developed in this work serves as an important first step toward our long-term modeling goals, which are to employ computer simulations for assessing the performance of existing MV repair techniques and for providing insightful guidance in the design of optimal surgical repair strategies for treating diseased MVs with better restored functionality and improved long-term durability.
Acknowledgments
Support from the National Institutes of Health (NIH) Grants R01 HL119297, HL63954, HL103723, and HL73021 is greatly acknowledged. Dr. Chung-Hao Lee was supported in part by the American Heart Association (AHA) Postdoctoral Fellowship (14POST18160013) and a UT Austin ICES Postdoctoral Fellowship. The assistance from Ted Weber and Ronen G. Aniti for image segmentation and development of the MV finite element model is greatly appreciated.
Appendix 1: Computation of displacement errors at fiducial marker positions
Each of the shell elements for the MV median leaflet surfaces at the reference configuration (Fig. 5a) developed in Sect. 2.3 was first extruded toward the left atrial direction with a distance of half the elemental thickness in order to obtain the FE mesh for the atrial leaflet surfaces. Then, each of all the 266 fiducial marker was associated with one shell element whose element region entirely covers this fiducial marker, and the corresponding four shape functions (N1, N2, N3, N4) were computed based on the positions of the four nodes of this identified element as well as the fiducial marker location on the expanded 2D parametric domain (s, t) (Fig. 12). Similar extrusion procedure was performed for the FE meshes under deformations at 30 and 70mmHg transvalvular pressure, respectively, and the FE-predicted position of each fiducial marker was obtained by interpolation using the above four shape functions and the current locations of the four nodes
| (9) |
where is the current position (after extrusion) of node J in the deformed configuration Ωt, and superscript t denotes the state (30 or 70mmHg). Finally, the displacement errors at the fiducial markers were evaluated by comparing the micro-CT segmented locations and the FE predictions as follows
| (10) |
Appendix 2: Kinematics and strain computations in the convective curvilinear coordinates
We modified previously developed approaches (Sacks et al. 1993, 2002; Smith et al. 2000) for computation of the strain field within the fiducial marker array by adopting an in-surface convective curvilinear coordinate system (u, v, n) based on the local tangent plane (Fig. 12). This coordinate system was defined with unit vectors ev parallel to the cylindrically circumferential direction, en being the local surface normal, and ev = en × ev. The 3D position vector of each marker (x, y, z) at different configurations was then translated and rotated into this (u, v, n) coordinate system. In this work, we utilized a point-based meshless surface interpolation to calculate the in-surface strain field within the MV leaflet delimited by the markers. The position vectors of each point at the reference state and the deformed state were given by
| (11) |
where , and are the u, v, n components of the position vector associated with the reference state, and , and are the u, v, n components of the position vector corresponding to the deformed state. In this study, these components were computed by using the spline interpolation
| (12) |
Here, subscript J ∈ {u, v, n}, and are the J-components of the position vectors of marker I corresponding to the reference and deformed states, respectively, and ϕI(s, t; sI, tI) is the C2-continuous cubic spline function of marker I with a compact support d covering NP markers which has the form
| (13) |
where , d was chosen as twice of the average marker distance, and the covering fiducial makers were determined on the expanded 2D parametric domain (s, t) (Fig. 12). Hence, the covariant base vectors on the MV leaflet surfaces were determined by
| (14) |
where subscript α ∈ {u, v}, Gα and gα are the covariant base vectors in the reference and deformed configurations, respectively, and the third covariant base vectors were computed by G3 = (G1 × G2)/║G1 × G2║ and g3 = (g1 × g2)/║g1 × g2║. Then, the contra-variant base vectors were computed by their definition
| (15) |
| (16) |
After carrying out the components of each base vector, the in-plane deformation gradient tensor F2D (used for the mapping algorithm presented in Sect. 2.3), right Cauchy–Green deformation tensor C2D, and Euler–Almansi strain tensor e2D (served as validation data in Sects. 2.6, 2.7) were computed (Flugge 1972; Fung 1993) as the following:
| (17) |
Finally, the corresponding principal stretches (λR, λC) and the principal directions can then be obtained by solving the eigenvalue problem of the above Euler-Almansi strain tensor for the eigenvalues and eigenvectors.
Appendix 3: Summary of validations of the in-surface principal stretches and sensitivity study
The FE-predicted maximum and minimum stretches in the central regions of the MV two leaflets at 70mmHg transvalvular pressure were reported as follows: λR = 1.39± 0.03 and λC = 1.12 ± 0.04 for the MV anterior leaflet, and λR = 1.48 ± 0.05 and λC = 1.11 ± 0.03 for the MV posterior leaflet, whereas the in vitro experimental measurements were λR = 1.39 ± 0.03 and λC = 1.12 ± 0.04 for the MVAL, and λR = 1.48 ± 0.04 and λC = 1.11 ± 0.02 for the MVPL. Furthermore, the principal directions associated with the principal stretches from both numerical predictions and experimental data were very smooth, especially in the central regions of the MVAL and MVPL, and were in good alignment with the radial and circumferential directions, respectively (Figs. 13, 14). For the sensitivity study on the leaflet microstructural information, the FE prediction accuracy with various levels of model fidelity was evaluated based on the displacement errors at the fiducial marker positions at 70 mmHg transvalvular pressure (Fig. 15).
Footnotes
A convective curvilinear cylindrical coordinate was adopted to describe the contiguous MV leaflet entity, and fiber directions were assumed to be all uniformly aligned with the circumferential direction in this coordinate system for the case associated with uniformly curvilinear fiber directions.
FE simulations of MV systolic closure (~0.3 s) were performed on PC with Intel Xeon X5650 processor with one single thread and 32 GB memory, and each job with 300,000 time increments took ~5h for completion.
Conflict of interest None of the authors have a conflict of interests with the present work.
References
- Adams DH, Rosenhek R, Falk V. Degenerative mitral valve regurgitation: best practice revolution. Eur Heart J. 2010;31:1958–1966. doi: 10.1093/eurheartj/ehq222. [DOI] [PMC free article] [PubMed] [Google Scholar]
- Aggarwal A, Aguilar VS, Lee C-H, Ferrari G, Gorman JH, Gorman RC, Sacks MS. Patient-specific modeling of heart valves: from image to simulation. In: Qurselin S, Rueckert D, Smith N, editors. Functional imaging and modeling of the heart. Springer; Berlin: 2013. pp. 141–149. [DOI] [PMC free article] [PubMed] [Google Scholar]
- Aggarwal A, Ferrari G, Joyce E, Daniels MJ, Sainger R, Gorman JH, 3rd, Gorman R, Sacks MS. Architectural trends in the human normal and bicuspid aortic valve leaflet and its relevance to valve disease. Ann Biomed Eng. 2014;42:986–998. doi: 10.1007/s10439-014-0973-0. [DOI] [PMC free article] [PubMed] [Google Scholar]
- Amini R, Eckert CE, Koomalsingh K, McGarvey J, Minakawa M, Gorman JH, Gorman RC, Sacks MS. On the in vivo deformation of the mitral valve anterior leaflet: effects of annular geometry and referential configuration. Ann Biomed Eng. 2012;40:1455–1467. doi: 10.1007/s10439-012-0524-5. [DOI] [PMC free article] [PubMed] [Google Scholar]
- Bouxsein ML, Boyd SK, Christiansen BA, Guldberg RE, Jepsen KJ, Müller R. Guidelines for assessment of bone microstructure in rodents using micro-computed tomography. J Bone Miner Res. 2010;25:1468–1486. doi: 10.1002/jbmr.141. [DOI] [PubMed] [Google Scholar]
- Braunberger E, Deloche A, Berrebi A, Abdallah F, Celestin JA, Meimoun P, Chatellier G, Chauvaud S, Fabiani JN, Carpentier A. Very long-term results (more than 20 years) of valve repair with carpentier’s techniques in nonrheumatic mitral valve insufficiency. Circulation. 2001;104:I8–11. [PubMed] [Google Scholar]
- Carpentier A. Cardiac valve surgery-the “French correction”. J Thorac Cardiovasc Surg. 1983;86:323–337. [PubMed] [Google Scholar]
- Carpentier A, Relland J, Deloche A, Fabiani J-N, D’Allaines C, Blondeau P, Piwnica A, Chauvaud S, Dubost C. Conservative management of the prolapsed mitral valve. Ann Thorac Surg. 1978;26:294–302. doi: 10.1016/s0003-4975(10)62895-0. [DOI] [PubMed] [Google Scholar]
- Choi A, Rim Y, Mun JS, Kim H. A novel finite element-based patient-specific mitral valve repair: virtual ring annuloplasty. Biomed Mater Eng. 2014;24:341–347. doi: 10.3233/BME-130816. [DOI] [PMC free article] [PubMed] [Google Scholar]
- Dal-Bianco JP, Aikawa E, Bischoff J, Guerrero JL, Handschumacher MD, Sullivan S, Johnson B, Titus JS, Iwamoto Y, Wylie-Sears J, Levine RA, Carpentier A. Active adaptation of the tethered mitral valve: insights into a compensatory mechanism for functional mitral regurgitation. Circulation. 2009;120:334–342. doi: 10.1161/CIRCULATIONAHA.108.846782. [DOI] [PMC free article] [PubMed] [Google Scholar]
- David TE, Ivanov J, Armstrong S, Christie D, Rakowski H. A comparison of outcomes of mitral valve repair for degenerative disease with posterior, anterior, and bileaflet prolapse. J Thorac Cardiovasc Surg. 2005;130:1242–1249. doi: 10.1016/j.jtcvs.2005.06.046. [DOI] [PubMed] [Google Scholar]
- David TE, Omran A, Armstrong S, Sun Z, Ivanov J. Long-term results of mitral valve repair for myxomatous disease with and without chordal replacement with expanded polytetrafluoroethylene sutures. J Thorac Cardiovasc Surg. 1998;115:1279–1286. doi: 10.1016/S0022-5223(98)70210-7. [DOI] [PubMed] [Google Scholar]
- Eckert CE, Zubiate B, Vergnat M, Gorman JH, 3rd, Gorman RC, Sacks MS. In vivo dynamic deformation of the mitral valve annulus. Ann Biomed Eng. 2009;37:1757–1771. doi: 10.1007/s10439-009-9749-3. [DOI] [PMC free article] [PubMed] [Google Scholar]
- Einstein DR, Kunzelman KS, Reinhall PG, Cochran RP, Nicosia MA. Haemodynamic determinants of the mitral valve closure sound: a finite element study. Med Biol Eng Comput. 2004;42:832–846. doi: 10.1007/BF02345218. [DOI] [PubMed] [Google Scholar]
- Einstein DR, Kunzelman KS, Reinhall PG, Nicosia MA, Cochran RP. The relationship of normal and abnormal microstructural proliferation to the mitral valve closure sound. J Biomech Eng. 2005;127:134–147. doi: 10.1115/1.1835359. [DOI] [PubMed] [Google Scholar]
- Fan R, Sacks MS. Simulation of planar soft tissues using a structural constitutive model: finite element implementation and validation. J Biomech. 2014;47:2043–2054. doi: 10.1016/j.jbiomech.2014.03.014. [DOI] [PMC free article] [PubMed] [Google Scholar]
- Flameng W, Herijgers P, Bogaerts K. Recurrence of mitral valve regurgitation after mitral valve repair in degenerative valve disease. Circulation. 2003;107:1609–1613. doi: 10.1161/01.CIR.0000058703.26715.9D. [DOI] [PubMed] [Google Scholar]
- Flameng W, Meuris B, Herijgers P, Herregods M-C. Durability of mitral valve repair in Barlow disease versus fibroelastic deficiency. J Thorac Cardiovasc Surg. 2008;135:274–282. doi: 10.1016/j.jtcvs.2007.06.040. [DOI] [PubMed] [Google Scholar]
- Flugge W. Tensor analysis and continuum mechanics. Springer; New York: 1972. [Google Scholar]
- Frater R, Vetter H, Zussa C, Dahm M. Chordal replacement in mitral valve repair. Circulation. 1990;82:IV125–IV130. [PubMed] [Google Scholar]
- Fung YC. Biomechanics: mechanical properties of living tissues. 2nd. Springer; New York: 1993. [Google Scholar]
- Gillinov AM, Blackstone EH, Nowicki ER, Slisatkorn W, Al-Dossari G, Johnston DR, George KM, Houghtaling PL, Griffin B, Sabik JF., III Valve repair versus valve replacement for degenerative mitral valve disease. J Thorac Cardiovas Surg. 2008;135:885–893 e882. doi: 10.1016/j.jtcvs.2007.11.039. [DOI] [PubMed] [Google Scholar]
- Gorman JH, 3rd, Gupta KB, Streicher JT, Gorman RC, Jackson BM, Ratcliffe MB, Bogen DK, Edmunds LH., Jr Dynamic three-dimensional imaging of the mitral valve and left ventricle by rapid sonomicrometry array localization. J Thorac Cardiovasc Surg. 1996;112:712–726. doi: 10.1016/S0022-5223(96)70056-9. [DOI] [PubMed] [Google Scholar]
- Gorman RC, Gorman JH., 3rd Why should we repair ischemic mitral regurgitation? Ann Thorac Surg. 2006;81:785. doi: 10.1016/j.athoracsur.2005.07.028. (author reply 785– 786) [DOI] [PubMed] [Google Scholar]
- Grande-Allen KJ, Borowski AG, Troughton RW, Houghtaling PL, Dipaola NR, Moravec CS, Vesely I, Griffin BP. Apparently normal mitral valves in patients with heart failure demonstrate biochemical and structural derangements: an extracellular matrix and echocardiographic study. J Am Coll Cardiol. 2005;45:54–61. doi: 10.1016/j.jacc.2004.06.079. [DOI] [PubMed] [Google Scholar]
- Grashow JS, Yoganathan AP, Sacks MS. Biaxial stress-stretch behavior of the mitral valve anterior leaflet at physiologic strain rates. Ann Biomed Eng. 2006;34:315–325. doi: 10.1007/s10439-005-9027-y. [DOI] [PubMed] [Google Scholar]
- He Z, Ritchie J, Grashow JS, Sacks MS, Yoganathan AP. In vitro dynamic strain behavior of the mitral valve posterior leaflet. J Biomech Eng. 2005;127:504–511. doi: 10.1115/1.1894385. [DOI] [PubMed] [Google Scholar]
- Jassar AS, Minakawa M, Shuto T, Robb JD, Koomalsingh KJ, Levack MM, Vergnat M, Eperjesi TJ, Jackson BM, Gorman JH., III Posterior leaflet augmentation in ischemic mitral regurgitation increases leaflet coaptation and mobility. Ann Thorac Surg. 2012;94:1438–1445. doi: 10.1016/j.athoracsur.2012.05.025. [DOI] [PMC free article] [PubMed] [Google Scholar]
- Jensen MO, Jensen H, Levine RA, Yoganathan AP, Andersen NT, Nygaard H, Hasenkam JM, Nielsen SL. Saddle-shaped mitral valve annuloplasty rings improve leaflet coaptation geometry. J Thorac Cardiovasc Surg. 2011;142:697–703. doi: 10.1016/j.jtcvs.2011.01.022. [DOI] [PMC free article] [PubMed] [Google Scholar]
- Jimenez JH, Soerensen DD, He Z, He S, Yoganathan AP. Effects of a saddle shaped annulus on mitral valve function and chordal force distribution: an in vitro study. Ann Biomed Eng. 2003;31:1171–1181. doi: 10.1114/1.1616929. [DOI] [PubMed] [Google Scholar]
- Kincaid EH, Riley RD, Hines MH, Hammon JW, Kon ND. Anterior leaflet augmentation for ischemic mitral regurgitation. Ann Thorac Surg. 2004;78:564–568. doi: 10.1016/j.athoracsur.2004.02.040. discussion 568. [DOI] [PubMed] [Google Scholar]
- Komeda M, Glasson JR, Bolger AF, Daughters GT, 2nd, MacIsaac A, Oesterle SN, Ingels NB, Jr, Miller DC. Geometric determinants of ischemic mitral regurgitation. Circulation. 1997;96(II):128–133. [PubMed] [Google Scholar]
- Krishnamurthy G, Ennis DB, Itoh A, Bothe W, Swanson JC, Karlsson M, Kuhl E, Miller DC, Ingels NB., Jr Material properties of the ovine mitral valve anterior leaflet in vivo from inverse finite element analysis. Am J Physiol Heart Circ Physiol. 2008;295:H1141–H1149. doi: 10.1152/ajpheart.00284.2008. [DOI] [PMC free article] [PubMed] [Google Scholar]
- Kunzelman KS, Cochran RP, Chuong C, Ring WS, Verrier ED, Eberhart RD. Finite element analysis of the mitral valve. J Heart Valve Dis. 1993a;2:326–340. [PubMed] [Google Scholar]
- Kunzelman KS, Cochran RP, Murphree SS, Ring WS, Verrier ED, Eberhart RC. Differential collagen distribution in the mitral valve and its influence on biomechanical behaviour. J Heart Valve Dis. 1993b;2:236–244. [PubMed] [Google Scholar]
- Kunzelman KS, Einstein DR, Cochran RP. Fluid-structure interaction models of the mitral valve: function in normal and pathological states. Philos Trans R Soc Lond B Biol Sci. 2007;362:1393–1406. doi: 10.1098/rstb.2007.2123. [DOI] [PMC free article] [PubMed] [Google Scholar]
- Kunzelman KS, Reimink MS, Cochran RP. Flexible versus rigid ring annuloplasty for mitral valve annular dilatation: a finite element model. J Heart Valve Dis. 1998;7:108–116. [PubMed] [Google Scholar]
- Lanir Y. Constitutive equations for fibrous connective tissues. J Biomech. 1983;16:1–12. doi: 10.1016/0021-9290(83)90041-6. [DOI] [PubMed] [Google Scholar]
- Lee C-H, Amini R, Sakamoto Y, Carruthers CA, Aggarwal A, Gorman RC, Gorman JH, III, Sacks MS. Mitral valves: a computational framework. In: De S, Hwang W, Kuhl E, editors. Multiscale modeling in biomechanics and mechanobiology. Springer; London: 2015a. pp. 223–255. [Google Scholar]
- Lee CH, Amini R, Gorman RC, Gorman JH, 3rd, Sacks MS. An inverse modeling approach for stress estimation in mitral valve anterior leaflet valvuloplasty for in-vivo valvular biomaterial assessment. J Biomech. 2014;47:2055–2063. doi: 10.1016/j.jbiomech.2013.10.058. [DOI] [PMC free article] [PubMed] [Google Scholar]
- Lee CH, Carruthers CA, Ayoub S, Gorman RC, Gorman JH, Sacks MS. Quantification and simulation of layer-specific mitral valve interstitial cell deformation under physiological loading. J Theor Biol. 2015b;373:26–39. doi: 10.1016/j.jtbi.2015.03.004. [DOI] [PMC free article] [PubMed] [Google Scholar]
- Lee CH, Zhang W, Liao J, Carruthers CA, Sacks J, Sacks MS. On the presence of affine fibril and fiber kinematics in the mitral valve anterior leaflet under simulated physiological loading. Biophys J. 2015c;108:1–14. doi: 10.1016/j.bpj.2015.03.019. [DOI] [PMC free article] [PubMed] [Google Scholar]
- Mahmood F, Gorman JH, 3rd, Subramaniam B, Gorman RC, Panzica PJ, Hagberg RC, Lerner AB, Hess PE, Maslow A, Khabbaz KR. Changes in mitral valve annular geometry after repair: saddle-shaped versus flat annuloplasty rings. Ann Thorac Surg. 2010;90:1212–1220. doi: 10.1016/j.athoracsur.2010.03.119. [DOI] [PMC free article] [PubMed] [Google Scholar]
- Mansi T, Voigt I, Georgescu B, Zheng X, Mengue EA, Hackl M, Ionasec RI, Noack T, Seeburger J, Comaniciu D. An integrated framework for finite-element modeling of mitral valve biomechanics from medical images: application to MitralClip intervention planning. Med Image Anal. 2012;16:1330–1346. doi: 10.1016/j.media.2012.05.009. [DOI] [PubMed] [Google Scholar]
- May-Newman K, Yin FC. A constitutive law for mitral valve tissue. J Biomech Eng. 1998;120:38–47. doi: 10.1115/1.2834305. [DOI] [PubMed] [Google Scholar]
- Pouch AM, Wang H, Takabe M, Jackson BM, Gorman J, Gorman RC, Yushkevich PA, Sehgal CM. Fully automatic segmentation of the mitral leaflets in 3D transesophageal echocardiographic images using multi-atlas joint label fusion and deformable medial modeling. Med Image Anal. 2014;18:118–129. doi: 10.1016/j.media.2013.10.001. [DOI] [PMC free article] [PubMed] [Google Scholar]
- Prot V, Haaverstad R, Skallerud B. Finite element analysis of the mitral apparatus: annulus shape effect and chordal force distribution. Biomech Model Mechanobiol. 2009;8:43–55. doi: 10.1007/s10237-007-0116-8. [DOI] [PubMed] [Google Scholar]
- Prot V, Skallerud B. Nonlinear solid finite element analysis of mitral valves with heterogeneous leaflet layers. Comput Mech. 2009;43:353–368. [Google Scholar]
- Prot V, Skallerud B, Holzapfel G. Transversely isotropic membrane shells with application to mitral valve mechanics. Constitutive modelling and finite element implementation. Int J Numer Methods Eng. 2007;71:987–1008. [Google Scholar]
- Rabbah J-P, Saikrishnan N, Yoganathan AP. A novel left heart simulator for the multi-modality characterization of native mitral valve geometry and fluid mechanics. Ann Biomed Eng. 2013;41:305–315. doi: 10.1007/s10439-012-0651-z. [DOI] [PMC free article] [PubMed] [Google Scholar]
- Rabkin-Aikawa E, Farber M, Aikawa M, Schoen FJ. Dynamic and reversible changes of interstitial cell phenotype during remodeling of cardiac valves. J Heart Valve Dis. 2004;13:841–847. [PubMed] [Google Scholar]
- Reimink MS, Kunzelman KS, Verrier ED, Cochran RP. The effect of anterior chordal replacement on mitral valve function and stresses. A finite element study. Asaio J. 1995;41:M754–762. doi: 10.1097/00002480-199507000-00114. [DOI] [PubMed] [Google Scholar]
- Ritchie J, Jimenez J, He Z, Sacks MS, Yoganathan AP. The material properties of the native porcine mitral valve chordae tendineae: an in vitro investigation. J Biomech. 2006;39:1129–1135. doi: 10.1016/j.jbiomech.2005.01.024. [DOI] [PubMed] [Google Scholar]
- Robb JD, Minakawa M, Koomalsingh KJ, Shuto T, Jassar AS, Ratcliffe SJ, Gorman RC, Gorman JH., 3rd Posterior leaflet augmentation improves leaflet tethering in repair of ischemic mitral regurgitation. Eur J Cardiothorac Surg. 2011;40(6):1501–1507. doi: 10.1016/j.ejcts.2011.02.079. [DOI] [PMC free article] [PubMed] [Google Scholar]
- Sacks MS. Incorporation of experimentally-derived fiber orientation into a structural constitutive model for planar collagenous tissues. J Biomech Eng. 2003;125:280–287. doi: 10.1115/1.1544508. [DOI] [PubMed] [Google Scholar]
- Sacks MS, Chuong CJ, Templeton GH, Peshock R. In vivo 3-D reconstruction and geometric characterization of the right ventricular free wall. Ann Biomed Eng. 1993;21:263–275. doi: 10.1007/BF02368182. [DOI] [PubMed] [Google Scholar]
- Sacks MS, He Z, Baijens L, Wanant S, Shah P, Sugimoto H, Yoganathan AP. Surface strains in the anterior leaflet of the functioning mitral valve. Ann Biomed Eng. 2002;30:1281–1290. doi: 10.1114/1.1529194. [DOI] [PubMed] [Google Scholar]
- Sacks MS, Smith DB, Hiester ED. A small angle light scattering device for planar connective tissue microstructural analysis. Ann Biomed Eng. 1997;25:678–689. doi: 10.1007/BF02684845. [DOI] [PubMed] [Google Scholar]
- Sacks MS, Yoganathan AP. Heart valve function: a biomechanical perspective. Philos Trans R Soc Lond B Biol Sci. 2008;363:2481. doi: 10.1098/rstb.2007.2122. [DOI] [PMC free article] [PubMed] [Google Scholar]
- Schoen FJ, Levy RJ. Calcification of tissue heart valve substitutes: progress toward understanding and prevention. Ann Thorac Surg. 2005;79:1072–1080. doi: 10.1016/j.athoracsur.2004.06.033. [DOI] [PubMed] [Google Scholar]
- Shuhaiber J, Anderson RJ. Meta-analysis of clinical outcomes following surgical mitral valve repair or replacement. Eur J Cardiothorac Surg. 2007;31:267–275. doi: 10.1016/j.ejcts.2006.11.014. [DOI] [PubMed] [Google Scholar]
- Skallerud B, Prot V, Nordrum IS. Modeling active muscle contraction in mitral valve leaflets during systole: a first approach. Biomech Model Mechanobiol. 2011;10:11–26. doi: 10.1007/s10237-010-0215-9. [DOI] [PubMed] [Google Scholar]
- Smith DB, Sacks MS, Vorp DA, Thornton M. Surface geometric analysis of anatomic structures using biquintic finite element interpolation. Ann Biomed Eng. 2000;28:598–611. doi: 10.1114/1.1306342. [DOI] [PubMed] [Google Scholar]
- Stevanella M, Maffessanti F, Conti CA, Votta E, Arnoldi A, Lombardi M, Parodi O, Caiani EG, Redaelli A. Mitral valve patient-specific finite element modeling from cardiac MRI: application to an annuloplasty procedure. Cardiovas Eng Technol. 2011;2:66–76. [Google Scholar]
- Stevanella M, Votta E, Redaelli A. Mitral valve finite element modeling: implications of tissues’ nonlinear response and annular motion. J Biomech Eng. 2009;131:121010. doi: 10.1115/1.4000107. [DOI] [PubMed] [Google Scholar]
- Vassileva CM, Boley T, Markwell S, Hazelrigg S. Meta-analysis of short-term and long-term survival following repair versus replacement for ischemic mitral regurgitation. Eur J Cardiothorac Surg. 2011;39:295–303. doi: 10.1016/j.ejcts.2010.06.034. [DOI] [PubMed] [Google Scholar]
- Votta E, Le TB, Stevanella M, Fusini L, Caiani EG, Redaelli A, Sotiropoulos F. Toward patient-specific simulations of cardiac valves: state-of-the-art and future directions. J Biomech. 2013;46:217–228. doi: 10.1016/j.jbiomech.2012.10.026. [DOI] [PMC free article] [PubMed] [Google Scholar]
- Wang Q, Sun W. Finite element modeling of mitral valve dynamic deformation using patient-specific multi-slices computed tomography scans. Ann Biomed Eng. 2013;41:142–153. doi: 10.1007/s10439-012-0620-6. [DOI] [PubMed] [Google Scholar]


