

Abstract
Clinical risk factors are associated with increased probability of fracture in postmenopausal women. We sought to compare prediction models using self-reported clinical risk factors, excluding bone-mineral density (BMD), to predict incident fracture among postmenopausal women. The GLOW study enrolled women aged ≥55 years were seen at 723 primary care practices in 10 countries. The population comprised 19,586 women aged ≥60 years who were not receiving anti-osteoporosis medication and were followed annually for 2 years. Self-administered questionnaires were used to collect data on characteristics, fracture risk factors, previous fractures, and health status. The main outcome measure compares the c index for models using the WHO Fracture Risk (FRAX), the Garvan Fracture Risk Calculator (FRC), and a simple model using age and prior fracture. Over 2 years, 880 women reported incident fractures including 69 hip fractures, 468 “major fractures” (as defined by FRAX) and 583 “osteoporotic fractures” (as defined by FRC). Using baseline clinical risk factors, both FRAX and FRC showed moderate ability to correctly order hip fracture times (c index for hip fracture: 0.78 and 0.76, respectively). C indices for “major” and “osteoporotic” fractures showed lower values, at 0.61 and 0.64. Neither algorithm was better than the model based on age+fracture history alone (c index for hip fracture: 0.78). In conclusion, estimation of fracture risk in an international primary care population of postmenopausal women can be made using clinical risk factors alone, without BMD. However, more sophisticated models incorporating multiple clinical risk factors including falls were not superior to more parsimonious models in predicting future fracture in this population.
Keywords: FRACTURE, RISK FACTORS, POSTMENOPAUSAL WOMEN, PREDICTION, MODELS
Introduction
Clinical risk factors are associated with an increased probability of osteoporosis-associated fractures in postmenopausal women, and several therapies have been shown to lower fracture risk.(1-3) Bone mineral density (BMD) has also shown a strong association with fracture risk. However, most fractures occur in subjects with T-scores above –2.5, the threshold typically used to define osteoporosis, which means that relying solely on BMD will miss many patients at risk of fracture. Additionally, T-scores have been used to describe the increasing relative risk of fracture as T-scores decrease, but absolute fracture risk is increasingly recognized as superior to relative risk as a clinical tool. A number of algorithms using clinical risk factors, with or without BMD, have been developed which produce absolute risk estimates and these are becoming widely available.
To compare two different validated algorithms for fracture risk, in addition to a simpler model using age and prior fracture, we assessed incident fractures in a large cohort of women aged 60 years and older, treated in everyday practice. We compared model discrimination using the Fracture Risk Assessment Tool (FRAX)(4) and Fracture Risk Calculator (FRC)(5) algorithms using self-reported data from the Global Longitudinal Study of Osteoporosis in Women (GLOW). Our goal was to assess the use of these algorithms in an international cohort, based on self-reported clinical risk factors alone (ie, without BMD), and to compare their performance in identifying women at increased fracture risk who might benefit most from treatment with an anti-osteoporosis medication. In addition, we compared these newer models with simple models such as age plus prior fracture, both overall and by region.
Materials and Methods
Design overview, setting, and participants
The GLOW study is being conducted in physician practices at 17 sites in 10 countries (Australia, Belgium, Canada, France, Germany, Italy, The Netherlands, Spain, UK, and USA). These sites are located in major population centers. Details of the study design and methods have been described previously.(6) Study sites were selected on the basis of 1) geographic distribution and 2) the presence of lead investigators with expertise in osteoporosis and access to a clinical research team capable of managing a large cohort of subjects. These lead investigators identified primary care practices in their region that were members of local research or administrative networks and able to supply names and addresses of their patients electronically. The composition of groups varied by region and included health-system owned practices, managed practices, independent practice associations, and health maintenance organizations. Networks established for the purpose of general medical research were only used if they were not established exclusively for osteoporosis research and did not consist primarily of physicians whose primary focus was academic. Primary care physicians were defined as doctors who spent most of their time providing primary healthcare to patients, and included internists, family practitioners, and general practitioners. Each practice provided a list of the names and addresses of women aged 55 years and older who had been attended by their physician in the past 24 months. Sampling was stratified by age to ensure that two-thirds consisted of women aged 65 years and older. Patients were excluded if they were unable to complete the study survey due to cognitive impairment, language barriers, institutionalization, or illness.
Interventions, outcomes and follow-up
Questionnaires were designed to be self-administered and covered domains that included: patient characteristics and risk factors, medication use (currently taking or ever taken), medical diagnoses, healthcare use and access, physical activity, and physical and emotional health status.
Self-reports of personal risk factors included: current weight and height, parental hip fracture, two or more falls in the past 12 months, current use of cortisone or prednisone, diagnosis of rheumatoid arthritis, personal history of fracture (clavicle, arm, wrist, spine, rib, hip, pelvis, upper leg, lower leg, and ankle) since age 45 years, current cigarette smoking; and consumption of three or more units of alcohol daily. Subjects were considered to be taking anti-osteoporosis medications if they reported current use of alendronate, calcitonin, estrogen, etidronate, ibandronate, pamidronate, parathyroid hormone (PTH) 1–84, raloxifene, risedronate, strontium ranelate, teriparatide, tibolone, or zoledronate.
Baseline questionnaires, along with invitations to participate in the study signed by the local principal investigator, were mailed to all potential subjects. Non-respondents were followed up with sequential postcard reminders, second questionnaires, and telephone interviews. Questionnaires were mailed at 1 and 2 years to determine incident fractures.
Fracture risk algorithms
FRAX® is a risk-assessment tool that calculates the 10-year probability of hip fracture and major osteoporosis-related fracture (clinical spine, forearm, hip, or proximal humerus).(4) FRAX comprises 11 variables: age, sex, weight and height [to give body mass index (BMI)], previous fracture as an adult, parental hip fracture, current cigarette smoking, current (or 3 months of past) use of glucocorticoids, diagnosis of rheumatoid arthritis, consumption of three or more units of alcohol daily, and secondary osteoporosis. Secondary osteoporosis was defined as use of anastrozole, exemestane, or letrozole diagnosed with celiac disease, colitis, type I diabetes, or had menopause early (≤45 years). FRAX can be used with or without the addition of the BMD-derived T-score at the femoral neck. While a majority of women in GLOW reported having had a bone density test, precise BMD data were not gathered because the study data were collected through self-report. Country-specific FRAX estimates of fracture risk were determined by the World Health Organization (WHO) Collaborating Centre for Metabolic Bone Diseases, University of Sheffield, from de-identified raw data. For major fractures, self-reported clinical spine, forearm, hip, proximal humerus, or upper arm fractures over 2 years of follow-up were included.
The Garvan FRC is a risk-assessment tool that calculates the 5–10-year probability of hip fracture and osteoporotic fractures using five variables: age, sex, number of falls in the previous 12 months, number of fractures since age 50 years, and lumbar spine or femoral neck BMD.(5) As noted above, since BMD data were not collected, height and weight were used in the algorithm, which was calculated by researchers at the Garvan Institute, again using de-identified raw data. The osteoporotic fractures as defined by FRC include those of the hip, spine, wrist, hand, upper arm, shoulder, clavicle, upper leg, lower leg, knee, pelvis, and sternum. Because FRC was developed for subjects aged at least 60 years, the analyses below are restricted to those subjects in GLOW aged 60 and above.
The model that included only age and prior fracture is similar to that described by Ensrud et al.(7) The model was developed using three Cox proportional hazards regression models (or Cox models) for outcomes of incident hip, major, and osteoporotic fractures during the 2 years of follow-up. The models predicted probability of 2-year incident hip, major, and osteoporotic fractures.
An analysis was conducted to compare observed with predicted fractures (both major and osteoporotic) within each study site. Owing to the low incidence of fracture data at individual sites outside the US, for these site comparisons, only two risk groups could be formed, based on a cut point at the median predicted risk. For the US data, the number of subjects was sufficient to permit analysis according to quintiles of risk. The number of hip fractures was not large enough to perform an analysis of hip fracture by study site.
Statistical analysis
Since not all women had 2 complete years of follow-up, our main analyses used Kaplan-Meier estimation to obtain fracture incidence rates, and the Cox time to event model to predict cumulative fracture probabilities. We considered Cox models including prior falls and weight, but these factors did not add significantly to a simple model of age and prior fracture. For the age and prior fracture models, there was no significant interaction of age with country or prior fracture with country. As coefficients for FRAX model variables were not available, both FRAX and FRC model-predicted probabilities were computed by sending GLOW data for the relevant variables to the developers of each model, who then returned to us the 10-year predicted fracture rates for each woman. We verified a small random sample of these results by computing the 10-year risks using the FRAX and FRC websites. To estimate 2-year rates from the 10-year rates, we assumed a linear (ie, unchanging) fracture rate over the 10-year period.
Let F=cumulative 10-year fracture rate, and p=fracture rate per year.
Then p = 1 –exp(ln(1–F)/10). The 2-year predicted fracture rate is then 1 – (1–p)2.
Based on Cox models for our 3 outcomes, we divided women into risk quartiles and compared Kaplan-Meier observed fracture rates for the different risk factor models across the quartiles. Agreement as to how well pairs of models assigned women to risk quartiles was tested using the weighted Kappa statistic. Since 2-year fracture incidence rates are dichotomous, 95% confidence intervals (CIs) for the rates were computed using the variance of a binomial variable. We assessed Cox model discrimination using Harrell’s c index, an extension of the logistic regression c-statistic. To compare our models to papers where logistic regression was used, we calculated logistic regression c-statistics for women who completed both years of follow-up. All analysis was conducted using SAS software package (SAS Institute, Cary, NC version 9.2).
Results
Between October 2006 and February 2008, 60,393 women from the practices of 723 physicians were enrolled in GLOW. Approximately 25,000 women were from eight sites and 274 physician practices in Europe; 28,000 women were from 255 practices in the USA; and almost 7000 women from 86 practices in Canada and Australia.
After excluding subjects aged <60 years, those on anti-osteoporosis medication, and those with incomplete data (Fig. 1), the study population comprised 19,586 women. Approximately 91% of women who completed at least one follow-up survey had complete 2-year follow-up. A total of 67 women sustained an incident hip fracture, 468 sustained an incident FRAX-defined major fracture, and 583 sustained an FRC-defined osteoporotic fracture over 2 years of follow-up. Clinical risk factors and 2-year fracture incidence rates are shown in Table 1. As expected, women sustaining fractures were older, lighter, shorter, had fallen more often in the previous 12 months, had a higher prevalence of fractures after age 45 years, higher use of corticosteroids, and higher parental history of hip fracture (data not shown).
Figure 1.

Patient flowchart.
Table 1.
Two-Year Fracture Incidence Rates as Percentages by Clinical Risk Factors (n=19,586)
| Risk factors | n | Hip fracture (n=67) |
Major fracturea (n=468) |
Osteoporotic fractureb (n=583) |
|---|---|---|---|---|
| All women | 19 586 | 0.4 | 2.6 | 3.2 |
| Age | ||||
| 60–64 years | 5639 | 5 (0.1) | 92 (1.8) | 118 (2.3) |
| 65–74 years | 8897 | 15 (0.2) | 189 (2.3) | 240 (2.9) |
| 75–84 years | 4253 | 31 (0.8) | 144 (3.7) | 174 (4.5) |
| ≥85 years | 797 | 16 (2.3) | 43 (6.3) | 51 (7.5) |
| Body mass index | ||||
| Low (<22 kg/m2) | 2605 | 16 (0.7) | 76 (3.1) | 88 (3.7) |
| Normal (22–24.9 kg/m2) | 4612 | 16 (0.4) | 109 (2.5) | 140 (3.3) |
| Overweight (25–29.9 kg/m2) | 7088 | 22 (0.3) | 175 (2.7) | 216 (3.3) |
| Obese (≥30 kg/m2) | 5281 | 13 (0.3) | 108 (2.2) | 139 (2.9) |
| Low weight (<56.7 kg) | 2462 | 15 (0.6) | 79 (3.5) | 94 (4.2) |
| Fallen at least once in past 12 months | 6920 | 35 (0.5) | 219 (3.4) | 277 (4.3) |
| Any fracture after age 45 years | 4008 | 27 (0.7) | 160 (4.4) | 199 (5.5) |
| Currently taking corticosteroids | 385 | 4 (1.1) | 13 (3.8) | 17 (4.9) |
| Parental hip fracture | 3169 | 17 (0.6) | 77 (2.6) | 102 (3.5) |
| Current smoker | 1539 | 2 (0.1) | 33 (2.4) | 40 (2.9) |
| Alcohol use (≥21 drinks/week) | 103 | 1 (1.0) | 5 (5.1) | 5 (5.1) |
| Secondary osteoporosisc | 4029 | 15 (0.4) | 104 (2.8) | 129 (3.5) |
| Rheumatoid arthritis | 103 | 2 (2.0) | 4 (4.0) | 5 (5.0) |
Note: data are number (%).
Defined as an incident fracture of the hip, spine, wrist, shoulder, or upper arm.
Defined as an incident fracture of the hip, spine, wrist, shoulder, upper arm, hand, clavicle, upper leg, lower leg, knee, pelvis, or sternum.
FRAX definition.
Table 2 provides hazard ratios and 95% CIs for the age and prior fracture model for hip fracture, major fracture and osteoporotic fracture. C indices were similar in the three models. For hip fracture, the age and prior fracture model c index was 0.78, compared with 0.78 for FRAX and 0.76 for FRC. For major fracture, the c index for the age and prior fracture model was 0.63, compared with 0.61 for FRAX. For osteoporotic fracture, the age and prior fracture model was 0.62, compared with 0.64 for FRC. Logistic regression c-statistics (also known as areas under the receiver-operating curve or AUC’s) for these models were: 0.75, 0.65, and 0.61 for hip fracture in the age and prior fracture, FRAX, and FRC models; 0.62 and 0.60 for major fracture in the age and prior fracture, and FRAX models; and 0.62 and 0.64 for osteoporotic fracture in the age and prior fracture, and FRC models.
Table 2.
Hazard ratios and 95% confidence intervals in the age and prior fracture risk model.
| Hip fracture | Major fracture | Osteoporotic fracture | |
|---|---|---|---|
| Age per 10-year increase |
3.27 (2.46, 4.34) | 1.51 (1.34, 1.69) | 1.46 (1.32, 1.62) |
| Prior fracture | 1.80 (1.10, 2.96) | 1.82 (1.50, 2.21) | 1.85 (1.55, 2.20) |
The proportion of women in each quartile of predicted risk who fractured was similar for comparisons between each of the models (Figure 2). For hip fractures, all models showed similar proportions of women who actually experienced a hip fracture (age and prior fracture model 0.95% (95% CI 0.68%, 1.22%), FRAX model 0.94% (95% CI 0.67%, 1.21%), FRC 0.86% (95% CI 0.60%, 1.12%). The percentage of women in the highest risk quartile for major osteoporotic fracture who had a fracture in the age and prior fracture model was 4.5% (95% CI 3.9%, 5.1%), and in the FRAX model was 4.2% (95% CI 3.6%, 4.8%) (Figure 3). Similarly for osteoporotic fractures, percentages in the age and prior fracture and FRC models were 5.6% (95% CI 4.9%, 6.3%) and 5.8% (95% CI 5.1%, 6.5%), respectively (Figure 4).
Figure 2.
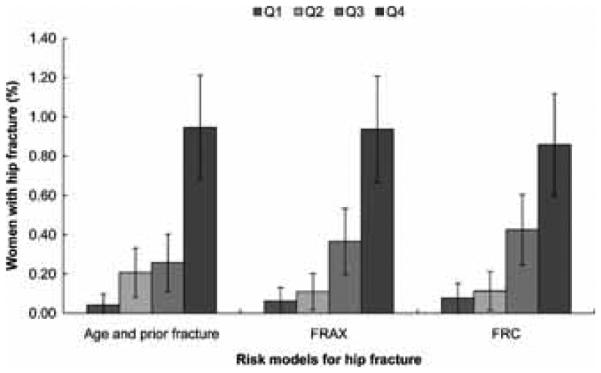
Percentages of women in GLOW with incident hip fractures according to the quartiles of predicted risk of hip fractures based on the GLOW model with age and prior fracture, the FRAX model, and the FRC model.
Figure 3.
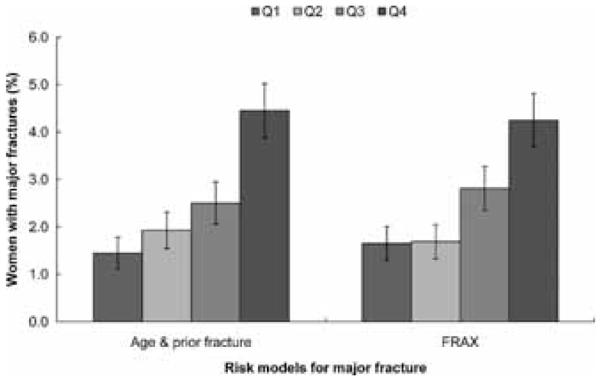
Percentages of women in GLOW with major incident fractures according to the quartiles of 2-year probability of major fractures based on the GLOW model with age and prior fracture and the FRAX model.
Figure 4.
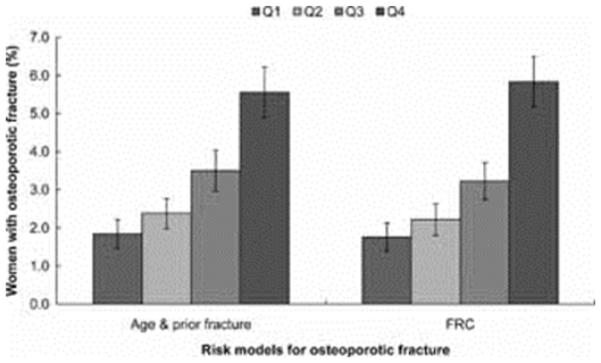
Percentages of women in GLOW with 2-year osteoporotic fractures according to the quartiles of 2-year probability of osteoporotic fracture based on the GLOW model with age and prior fracture and the FRC model.
Agreement between the models when assessed using a weighted Kappa statistic was modest for quartiles of predicted risk. For hip fracture the weighted Kappas were 0.67 for age and prior fracture versus FRAX, 0.55 for age and prior fracture versus FRC, and 0.64 for FRAX versus FRC. For quartiles of predicted risk of major fracture, the weighted Kappa was 0.60 for age and prior fracture versus FRAX, and for osteoporotic fracture, 0.76 for age and prior fracture versus FRC.
For hip fracture, the proportion of women in the highest risk quartile of FRAX that were also in the highest quartile for the other models was 76% for the age and prior fracture model, and 74% for FRC. Also for hip fracture, 75% of those in the highest quartile of FRC were in the highest quartile of the age and prior fracture model. For major fracture, 73% of those in the highest FRAX quartile were in the highest quartile of the age and prior fracture model. For osteoporotic fracture 82% of those in the highest quartile of FRC were also in the highest quartile of the age and prior fracture model.
Discussion
In this large international study, three models were used to study absolute risk prediction of fracture in postmenopausal women for whom BMD results were not available. Using self-reported clinical risk factors, all models were moderately effective in predicting risk of future hip fracture and less effective in predicting major and osteoporotic fractures. The performance of the prediction models was similar for each fracture type based on the c-indices derived from Cox regression models. Additionally, consistent with previous research,(7) all models categorized nearly identical proportions of women in the highest quartiles of risk for the different fracture types. The addition of BMD data may have improved the utility of these algorithms for assessing fracture risk, but was not available in this study.
The Kappa results show that agreement in categorization of women according to quartiles of risk is moderate. However, with regard to identifying women at the highest risk, approximately three quarters of women classified in the top quartiles by FRAX are also categorized as highest risk by the FRC and the age and prior fracture models for hip and major fracture (age and prior fracture only). Similar results were found for the concordance of those classified as high risk by FRC with age and prior fracture model for osteoporotic fracture. If women were selected for treatment based on being in the highest quartile of risk, the same women would meet the threshold for treatment at least three quarters of the time regardless of the model used.
These results are of interest given that the two algorithms use quite different clinical risk factors to estimate risk. For example, unlike the FRC algorithm, the FRAX algorithm includes a history of chronic glucocorticoid use. The FRC algorithm includes number of falls in the previous 12 months and the total number of fractures since age 50 years, whereas the FRAX algorithm does not include falls, and treats previous fractures as a simple yes or no category. In the GLOW cohort, in the absence of BMD data, the inclusion of additional risk factors does not appear to alter fracture risk estimation substantially. This finding would be best confirmed by testing the addition of risk factors beyond age and prior fracture using the coefficients from each of the models, but the FRAX and FRC coefficients were not available for this study.
Only a few other studies have compared these algorithms. Pluskiewicz et al.(8) reported data in 2012 postmenopausal Polish women in whom information on clinical risk factors and BMD was available. The AUCs for total fractures obtained with FRAX and FRC were higher (0.833 and 0.879, respectively) than in our study. However, the authors included BMD data, and fractures were not measured prospectively as the study was cross-sectional. Sandhu et al.(9) also performed a comparative case-control study of 144 women and 56 men attending a fracture clinic. Of the 144 women, 69 had sustained fractures. The average 10-year probability of major fracture was higher in the fracture group than the non-fracture group for both algorithms, although the AUC obtained was higher using the FRC model (AUC 0.84 versus 0.77 for FRAX-US and 0.78 for FRAX-UK). However, the authors acknowledged that their sample size was small and that the findings deserved re-examination in larger clinical data sets.(9)
Bolland et al.(10) reported a comparison of FRAX versus the Garvan FRC based on 1422 New Zealand women enrolled in a 5-year trial of calcium who were followed up after the trial. Both algorithms produced similar AUCs to those that we observed (0.67–0.70 for hip fractures) and the authors observed the FRC overestimated hip fractures whereas FRAX, with or without BMD, underestimated osteoporotic and hip fractures. However, only 57 hip fractures and 279 osteoporotic fractures occurred over the 8.8 years of follow-up so although the study had longer follow-up, it was relatively underpowered, especially with regard to hip fractures.
A number of other studies have examined the utility of FRAX in predicting fracture. In our study, the c-statistic for the age and prior fracture hip fracture model (0.75) exceeds that reported in the FRAX validation studies by Kanis et al.(3) for hip fractures (0.67), but is lower for the FRAX and FRC models without BMD (0.65 and 0.61, respectively). The c-statistic for the age and prior fracture and FRAX models for major fracture (0.62 and 0.60, respectively) were similar to that reported by Kanis et al (0.62) when FRAX was calculated without BMD.
Ensrud et al.(7) compared FRAX models that included BMD with simple models based on BMD and age or fracture history in a prospective cohort study of 6252 women aged 65 years and older. C-statistics from logistic regression showed no differences between the FRAX models without BMD and the simple models based on age and previous fracture in discriminating major fracture (0.64 for both models). Our AUC analysis for major fracture (0.60 for FRAX, and 0.62 for age and prior fracture), and osteoporotic fracture (0.64 for FRC, and 0.62 for age and prior fracture) also gave virtually identical AUCs. With regard to hip fracture prediction, our age and fracture model had a higher AUC than FRAX or FRC (0.75 for age and prior fracture model, 0.65 for FRAX, and 0.61 for FRC), whereas the age and prior fracture model presented in Ensrud et al. and FRAX showed identical AUCs for hip fracture. Trémollieres et al.(11) assessed the discriminatory capacity of FRAX and BMD in 2651 perimenopausal and early postmenopausal women (mean age 54 years) with a mean follow-up of 13.4 years. During follow-up, 415 women sustained a first low-energy fracture, including 145 major fractures (108 wrist, 44 spine, 20 proximal humerus, and 13 hip). In the subsample of women who had a hip BMD measurement and were not receiving anti-osteoporosis medication (including hormone-replacement therapy) at baseline, the overall discriminative value for fractures, as measured by the AUC, was 0.63 [95% CI 0.56–0.69) for FRAX and 0.66 (95% CI 0.60–0.73) for hip BMD.
Leslie et al.(12) assessed the performance of a Canadian model of FRAX in 36,730 women followed for up to 10 years in the Manitoba bone density program database. Over 10 years, 549 patients with incident hip fractures were seen, and the AUC for hip fractures with FRAX was 0.83 with BMD and 0.79 without BMD.
The intention in GLOW was to include subjects who were broadly representative of postmenopausal women by attempting to enlist all such women who were active patients in each physician’s practice. However, as a non-randomized, observational, practice-based study, GLOW is subject to biases in both the selection of physicians and the sampling and recruitment of patients. Physicians who agreed to participate may not be representative of all physicians in a given area with respect to osteoporosis recognition and management. It is possible that the participants have greater interest in bone health issues, and seek information, screening, and treatment more actively than non-participants. A comparison of the US sample to women of the same age in the third National Health and Nutrition Examination Survey (NHANES III) showed minimal differences between GLOW and a representative sample of US women.(6) More women in GLOW, however, had greater than a high school education (67%) than those in NHANES III (47%), and more were non-Hispanic white (86% versus 80%, respectively. Race data were consistently available only for U.S. study sites). Possible confusion among subjects between rheumatoid arthritis and other types of arthritis may have increased self-reports of this FRAX risk factor, although we attempted to reduce such potential misclassification by examining the subject’s use of anti-rheumatic medication. We also considered only current use of the corticosteroids prednisone and cortisone as a risk factor, whereas FRAX considers “ever use” a risk. FRAX and FRC provide 10-year estimates of fracture risk and we have assumed a linear fracture rate over 10 years to estimate 2-year rates, whereas the competing risk of death over 10 years included in FRAX, but not FRC, may influence this assumption. Our fractures were self-reported and not validated by X-ray reports. Evidence supports a high degree of accuracy for patient report of hip fractures, though other factures may be less accurately reported.(13) The simple model of age and prior fracture that we examined used the same data from which it was developed. An internally derived model, especially when derived from a single cohort, will almost invariably provide good discrimination because it is constructed to best fit the data from which it was derived. However, our model was applied separately to each regional GLOW sample, and a statistically significant difference between observed and expected fracture incidence was found for only two of the 10 countries in the study. The hip fracture incidence among GLOW subjects is lower than reported in cohorts recruited between the 1990s through early 2000s, but those studies included subjects in nursing homes and there is evidence that hip fracture incidence has declined in the West over that period.(14) The GLOW hip fracture incidence is similar to that of a more recently recruited cohort.(15)
Our results could differ from those of other studies with longer follow-up if time-dependent risk factors have more impact on fracture risk when fracture outcomes are assessed over a shorter time period. However, it is difficult to assess the possible effect of shorter follow-up time given the lack of data on the effect of time on the contribution to risk for all of the risk factors included in the models. A final limitation is that our age and prior fracture model was not validated on external data.
It must be noted that while these calculators may predict those who are at high risk of future fracture, they are not designed to be diagnostic tools and do not necessarily identify how best to treat such subjects. A major strength of this paper is that, unlike many other publications in which the performance of fracture risk models is compared in one sample from a single country, the GLOW subjects in this paper are from several different regions throughout the world.
Conclusions
Our data – derived from 19,586 postmenopausal women from 10 countries in three continents – indicate that the use of self-reported clinical risk factors predicted risk of fracture with moderate ability, better for hip than for all other fractures, and that estimation of fracture risk can be made in everyday clinical practice. A simple model that consists of age and prior fracture performs as well as more complex models when BMD is unknown.
Acknowledgments
We thank the physicians and project coordinators participating in GLOW. Editorial support for the final version of this article, comprising language editing, content checking, formatting, and referencing was provided by Sophie Rushton-Smith, PhD. Financial support for the GLOW study is provided by Warner Chilcott Company, LLC and sanofi-aventis to the Center for Outcomes Research, University of Massachusetts Medical School. Authors’ roles: Drafting manuscript: PS. Critical revision and intellectual strengthening of manuscript: PS, FH. Statistical analysis: JF, DH. Study concept and design: All authors. Study supervision: FH. PS had full access to all of the data in the study and take responsibility for the integrity of the data and the accuracy of the data analysis. The sponsor had no involvement in the design and conduct of the study; collection, management, analysis, and interpretation of the data; and preparation, review, or approval of the manuscript. SB is senior clinical investigator of the Fund for Scientific Research, Flanders, Belgium (FWO-Vlaanderen) and holder of the Leuven University Chair in Metabolic Bone Diseases.
Footnotes
The authors state that they have no conflicts of interest.
References
- 1.NIH Consensus Development Panel on Osteoporosis Prevention D, and Therapy, 2001 Osteoporosis prevention, diagnosis, and therapy. JAMA. 285(6):785–795. doi: 10.1001/jama.285.6.785. [DOI] [PubMed] [Google Scholar]
- 2.Sambrook P, Cooper C. Osteoporosis. Lancet. 2006;367(9527):2010–2018. doi: 10.1016/S0140-6736(06)68891-0. [DOI] [PubMed] [Google Scholar]
- 3.Kanis JA, Oden A, Johnell O, Johansson H, De Laet C, Brown J, Burckhardt P, Cooper C, Christiansen C, Cummings S, Eisman JA, Fujiwara S, Gluer C, Goltzman D, Hans D, Krieg MA, La Croix A, McCloskey E, Mellstrom D, Melton LJ, 3rd, Pols H, Reeve J, Sanders K, Schott AM, Silman A, Torgerson D, van Staa T, Watts NB, Yoshimura N. The use of clinical risk factors enhances the performance of BMD in the prediction of hip and osteoporotic fractures in men and women. Osteoporos Int. 2007;18(8):1033–1046. doi: 10.1007/s00198-007-0343-y. [DOI] [PubMed] [Google Scholar]
- 4.Kanis JA, Johnell O, Oden A, Johansson H, McCloskey E. FRAX and the assessment of fracture probability in men and women from the UK. Osteoporos Int. 2008;19(4):385–397. doi: 10.1007/s00198-007-0543-5. [DOI] [PMC free article] [PubMed] [Google Scholar]
- 5.Garvan Institute Fracture Risk Calculator. http://www.garvan.org.au/bone-fracture-risk/. Accessed: October 14, 2010.
- 6.Hooven FH, Adachi JD, Adami S, Boonen S, Compston J, Cooper C, Delmas P, Diez-Perez A, Gehlbach S, Greenspan SL, LaCroix A, Lindsay R, Netelenbos JC, Pfeilschifter J, Roux C, Saag KG, Sambrook P, Silverman S, Siris E, Watts NB, Anderson FA., Jr. The Global Longitudinal Study of Osteoporosis in Women (GLOW): rationale and study design. Osteoporos Int. 2009;20(7):1107–1116. doi: 10.1007/s00198-009-0958-2. [DOI] [PMC free article] [PubMed] [Google Scholar]
- 7.Ensrud KE, Lui LY, Taylor BC, Schousboe JT, Donaldson MG, Fink HA, Cauley JA, Hillier TA, Browner WS, Cummings SR. A comparison of prediction models for fractures in older women: is more better? Arch Intern Med. 2009;169(22):2087–2094. doi: 10.1001/archinternmed.2009.404. [DOI] [PMC free article] [PubMed] [Google Scholar]
- 8.Pluskiewicz W, Adamczyk P, Franek E, Leszczynski P, Sewerynek E, Wichrowska H, Napiorkowska L, Kostyk T, Stuss M, Stepien-Klos W, Golba KS, Drozdzowska B. Ten-year probability of osteoporotic fracture in 2012 Polish women assessed by FRAX and nomogram by Nguyen et al.-Conformity between methods and their clinical utility. Bone. 2010;46(6):1661–1667. doi: 10.1016/j.bone.2010.02.012. [DOI] [PubMed] [Google Scholar]
- 9.Sandhu SK, Nguyen ND, Center JR, Pocock NA, Eisman JA, Nguyen TV. Prognosis of fracture: evaluation of predictive accuracy of the FRAX algorithm and Garvan nomogram. Osteoporos Int. 2010;21(5):863–871. doi: 10.1007/s00198-009-1026-7. [DOI] [PubMed] [Google Scholar]
- 10.Bolland MJ, Siu AT, Mason BH, Horne AM, Ames RW, Grey AB, Gamble GD, Reid IR. Evaluation of the FRAX and Garvan fracture risk calculators in older women. J Bone Miner Res. 2010 doi: 10.1002/jbmr.215. [DOI] [PubMed] [Google Scholar]
- 11.Tremollieres FA, Pouilles JM, Drewniak N, Laparra J, Ribot CA, Dargent-Molina P. Fracture risk prediction using BMD and clinical risk factors in early postmenopausal women: sensitivity of the WHO FRAX tool. J Bone Miner Res. 2010;25(5):1002–1009. doi: 10.1002/jbmr.12. [DOI] [PMC free article] [PubMed] [Google Scholar]
- 12.Leslie WD, Lix LM, Johansson H, Oden A, McCloskey E, Kanis JA. Independent clinical validation of a Canadian FRAX tool: fracture prediction and model calibration. Journal of bone and mineral research : the official journal of the American Society for Bone and Mineral Research. 2010;25(11):2350–2358. doi: 10.1002/jbmr.123. [DOI] [PubMed] [Google Scholar]
- 13.Ismail AA, O'Neill TW, Cockerill W, Finn JD, Cannata JB, Hoszowski K, Johnell O, Matthis C, Raspe H, Raspe A, Reeve J, Silman AJ, EPOS Study Group; European Prospective Osteoporosis Study Group Validity of self-report of fractures: results from a prospective study in men and women across Europe. EPOS Study Group. Osteoporos Int. 2000;11(3):248–254. doi: 10.1007/s001980050288. [DOI] [PubMed] [Google Scholar]
- 14.Kannus P, Niemi S, Parkkari J, Palvanen M, Vuori I, Jarvinen M. Nationwide decline in incidence of hip fracture. J Bone Miner Res. 2006;21(12):1836–1838. doi: 10.1359/jbmr.060815. [DOI] [PubMed] [Google Scholar]
- 15.Langsetmo L, Nguyen TV, Nguyen ND, Kovacs CS, Prior JC, Center JR, Morin S, Josse RG, Adachi JD, Hanley DA, Eisman JA. Independent external validation of nomograms for predicting risk of low-trauma fracture and hip fracture. CMAJ : Canadian Medical Association journal = journal de l'Association medicale canadienne. 2011;183(2):E107–114. doi: 10.1503/cmaj.100458. [DOI] [PMC free article] [PubMed] [Google Scholar]