Abstract
Spatial and temporal aspects of immune cell signalling are key parameters in defining the magnitude of an immune response. Toll-like receptors (TLRs) on innate immune cells are important in early detection of pathogens and initiation of an immune response. Controlling the spatial and temporal signalling of TLRs would enable further study of immune synergies and assist in the development of new vaccines. Here, we show a light-based method for spatial control of TLR4 signalling. A TLR4 agonist, pyrimido[5,4-b]indole, was protected with a cage at a position critical for receptor binding. This afforded a photo-controllable agonist that was inactive while caged, yet effected NF-κB activity in cells following UV photo-controlled deprotection. We demonstrated spatial control of NF-κB activation within a population of cells by treating all cells with the caged TLR4 agonist and constraining light exposure, thereby activation, to a region of interest.
Keywords: immunology, immune agents, cage compd, signal transduction, receptors
Toll-like receptor 4 (TLR4) is a key receptor in innate immune signaling with a complicated set of actions. TLR4 is activated by a diverse array of structures, including lipopolysaccharide and its variants[1–6], peptides[7], proteins[8–10], and small molecules[11,12]. These agonists are used in vaccines against human papilloma virus[13], and also contribute to the inflammation in opioid interactions[14] and many allergies[15]. Agonist stimulation of TLR4 leads to the activation of the MyD88 and/or TRIF signaling pathways, resulting in activation of transcription factors, including nuclear factor κB (NF-κB) and interferon-regulating factors.[16] The resulting immune response and its magnitude are determined by the balance of the two pathways over time.[2,17] Despite the strong spatial and temporal components of TLR signaling[18,19], there are few examples of controlling immune cells in time or space[20–22], and no methods yet exist to modulate TLR4 activity. In contrast, the field of neuro-biology has been using light-controlled methods to control spatial and temporal elements for over three decades.[23–28]
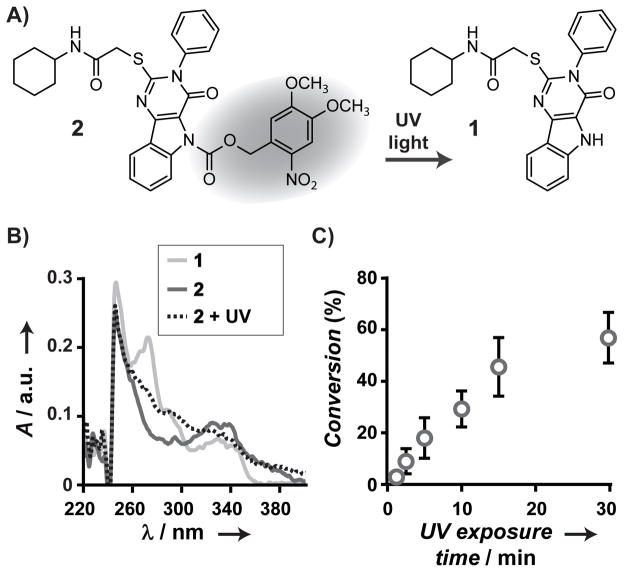
Here we show the first example of a light-controlled TLR4 agonist. We build on our previous work constructing a caged TLR7/8 agonists,[29] by appending a cage to temporarily suspend activity of a synthetic TLR4 agonist, pyrimido[5,4-b]indole (1, N-cyclohexyl-2-((4-oxo-3-phenyl-4,5-dihydro-3H-pyrimido[5,4-b]indol-2-yl)thio)acetamide). In the structure-activity relationship (SAR) study of substituted pyrimido[5,4-b]indoles performed by Cottam, et. al., the indole nitrogen of 1 did not tolerate substitution[11]. Therefore, we chose this position as the site to install the photo-labile cage (Figure 1A). The caged TLR4 agonist was generated by protection of the indole nitrogen with 6-nitroveratryloxycarbonyl (NVOC). Upon exposure to light, the caged TLR4 agonist 2, N-cyclohexyl-2-((5-6-nitroveratryloxycarbonyl-4-oxo-3-phenyl-4,5-dihydro-3H-pyrimido[5,4-b]indol-2-yl)thio)acetamide, is converted back to 1. The caged agonist 2 activates NF-κB in TLR4-bearing cells only after exposure to UV light (Figure 2A). We use this caged agonist to spatially confine activation within a cell population using light, and observe this effect by monitoring nuclear translocation of fluorescently-labeled NF-κB in fibroblasts. Future experiments with caged agonists may help elucidate spatial and temporal enigmas in TLR signaling pathways, and lend to the development of new vaccines.
Figure 1.
Photo-controlled deprotection of a NVOC-caged pyrimido[5,4-b]indole. Deprotection of the cage on 2 with UV light affords the agonist 1 (A). Deprotection was observed by UV-Vis absorption (B) of 2 before (solid blue line) and after 30 min light exposure (15 W, 365 nm, dashed black line), as compared to 1 (solid red line). Percent conversion (C) of 2 to 1 following light exposure (15 W, 365 nm) was determined by HPLC analysis. Conversion of the caged agonist reaches 57% after 30 min of UV light exposure.
Figure 2.
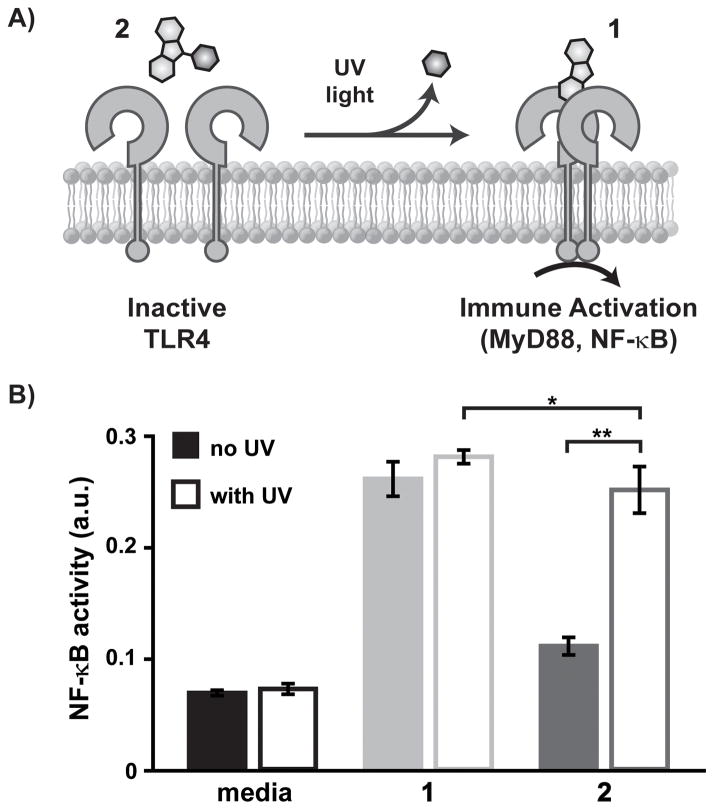
Light-controlled NF-κB activation in reporter cells, RAW-Blue macrophages. Caged agonist 2 does not activate TLR4 until photo-control deprotection with UV light to produce the active TLR4 agonist 1 (A). Cells were treated with media only (black), 1 (10 μM; red), 2 (10 μM; solid blue), without (solid) or with (outlined) UV light exposure at 15W of 365 nm light (B). NF-κB activation was determined using the SEAP colorimetric assay (OD measured at 620 nm). Each experiment was performed in replicates of five (*p < 0.05 and **p < 0.001).
Our development of a light-controlled TLR4 agonist began with the synthesis of the active small molecule TLR4 agonist, pyrimido[5,4-b]indole 1, as described previously.[11] The caged TLR4 agonist was generated by NVOC-protection of 1. Protection at the indole nitrogen was confirmed via high-resolution mass spectrometry, and 1H and 13C NMR spectroscopy (Supplemental Information).
The deprotection efficiency of 2 was established by UV absorption, combined with HPLC analysis of 1 and 2 before and after light exposure. A long wave UV hand lamp (15 W, 365 nm) was used as the light source. The UV absorption spectrum of 1 ranges from 250 to 360 nm with two local maxima at 250 and 280 nm (Figure 1B). The spectrum of 2 exhibits only the peak at 250 nm. Following exposure of 2 to UV light for 30 min, a peak in the spectrum appears at 280 nm though it did not increase in intensity with further exposure. The presence of 1 following light exposure of 2 was confirmed by HPLC analysis (Figure S1). In these data, 1 and 2 are pure and have elution times of 13.5 and 17.1 min, respectively. The amount of each species was quantified by integrating the area under the correlated LC peak. For solutions where 2 was not exposed to UV light, 1 was not detected. For solutions of 2 exposed to UV light, the peak at 17.1 min decreased, and the peak at 13.5 min appears and grows with increased exposure to UV light up to 30 min. Conversion of 2 to 1 reached a maximum of 57% after 30 min of UV light exposure (Figure 1C). HPLC and mass spectrometry analysis of 2 after exposure to UV light showed that 1 was the major species in addition to the formation of byproducts. The limited conversion is due to a fraction of caged compound that does not readily deprotect under the mild conditions used.
We confirmed that photo-deprotection of the caged agonist translated to light-controlled activation of TLR4 by testing 2 on a model cell line bearing TLRs—RAW-Blue macrophages. These cells express the TLR4 signaling machinery and a secreted embryonic alkaline phosphotase (SEAP) reporter for NF-κB activation. SEAP levels are monitored using a detection medium, QUANTI-Blue, affording a colorimetric readout of TLR activation, but not temporal activity. This assay served as an initial examination of immune activity of the unmodified 1 and caged 2 agonists. Based on the previous SAR study of 1[11] and our deprotection characterization of 2, we predicted that 1 and 2, after UV light exposure, would effect immune activity, while 2, without UV light exposure, would have little to no effect on NF-κB acivity in cells.
RAW-Blue cells were treated with 1 or 2 (10 μM), then exposed to UV light (15 W, 365 nm) for 10 min. The cells were incubated for 18 h before the culture supernatant was analyzed to determine NF-κB activation. We observed the selective activation of cells upon UV light exposure (Figure 2B). Treatment of RAW-Blue cells with 2 without UV light resulted in minimal NF-κB activity. This background activity is likely due to enzymatic activity over the time course of the experiment (not observed in later experiments that probe real time activation of TLR4, Figure S5–6). Treatment with 2 and exposure to UV light yielded NF-κB activity equivalent in concentration to the TLR4 agonist 1. This result was most clearly seen using 10 μM agonist, and is consistent with previous concentration screens of 1, which show a non-linear relationship of concentration and NF-κB activity.[11] A challenge in innate immunity is that agonist concentration is not an absolute measure of immune cell activity. As such, the deprotection kinetics measured cannot be directly related to cell experiments and immune activity. Additionally, we confirmed that UV light did not have an effect on cells. We compared NF-κB activity in cells treated with 2 and directly exposed to light versus cells treated with a pre-irradiated solution of 2 (Figure S4). Direct UV light exposure did not effect cell activity. This preliminary assessment of the activities of the the TLR4 agonist and caged agonist led us to investigate real-time activation of NF-κB using a cell line where we could measure kinetics.
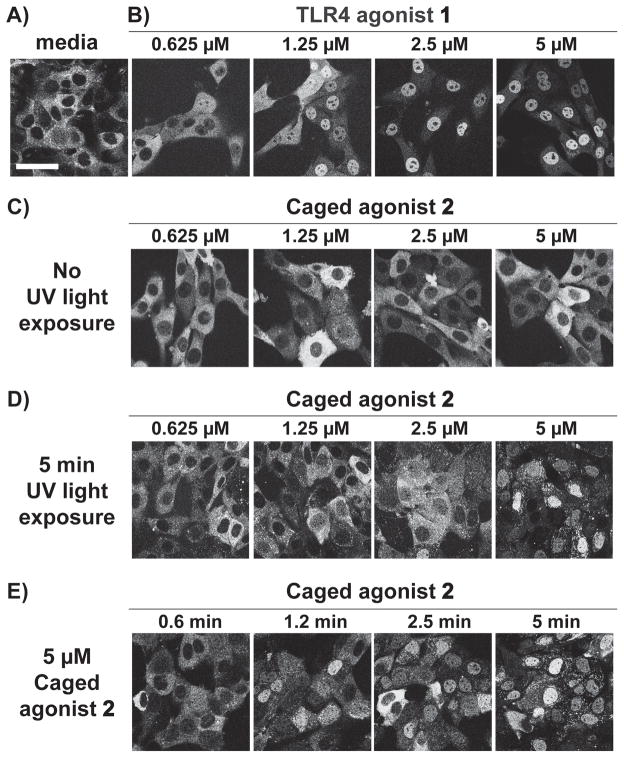
Activation of TLR4 via light was performed in a second reporter cell line - 3T3 fibroblasts expressing p65-DsRed. NF-κB activation was observed in real time via optical microscopy in a dose-dependent study using the caged agonist. Here, NF-κB activity is defined as the nuclear translocation of NF-κB as measured by the subunit of NF-κB, p65, that is fluorescently labeled - p65-DsRed.[30,31] This nuclear translocation was observed by confocal microscopy and quantified using ImageJ analysis (Supplemental Information). Fibroblasts were treated with TLR4 agonist 1 or caged agonist 2 (0.625–5.0 μM) at t=0 and images were recorded for 3 h (Figure S5). NF-κB translocation was observed in cells treated with 1 (Figure 3B). When stimulated with 1, the peak translocation of NF-κB occurs after 45 min (Figure S5–6). Translocation was not observed at any time point measured in cells treated with media only or the equivalent concentrations of caged agonist, 2, without UV light exposure (Figure 3C, Figure S6). The dose-dependent trend in activation seen with 1 was reestablished by treating cells with varying concentrations of 2 followed by 5 min UV light exposure (15 W, 365 nm, Figure 3D). To further confirm that activation was dependent on light, cells were treated with 2 at a fixed concentration and UV light exposure time was varied (0.6–5 min, Figure 3E). When cells are treated in this manner, the degree of translocation is observed to be a function of exposure time. In cells treated with 2 and exposed to UV light, the maximal translocation of p65-DsRed occured at 45 min, the same time as with treatment of 1.
Figure 3.
Light-controlled NF-κB activation in fluorescent NF-κB reporter cells. Confocal images of p65-DsRed fibroblasts 45 min after treatment with media only (A), TLR4 agonist 1 (B), caged agonist 2 (C), caged agonist with 5 min bulk UV light exposure (D), and 5 μM of caged agonist 2 exposed to UV light for times ranging from 0.6 to 5 min (E). Scale bar is equal to 50 μm. See Supporting Information for detailed experimental setup and image analysis methods for quantification of translocation.
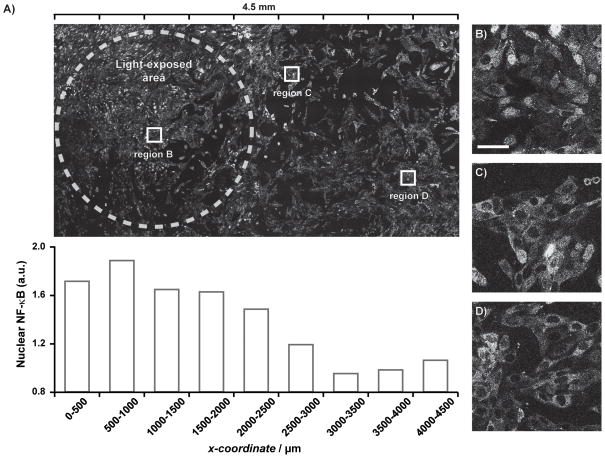
To date, our understanding of the immune system is based on bulk methods of activation. Recent work in our group has investigated immune responses of heterogeneous co-cultures and how activation of a cell subset impacts the bulk response.[32] With our light-controlled TLR4 agonist, we sought to address the minimum requirements for immune activation at the population level. We aimed to exert spatial control over immune activation by limiting agonist exposure to a subpopulation of cells using light (Figure 4). Fibroblasts expressing p65-DsRed were treated with 2 (10 μM) and spatial control was implemented by light exposure through a pinhole mask (3.1 mm2). Here, NF-κB translocation occurred in cells within the pinhole area (Figure 4A), and the degree to which activation occurs tapered as a function of distance from the pinhole (Figure 4C–D). We expected that cells adjacent to the light-exposed area (x-coordinate of 2000–2500 μm) would exhibit similar levels of NF-κB translocation because of rapid diffusion of the active agonist. The pinhole size used in this experiment was the minimum size that we found to elicit an immune response. While smaller regions of interest are selectable using this method or confocal microscopy, we did not observe activation with smaller holes. Potential reasons for this finding include lower effective concentrations of the agonist, or that fibroblast signaling inhibited cell activation in the smaller population. Ongoing research in our group focuses on using the techniques developed in this paper to afford controlled activation, down to the single cell level, for which these initial results are the first step.
Figure 4.
Spatial control of NF-κB activation in fluorescent NF-κB reporter cells. Confocal images of p65-DsRed fibroblasts 45 min after treatment with caged agonist 2 and 15 min UV light exposure. Light exposure was confined to a 3.1 mm2 pinhole (dashed white line). DsRed nuclear intensities over ranges in the x-direction of the image (A) was determined using ImageJ. Cells within the exposed pinhole (B) show high degrees of NF-κB translocation, while cells further from the pinhole (C and D) have less (scale bar is equal to 50 μm).
Here we show the synthesis of a photo-controlled TLR4 agonist and a method that controls spatial activation of innate immune cells. Protection of the critical indole nitrogen of pyrimido[5,4-b]indole with a photo-labile group reduced TLR activity to background levels. Upon exposure to UV light, compound 1 was regenerated, which then activated NF-κB signalling pathways via TLR4. We showed activation of innate immune cells, RAW macrophages, is mediated by UV light exposure of the caged agonist. Furthermore, we demonstrate for the first time the selective activation of a subpopulation of cells within a larger population by confining light exposure of the caged agonist through a pinhole. With this and similar tools, we plan to explore how immune activation propagates from an origin of inflammation, as well as how TLR synergies can be modulated both spatially and temporally. We aim to understand how TLR signalling contributes at different levels to both positive and deleterious immune responses.
Experimental Section
Synthesis
The TLR4 agonist, pyrimido[5,4-b]indole 1 was synthesized and purified as described previously.[11] The NVOC-caged agonist 2 was generated by deprotonating the indole amine of 1 (200 mg, 0.46 mmol) with NaH (60% dispersed in mineral oil, 100 mg, 2.5 mmol) in THF (2 mL), followed by addition of 6-nitroveratryl chloroformate (251 mg, 0.91 mmol) in THF (10 mL). The mixture was heated to reflux for 3 h. The reaction was quenched with water and the product was extracted with excess methylene chloride and purified by silica gel column chromatography to obtain 2 in 65.5% yield. Detailed methods on the preparation and characterization are available in the Supporting Information.
Cell culture
Detailed materials and methods are available in the Supporting Information.
NF-κB activation in RAW-Blue 264.7 macrophages
Cells were plated at 50,000 cells/well in black-walled 96-well plates (Nunc) in complete test media. Stock solutions of agonists were prepared in complete test media and sterile-filtered through a 0.2 μm filter immediately prior to addition to cell media. The agonists were added to the cell media at the final concentration indicated, with a total volume per well of 200 μL. For light-controlled experiments, cells were exposed to UV light immediately following addition of agonist. Optical sealing tape was affixed to the well plate and the light source was placed on top of the plate. Treated cells were incubated at 37 °C with 5% CO2 for 18 h. After the incubation period, supernatant was analyzed for SEAP expression using QUANTI-Blue detection medium according to the manufacturer’s protocol.
NF-κB activation in p65-DsRed fibroblasts
The p65-DsRed and H2B-GFP-expressing fibroblasts were a gift from the lab of Prof. Markus Covert. Cells were plated in coverslip-bottom 8-well plates (Thermo Sci.) at 5,000 cells/well in complete media and cultured for 48 h. One hour prior to imaging, media was exchanged for complete test media and the cells were equilibrated for 30 min at 37 °C with 5% CO2 prior to adding agonist and imaging. Cells were treated with agonist at t=0 and imaged for 3 h at 37 °C with 5% CO2. For light-controlled experiments, cells were exposed to UV light immediately following addition of agonist. The light source was placed underneath the coverslip wells. Following light exposure, cells were incubated at 37 °C with 5% CO2 until imaging.
NF-κB activation of subpopulations of fibroblasts was performed similarly. Cells were plated and prepared as before. Light masks were made from black PEEK film (0.25 mm thick), with circular pinholes (area = 3.1 mm2). The masks were aligned and affixed with tape to the bottom of the coverslip-bottom well plates. The plates were left undisturbed for 5 min following light exposure through the pinhole. Following light exposure, cells were incubated at 37 °C with 5% CO2 until imaging.
Supplementary Material
Acknowledgments
Funding was provided by NIH (DP2-AI112194), Cancer Center Support Grant (CA-62203), and the Hellman Family Foundation.
The authors would like to thank Adeela Syed of the Optical Biology Core at University of California, Irvine, for assistance in image acquisition, Keun Ah Ryu for help with chemical characterization, Du Nguyen for help with image analysis, and Troy Moore for help with manscript preparation.
Footnotes
Supporting information for this article is given via a link at the end of the document.
References
- 1.Stover AG, Correia JDS, Evans JT, Cluff CW, Elliot MW, Jeffery EW, Johnson DA, Lacy MJ, Baldridge JR, Probst P, et al. J Biol Chem. 2003;279:4440–4449. doi: 10.1074/jbc.M310760200. [DOI] [PubMed] [Google Scholar]
- 2.Mata-Haro V, Cekic C, Martin M, Chilton PM, Casella CR, Mitchell TC. Science. 2007;316:1628–1632. doi: 10.1126/science.1138963. [DOI] [PubMed] [Google Scholar]
- 3.Bryant CE, Spring DR, Gangloff M, Gay NJ. Nat Rev Microbiol. 2009 doi: 10.1038/nrmicro2266. [DOI] [PubMed] [Google Scholar]
- 4.Coler RN, Baldwin SL, Shaverdian N, Bertholet S, Reed SG, Raman VS, Lu X, DeVos J, Hancock K, Katz JM, et al. PLoS ONE. 2010;5:e13677. doi: 10.1371/journal.pone.0013677. [DOI] [PMC free article] [PubMed] [Google Scholar]
- 5.Coler RN, Bertholet S, Moutaftsi M, Guderian JA, Windish HP, Baldwin SL, Laughlin EM, Duthie MS, Fox CB, Carter D, et al. PLoS ONE. 2011;6:e16333. doi: 10.1371/journal.pone.0016333. [DOI] [PMC free article] [PubMed] [Google Scholar]
- 6.Needham BD, Carroll SM, Giles DK, Georgiou G, Whiteley M, Trent MS. Proc Natl Acad Sci U S A. 2013;110:1464–1469. doi: 10.1073/pnas.1218080110. [DOI] [PMC free article] [PubMed] [Google Scholar]
- 7.Shanmugam A, Rajoria S, George AL, Mittelman A, Suriano R, Tiwari RK. PLoS ONE. 2012;7:e30839. doi: 10.1371/journal.pone.0030839. [DOI] [PMC free article] [PubMed] [Google Scholar]
- 8.Ohashi K, Burkart V, Flohé S, Kolb H. J Immunol. 2000;164:558. doi: 10.4049/jimmunol.164.2.558. [DOI] [PubMed] [Google Scholar]
- 9.Asea A, Rehli M, Kabingu E, Boch JA, Baré O, Auron PE, Stevenson MA, Calderwood SK. J Biol Chem. 2002;277:15028–15034. doi: 10.1074/jbc.M200497200. [DOI] [PubMed] [Google Scholar]
- 10.Trompette A, Divanovic S, Visintin A, Blanchard C, Hegde RS, Madan R, Thorne PS, Wills-Karp M, Gioannini TL, Weiss JP, et al. Nature. 2008;457:585–588. doi: 10.1038/nature07548. [DOI] [PMC free article] [PubMed] [Google Scholar]
- 11.Chan M, Hayashi T, Mathewson RD, Nour A, Hayashi Y, Yao S, Tawatao RI, Crain B, Tsigelny IF, Kouznetsova VL, et al. J Med Chem. 2013;56:4206–4223. doi: 10.1021/jm301694x. [DOI] [PMC free article] [PubMed] [Google Scholar]
- 12.Nour A, Hayashi T, Chan M, Yao S, Tawatao RI, Crain B, Tsigelny IF, Kouznetsova VL, Ahmadiiveli A, Messer K, et al. Bioorg Med Chem Lett. 2014;24:4931–4938. doi: 10.1016/j.bmcl.2014.09.039. [DOI] [PMC free article] [PubMed] [Google Scholar]
- 13.Yan M, Peng J, Jabbar IA, Liu X, Filgueira L, Frazer IH, Thomas R. Immunol Cell Biol. 2005;83:83–91. doi: 10.1111/j.1440-1711.2004.01291.x. [DOI] [PubMed] [Google Scholar]
- 14.Hutchinson MR, Zhang Y, Shridhar M, Evans JH, Buchanan MM, Zhao TX, Slivka PF, Coats BD, Rezvani N, Wieseler J, et al. Brain Behav Immun. 2010;24:83–95. doi: 10.1016/j.bbi.2009.08.004. [DOI] [PMC free article] [PubMed] [Google Scholar]
- 15.Duez C, Gosset P, Tonnel AB. Eur J Dermatol. 2006;16:12–16. [PubMed] [Google Scholar]
- 16.O’Neill LAJ, Golenbock D, Bowie AG. Nat Rev Immunol. 2013;13:453–460. doi: 10.1038/nri3446. [DOI] [PubMed] [Google Scholar]
- 17.Mancini RJ, Stutts L, Ryu KA, Tom JK, Esser-Kahn AP. ACS Chem Biol. 2014;9:1075–1085. doi: 10.1021/cb500079s. [DOI] [PMC free article] [PubMed] [Google Scholar]
- 18.Sung MH, Li N, Lao Q, Gottschalk RA, Hager GL, Fraser IDC. Sci Signal. 2014;7:ra6–ra6. doi: 10.1126/scisignal.2004764. [DOI] [PMC free article] [PubMed] [Google Scholar]
- 19.Napolitani G, Rinaldi A, Bertoni F, Sallusto F, Lanzavecchia A. Nat Immunol. 2005;6:769–776. doi: 10.1038/ni1223. [DOI] [PMC free article] [PubMed] [Google Scholar]
- 20.Hemphill J, Chou C, Chin JW, Deiters A. J Am Chem Soc. 2013;135:13433–13439. doi: 10.1021/ja4051026. [DOI] [PMC free article] [PubMed] [Google Scholar]
- 21.Mancini RJ, Tom JK, Esser-Kahn AP. Angew Chem Int Ed Engl. 2014;53:189–192. doi: 10.1002/anie.201306551. [DOI] [PMC free article] [PubMed] [Google Scholar]
- 22.Govan JM, Young DD, Lively MO, Deiters A. Tetrahedron Lett. 2015 doi: 10.1016/j.tetlet.2015.01.165. [DOI] [PMC free article] [PubMed] [Google Scholar]
- 23.Banghart M, Borges K, Isacoff E, Trauner D, Kramer RH. Nat Neurosci. 2004;7:1381–1386. doi: 10.1038/nn1356. [DOI] [PMC free article] [PubMed] [Google Scholar]
- 24.Aravanis AM, Wang LP, Zhang F, Meltzer LA, Mogri MZ, Schneider MB, Deisseroth K. J Neural Eng. 2007;4:S143–S156. doi: 10.1088/1741-2560/4/3/S02. [DOI] [PubMed] [Google Scholar]
- 25.Adamantidis AR, Zhang F, Aravanis AM, Deisseroth K, de Lecea L. Nature. 2007;450:420–424. doi: 10.1038/nature06310. [DOI] [PMC free article] [PubMed] [Google Scholar]
- 26.Wyart C, Bene FD, Warp E, Scott EK, Trauner D, Baier H, Isacoff EY. Nature. 2009;461:407–410. doi: 10.1038/nature08323. [DOI] [PMC free article] [PubMed] [Google Scholar]
- 27.Sauers DJ, Temburni MK, Biggins JB, Ceo LM, Galileo DS, Koh JT. ACS Chem Biol. 2010;5:313–320. doi: 10.1021/cb9002305. [DOI] [PubMed] [Google Scholar]
- 28.Nguyen DP, Mahesh M, Elsässer SJ, Hancock SM, Uttamapinant C, Chin JW. J Am Chem Soc. 2014;136:2240–2243. doi: 10.1021/ja412191m. [DOI] [PMC free article] [PubMed] [Google Scholar]
- 29.Ryu KA, Stutts L, Tom JK, Mancini RJ, Esser-Kahn AP. J Am Chem Soc. 2014;136:10823–10825. doi: 10.1021/ja412314j. [DOI] [PMC free article] [PubMed] [Google Scholar]
- 30.Ashall L, Horton CA, Nelson DE, Paszek P, Harper CV, Sillitoe K, Ryan S, Spiller DG, Unitt JF, Broomhead DS, et al. Science. 2009;324:242–246. doi: 10.1126/science.1164860. [DOI] [PMC free article] [PubMed] [Google Scholar]
- 31.Tay S, Hughey JJ, Lee TK, Lipniacki T, Quake SR, Covert MW. Nature. 2010;466:267–271. doi: 10.1038/nature09145. [DOI] [PMC free article] [PubMed] [Google Scholar]
- 32.Mancini RJ, Stutts L, Moore T, Esser-Kahn AP. Angew Chem Int Ed. 2015;54:5962–5965. doi: 10.1002/anie.201500416. [DOI] [PMC free article] [PubMed] [Google Scholar]
Associated Data
This section collects any data citations, data availability statements, or supplementary materials included in this article.


