

Abstract
Background.
Because of the possible implications for intervention and thus successful aging, researchers have striven to determine whether the age changes in physical and cognitive functioning are coincident or does functioning in one domain change before, and possibly contribute to, functioning in the other.
Methods.
Bivariate dual change score models were applied to four cognitive factors and three motor functioning factors available from 813 adults who participated in the Swedish Adoption/Twin Study of Aging. Participants were aged 50–88 at the first of six waves of testing covering a 19-year follow-up period; 68% participated in at least three waves.
Results.
Model comparisons indicated dynamic coupling relationships between Balance and Fine Motor factors and the Speed cognitive factor. Decline in motor function precedes decline in performance on processing speed tasks, even though the motor function tasks were not timed. Results indicated possible bidirectional coupling between Fine Motor and Speed.
Conclusions.
Combined with other dual change score model analyses of cognition and physical function, a picture is beginning to emerge of the cascade of events that may lead to cognitive aging.
Key Words: Cognitive function, Motor function, Longitudinal, Aging, Temporal dynamics
Two of the primary concerns of older individuals are the physical changes and cognitive changes that occur with the aging process. Even though conceptions of successful aging have taken dozens of forms (1), most conceptualizations acknowledge multiple components of successful aging that include, but are not limited to, maintenance of physical and cognitive functioning. Not surprisingly, recent investigations of the physiological sources of physical and cognition aging find age changes in similar or shared central nervous system processes and structures (2,3), leading to the hypothesis of a “common cause” for physical and cognitive aging. Because of the possible implications for intervention and thus successful aging, researchers have striven to determine whether the age changes in physical and cognitive functioning are coincident or does functioning in one domain change before, and possibly contribute to, functioning in the other (4).
A recent meta-analysis examined the results of 40 longitudinal studies of the relationship between physical and cognitive functioning (5). Measures of physical function included gait speed, grip strength, chair stands, and composite measures. Cognitive measures included primarily mini-mental status, measures of fluid ability, and diagnostic categories. More of the studies included examined the impact of baseline physical function on change in cognitive function than the reverse relationship; a few examined correlations in rates of decline across domains. The authors concluded that there was some support for both directions of effect: baseline physical function did predict changes in cognitive function and baseline cognitive function did predict changes in physical function, although the latter relationship was only marginally significant. Changes in grip strength and gait speed were correlated with changes in fluid cognition. Subsequent longitudinal analyses have reported support for both unidirectional (physical function preceding changes in cognitive function) and bidirectional relationships between the domains (6,7). Based on their analysis, the authors of the meta-analysis recommended that future investigations of the physical functioning–cognition relationship should incorporate diverse measures in each domain and should attempt to dissect the issue of direction of effect (5). The current analysis attempted to address both of these concerns.
To address the question of cause and effect, it is necessary to evaluate the extent to which each component (motor functioning and cognitive function) predicts the other component over age using structural equation models that allow for dynamic interaction between longitudinal trajectories in both domains. The development of dual change score models (DCSMs) to characterize age changes has facilitated specification and testing of dynamic hypotheses about patterns of cognitive aging (8,9). These models assist with identification of leading indicators of cognitive change by measuring the extent to which changes in one variable influence subsequent changes in a second, related variable, and vice versa.
The purpose of this study was to apply DCSM to data from the Swedish Adoption/Twin Study of Aging (SATSA (10)) to examine the nature of the relationship between motor functioning and cognitive aging. To address another concern raised by the meta-analysis (5), we incorporated multiple measures of both cognition and motor functioning. The SATSA cognitive battery includes measures of normative cognitive function in four domains: verbal ability, spatial ability, memory, and processing speed. Similarly, performance on 20 measures of motor functioning is observed. Other studies have used multiple measures of motor function similar to the ones used here (11), but they are typically incorporated into a single composite. In the current study, three distinct composites of motor function were used: Balance, Fine Motor Movement, and Flexibility. Finally, using timed measures of functioning on both sides of the relationship (eg, gait speed and perceptual speed) may introduce a confound into the motor functioning–cognition relationship. In the current analysis, we use a nurse assessment of quality of physical performance, rather than the time required to complete the tasks. Thus, any relationship identified here between physical functioning and cognition results from some shared fundamental aging process, not simply the universally acknowledged behavioral slowing that occurs with age.
Methods
Participants
In brief, the SATSA sample is a subset of twins from the population-based Swedish Twin Registry (10). In-person testing (IPT1) took place in a location convenient to the participants, such as district nurses’ offices, health care schools, and long-term care clinics. Testing was completed during a single 4-hour visit. The second (IPT2) and third (IPT3) waves of IPT occurred at 3-year intervals. IPT did not occur during wave 4; IPT5 occurred after a 7-year interval (10). Regular 3-year testing continued after IPT5; the total time span from IPT1 to IPT7 was 19 years.
Presence of dementia was determined by clinical diagnosis based on current diagnostic criteria (12) and participants who developed dementia at any point during their participation were not included in the current analyses. Of the total SATSA sample of 859, 813 non-demented individuals (95%) had cognitive and motor function data available from at least one testing occasion. Of those participants, 68% have data at three or more time points and 12% participated in all six waves. Mean interval between assessments was 4.06 years (SD = 1.95), but median interval was 3.09 years and 75% of the measurement intervals were less than 4 years. Sixty percent of participants were women. Table 1 presents descriptive information at each wave.
Table 1.
Descriptive Statistics for the Raw Motor Factors: Mean (SD)
| Wave | N | Age | Balance | Fine Motor | Flexibility |
|---|---|---|---|---|---|
| IPT1 | 645 | 65.6 (8.5) | 10.8 (2.2) | 8.6 (1.5) | 2.0 (0.21) |
| IPT2 | 593 | 66.0 (9.0) | 10.7 (2.0) | 8.6 (1.2) | 2.2 (0.52) |
| IPT3 | 569 | 68.8 (9.2) | 11.0 (2.1) | 8.7 (1.3) | 2.3 (0.58) |
| IPT5 | 541 | 70.6 (10.0) | 11.7 (3.7) | 9.0 (2.5) | 2.3 (0.77) |
| IPT6 | 445 | 72.2 (9.3) | 11.8 (3.3) | 9.3 (2.2) | 2.3 (0.71) |
| IPT7 | 377 | 74.3 (9.0) | 12.3 (4.2) | 9.8 (3.4) | 2.5 (0.87) |
For purposes of the DCSM, data were divided into 13 three-year age intervals from age 50 to 85. Using the 3-year age interval maximized the age range available for inclusion in the analyses, while ensuring that each wave of participation falls into a different age segment. However, the data were too sparse after age 86 to support statistical modeling; therefore, only data up to age 86 were included in these analyses.
Measures
Cognitive Performance
Four cognitive domains are represented in the SATSA cognitive test battery (13,14). Verbal abilities are tapped by tests of Information (from the Wechsler Adult Intelligence Scale-Revised [WAIS-R (15)]), Synonyms, and Analogies. Block Design (WAIS-R) and Card Rotations assess spatial abilities. Memory tests include Digit Span (WAIS-R) and Picture Memory. Symbol Digit and Figure Identification measure processing speed. For both measures of processing speed, participants reported an oral response that was recorded by the interviewer, thus no manual dexterity was required. Reliabilities for the cognitive measures range from .82 to .96 (14). Principal components analysis was used to construct latent factors from the individual tests within each domain: verbal, spatial, memory, and speed. Factor loadings ranged from .79 to .92. Previous comparisons of factor structure between cohorts and across testing occasions indicate that the factor structure does not vary systematically across age or time (16). Standardizing the cognitive measures relative to the respective means and variances at IPT1 created an invariant definition of factors at each testing occasion. Then loadings from the factor analyses conducted at IPT1 were used to construct the verbal, spatial, memory, and speed factors. All factor scores were sex-corrected and transformed to T-scores.
Motor Functioning
Twenty-four measures of motor functioning were collected at each IPT. Analyses indicated that nurse ratings of successful performance (1 = no difficulty, 2 = some difficulty, 3 = impossible) were more sensitive than performance time to subtle changes with age (M. Ernsth-Bravell, PhD, et al., unpublished data). In other words, timed performance of young-old adults on these measures did not vary extensively; in contrast, qualitative ratings demonstrated more variance across the entire age range included in these analyses. Data reduction for the motor functioning measures has been described previously (M. Ernsth-Bravell et al., unpublished data). In brief, 20 motor functioning measures were used to generate three factors with consistent factor loadings across IPT and age. The remaining four measures did not load consistently on any factor. The Flexibility factor included two items: touch left earlobe with right hand behind the head, and vice versa. The Fine Motor Movement factor included eight measures of motor functioning: pour water from a jug into a glass, pour water from one hand to the other (both dominant and non dominant hands), insert key into lock and turn, insert electrical plug into socket, screw in a light bulb, put coins in a coin slot, and dial the numbers 1 through 9 on a rotary phone. The Balance factor included 10 measures of motor functioning and can also be considered a measure of gross motor function: walk and turn 3 m, single chair stand, five chair stands, standing balance with feet side-by-side for up to 10 seconds, standing balance with feet together and arms extended for up to 10 seconds, lift a glass, lift a 1-kg packet, pick up a pen from the floor from a standing position, touch right fingers to left toes while seated (and vice versa).
Descriptive statistics for the three motor factors are presented in Table 1; for the raw data, higher scores indicate higher levels of disability. Minimum and maximum possible raw scores on the three factors were 2 and 6 (Flexibility), 8 and 24 (Fine Motor), and 10 and 30 (Balance). Most adults perform fairly well on tasks of functional ability in young-old age; therefore, the standard deviations for the three factors are quite small at IPT1 and increase markedly in later IPTs. Because of this apparent skew in the data for the motor factors, and to support bivariate model fitting with the cognitive factors, the motor factors were rank-normalized, sex-corrected, reverse-scored, and transformed to T-scores (17). Thus, for the DCSM results, higher scores on the adjusted motor factors indicated better functioning. Correlations among the transformed motor factors and between the motor factors and cognitive factors are reported in Table 2. Correlations among the motor factors were significant but modest, supporting the idea that each factor taps a different aspect of motor functioning. Correlations between the motor factors and the cognitive factors were significant at the .01 level, with the exception of Flexibility, which correlated at most 0.11 with Speed. Therefore, these analyses focused on the relationships among the cognitive factors and only two of the motor factors: Balance and Fine Motor.
Table 2.
Correlations Among Transformed Cognitive and Motor Factors
| Balance | Fine Motor | Flexibility | |
|---|---|---|---|
| Motor factors | |||
| Fine Motor | .29* | ||
| Flexibility | .25* | .17* | |
| Cognitive factors | |||
| Verbal | .19* | .28* | .07 |
| Spatial | .20* | .28* | .02 |
| Memory | .17* | .26* | .08 |
| Speed | .27* | .41* | .11* |
Notes: Motor factors have been reverse-scored so high scores denote better performance.
*p < .01.
Statistical Method
DCSM was used to examine the bivariate relationship between cognitive and motor functioning. Extensive discussions of the model are available (8,9), as well as comparisons of DCSM with latent growth curve models (18,19). As presented in Figure 1, the model is based on latent difference scores that create a growth curve based on change from one age to another age (Δy), which is modeled as a function of both constant change (α) that accumulates over time in an additive fashion and proportional change (β) based on the previous score. Typically, α is set to 1 and the parameter β differs from 0 to the extent that the longitudinal change is nonlinear. The bivariate DCSM allows for a coupling mechanism (γ) where change in trait X depends on the previous value of Y, and vice versa.
Figure 1.
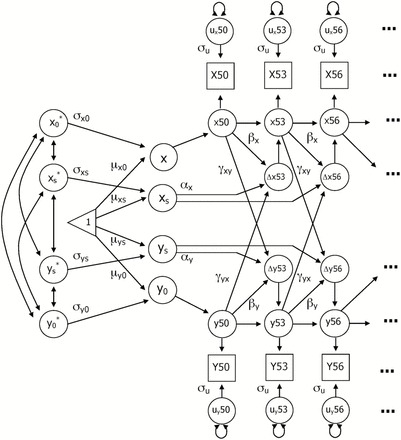
Bivariate dual change score model: Y 0 represents the intercept of the trajectory and Y s represents the linear slope; Y 0* and Y s * represent standardized intercept and slope. Mean (μ) and standard deviation (σ) are estimated for each intercept and slope. Y50 represents observed performance on measure Y at age 50, with y50 indicating the latent true score and u y50 signifying error. Three-year age segments from Y50 through Y86 were included in the model. Error variance (σu) is assumed to be constant at each age. Change in performance (Δy53) is a function of constant change (α), proportional change (β), and a coupling mechanism (γ) where change in trait X depends on the previous value of Y, and vice versa.
With the DCSM, it is possible to evaluate hypotheses about temporal order of changes in variables through restrictions on model parameters, while remaining agnostic as to underlying causes of the temporal relationship. Six alternative models can be addressed. First the relationship between the two variables may be bidirectional, such that X affects changes in Y and Y affects changes in X (ie, both γyx and γyx are nonzero). Second, a model including no dynamic coupling among the variables was tested (γxy = γyx = 0). If Model 2 results in a significant reduction in fit, then coupling of some nature is evident and additional models are tested. In subsequent models, the dynamic relationship in one direction only is tested (γyx = 0 or γxy = 0) and the cross-variable dynamic effects are equated (γxy = γyx). Because previous analyses have indicated different rates of decline in both physical and cognitive functioning in early and late old age (17,20), the final model examined whether estimating separate coupling estimates before and after the age 71 interval improved model fit.
Univariate and bivariate DCSM were fit to the data using Mplus Version 7.3 (21). Model fit was indicated by the log-likelihood (−2LL) and the root mean square error of approximation (RMSEA (22)). Adequate fit of the full model to the data is indicated when the RMSEA is less than or equal to 0.1 and an RMSEA of .05 or less indicates “close” fit. Nested models were compared using the difference chi-square test obtained by taking the difference between the obtained model fits (−2LL). Given the number of model comparisons conducted, the significance level was set at .01 to reduce the likelihood of type I error. The current analyses focused on individual performance by including a correction for twin pairs in the modeling.
Results
Univariate Analyses
In the first step of the analysis, the univariate DCSM was fit separately to the four cognitive factors and two motor factors. Two models were fit to the data for each measure: a full model and a reduced model in which β is set to 0. Parameter estimates and standard errors are presented in Supplementary Table 1, along with fit statistics. The fit statistics demonstrate that the univariate DCSM provides at least an adequate fit to the data for all six measures (RMSEA ≤ .05). Removing β from the model resulted in a significant reduction in model fit for all factors, indicating accelerating decline with age. Change trajectories estimated from the univariate DCSM are presented in Figure 2.
Figure 2.
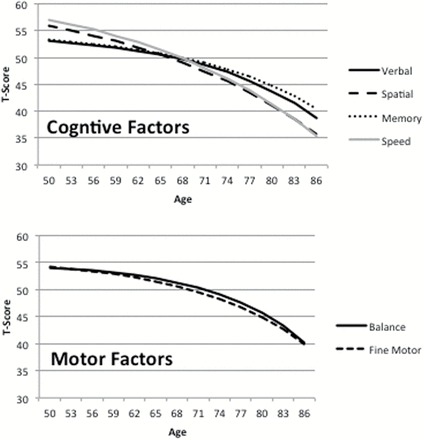
Change trajectories estimated by the univariate dual change score model to the four cognitive factors and two motor factors.
Bivariate Analyses
Model fit statistics for testing the five bivariate DCSM models are presented in Table 3. Of the eight bivariate relationships tested, comparison of Models 1 and 2 indicated no coupling of longitudinal trajectories for six of them. For the remaining two, additional models were tested to determine the nature of the bivariate relationship.
Table 3.
Model Fit Statistics (−2LL/df) for the Five Comparison Models Testing the Bivariate Relationships Between Measures of Cognitive Ability and Motor Function
| Verbal | Spatial | Memory | Speed | |||||
|---|---|---|---|---|---|---|---|---|
| Models | Balance | Fine Motor | Balance | Fine Motor | Balance | Fine Motor | Balance | Fine Motor |
| 1. Full model | −18,391/21 | −18,668/21 | −18,661/21 | −18,936/21 | −19,594/21 | −19,856/21 | −19,151/21 | −19,429/21 |
| 2. No coupling | −18,391/19 | −18,671/19 | −18,662/19 | −18,940/19 | −19,594/19 | −19,856/19 | −19,162/19a | −19,441/19a |
| 3. Cog→motor = 0 | — | — | — | — | — | — | −19,151/20 | −19,431/20 |
| 4. Motor→cog = 0 | — | — | — | — | — | — | −19,162/20a | −19,439/20a |
| 5. Couplings equal | — | — | — | — | — | — | −19,155/20 | −19,429/20 |
| 6. Couplings 50–71 and 74–86 | — | — | — | — | — | — | −19,149/23 | −19,428/23 |
aChange in model fit vs the full model is significant at p < .01.
For the relationship of Speed with both Balance and Fine Motor, setting the γcog→motor parameter to zero (Model 3) had no effect on model fit; whereas, setting the γmotor→cog parameter to zero (Model 4) resulted in a significant loss of fit. In Model 5, equating the coupling parameters for Balance and Speed resulted in a moderately significant change in model fit (Δfit = 4, Δdf = 1, p < .05). In contrast, it was possible to equate the two coupling parameters for Fine Motor and Speed without significant change in model fit (Δfit = 0, Δdf = 1, ns). Finally, estimating separate coupling parameters before and after age 71 (Model 6) did not significantly change model fit; thus, the more parsimonious model was selected. Taken together, these results indicate that motor function precedes subsequent changes in the Speed factor.
Parameters estimates and standard errors from the full bivariate model (Model 1) are presented in Supplementary Table 2. The RMSEA for both full bivariate models was less than .035. In the full model, the estimate of γBalance→Speed was −.05. In contrast, the estimate of γSpeed→Balance (.01) did not differ significantly from zero, thus indicating no effect of Speed on the rate of decline in the Balance factor. This relationship is illustrated in Figure 3: the decline trajectory for the Balance factor is nearly identical both with (Model 1) and without coupling (Model 2). The decline trajectories for Speed differ markedly, depending on whether coupling is included in the model or not. The impact of even a relatively small coupling factor can accumulate over age to result in a significant difference in trajectories of decline.
Figure 3.
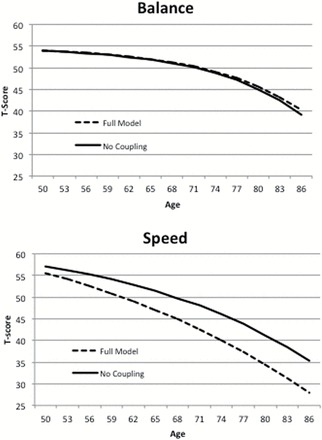
Change trajectories estimated for the Balance motor factor and the Speed cognitive factor by the bivariate dual change score model, with and without coupling parameters.
Results of model fitting presented in Table 3 suggest the same pattern for Speed and Fine Motor; however, there is one important difference. Although the γmotor→cog parameter could be dropped from the model with reduction in model fit, we could also equate to two coupling parameters without change in model fit. Parameter estimates indicate that the coupling parameters are very similar in magnitude: γmotor→cog is −.05 and γcog→motor is −.04. Only the first achieves significance because of the smaller standard error estimate (.01 and .02, respectively). Longitudinal trajectories for both factors with and without coupling presented in Figure 4 demonstrate that both measures are affected to some degree by coupling with the other.
Figure 4.
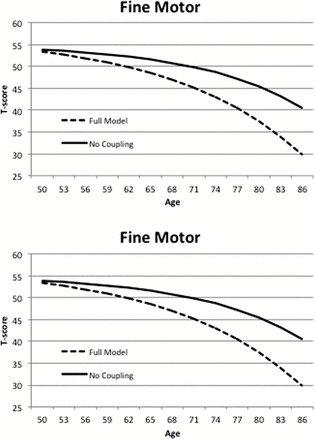
Change trajectories estimated for the Fine Motor factor and the Speed cognitive factor by the bivariate dual change score model, with and without coupling parameters.
Discussion
The goal of the current analysis was to examine the direction of effect of the relationship between motor functioning and cognitive aging using bivariate DCSMs. Multiple measures of normative functioning in each domain were assessed. Results indicate that decline in some cognitive functions are associated with decline in components of physical function, and the relationship appears to be directional, with changes in Balance and Fine Motor factors leading to subsequent changes in the Speed factor. Interestingly, results suggest a possible bidirectional relationship between Fine Motor and Speed in which changes in one variable precede and cause subsequent changes in the other variables, and vice versa. Similarly, previous studies tend report the strongest relationships between physical functioning and cognitive measures that tap processing speed (5,11,23). As a correlational approach, DCSM cannot prove causation; however, the temporal dynamics identified here are consistent with a directional hypothesis that changes in physical functioning precede subsequent changes in processing speed.
Investigations of the physiological mechanisms that underlie the association between cognitive and physical function have focused on measures of balance and gait speed, fewer studies have examined other domains of motor functioning such as fine motor movement. Results indicate that both gray-matter and white-matter integrity are associated with processing speed as well as balance and gait (2,24,25). Other candidate mechanisms include degeneration of neurotransmitter systems, such as the dopaminergic system, which has been implicated in age declines in both gross and fine motor movement, as well as cognitive functioning (26). Overall, motor functioning triggers involvement of more widespread brain regions in older adults than younger adults, setting the stage for greater shared physiological mechanisms for physical and cognitive decline in older adults (26).
Although DCSM is considered to have many important advantages over other methods for addressing hypotheses about dynamic relationships among variables (27), the method is also limited by many of the statistical assumptions common to structural equation models. The data are assumed to be missing at random, the sample is assumed to be relatively homogeneous, and structural relations based on interindividual variance and on intraindividual variance are assumed to be equivalent (19). Previous investigations of SATSA data suggest that participants who continue in the study are significantly different from those who drop out (eg, personality ratings (28), cognitive ability (29)). Of most importance in age-based DCSM is demonstrating that the pattern of missing data does not differ for older and younger participants. Comparisons of missingness indicate that the patterns of participation are fairly similar, although older participants are somewhat more likely (71%) than younger participants (64%) to participate in at least three time points because younger adults were added to SATSA at each wave up to IPT5.
The use of qualitative assessment of motor functioning instead of timed assessment could be considered both a strength and a weakness of the current analyses. Qualitative assessment of performance by trained nurses produced more nuanced assessment of physical performance: for example, a stopwatch does not capture the “wobbles” that an observer can see during a balance task. The qualitative assessment resulted in sufficient variability to support factor analysis (M. Ernsth-Bravell et al., unpublished data) and structural modeling across the entire age range included in the current analyses. Additionally, it removes the possible confound inherent when both cognitive and physical measures are timed. However, regardless of how well trained the nurse-interviewers were and how little staff turnover occurred during SATSA (12 interviewers over 19 years), observer ratings are unlikely to be as reliable as timed measures of performance.
The overall goal of investigations into cognitive aging is to begin to understand the cascade of effects that result in normative declines in cognitive functioning; chiefly to identify the optimum focus and timing of possible interventions to promote successful aging (30,31). The application of bivariate DCSM to the physical functioning–cognition relationship suggests that changes in physical function precede subsequent changes in processing speed, for the most part. Other applications of DCSM in the SATSA dataset have demonstrated that changes in lung function are also a leading cause of changes in processing speed (32), and changes in processing speed, in turn, are a leading cause of changes in other cognitive domains (33). Thus, a picture is beginning to emerge of the chain of events that may lead to cognitive aging. The order of events still remains to be elucidated, particularly the possible relationship between lung function and physical functioning vis-à-vis processing speed. It is possible that changes in lung function contribute to changes in physical functioning, which impact processing speed and subsequently other cognitive domains; however, other timing of events is also feasible and the impact of potential moderator variables should be examined.
Supplementary Material
Supplementary material can be found at: http://biomedgerontology.oxfordjournals.org/
Funding
The Swedish Adoption/Twin Study of Aging (SATSA) is supported by R01 AG04563, R01 AG10175, the Swedish Council For Working Life and Social Research (FAS) (97:0147:1B, 2009-0795, 2013-2292), and Swedish Research Council (825-2007-7460, 825-2009-6141, 521-2013-8689).
Supplementary Material
References
- 1. Martin P, Kelly N, Kahana B, et al. Defining successful aging: a tangible or elusive concept? Gerontologist. 2015;55:14–25. doi:10.1093/geront/gnu044 [DOI] [PMC free article] [PubMed] [Google Scholar]
- 2. Nadkarni NK, Nunley KA, Aizenstein H, et al. ; Health ABC Study. Association between cerebellar gray matter volumes, gait speed, and information-processing ability in older adults enrolled in the Health ABC study. J Gerontol A Biol Sci Med Sci. 2014;69:996–1003. doi:10.1093/gerona/glt151 [DOI] [PMC free article] [PubMed] [Google Scholar]
- 3. Rosso AL, Studenski SA, Chen WG, et al. Aging, the central nervous system, and mobility. J Gerontol A Biol Sci Med Sci. 2013;68:1379–1386. doi:10.1093/gerona/glt089 [DOI] [PMC free article] [PubMed] [Google Scholar]
- 4. Sternäng O, Reynolds CA, Finkel D, Ernsth-Bravell M, Pedersen NL, Dahl AK. Grip strength and cognitive abilities: associations in old age. J Gerontol Psychol Sci. In press. [DOI] [PMC free article] [PubMed] [Google Scholar]
- 5. Clouston SA, Brewster P, Kuh D, et al. The dynamic relationship between physical function and cognition in longitudinal aging cohorts. Epidemiol Rev. 2013;35:33–50. doi:10.1093/epirev/mxs004 [DOI] [PMC free article] [PubMed] [Google Scholar]
- 6. Krall JR, Carlson MC, Fried LP, Xue QL. Examining the dynamic, bidirectional associations between cognitive and physical functioning in older adults. Am J Epidemiol. 2014;180:838–846. doi:10.1093/aje/kwu198 [DOI] [PMC free article] [PubMed] [Google Scholar]
- 7. Mielke MM, Roberts RO, Savica R, et al. Assessing the temporal relationship between cognition and gait: slow gait predicts cognitive decline in the Mayo Clinic Study of Aging. J Gerontol A Biol Sci Med Sci. 2013;68:929–937. doi:10.1093/gerona/gls256 [DOI] [PMC free article] [PubMed] [Google Scholar]
- 8. McArdle JJ, Hamagami F, Meredith W, Bradway KP. 2000. Modeling dynamic hypotheses of Gf-Gc theory using longitudinal life-span data. Lear Individ Diff 12:53–79. doi:10.1016/S1041-6080(00)00036-4 [Google Scholar]
- 9. McArdle JJ. A latent difference score approach to longitudinal dynamic structural analyses. In: Cudeck R, duToit S, Sorbom D, eds. Structural Equation Modeling: Present and Future. Lincolnwood, IL: Scientific Software International; 2001:342–380. [Google Scholar]
- 10. Finkel D, Pedersen NL. 2004. Processing speed and longitudinal trajectories of change for cognitive abilities: The Swedish Adoption/Twin Study of Aging. Aging Neuropsychol Cognition 11:325–345. doi:10.1080/13825580490511152 [Google Scholar]
- 11. Desjardins-Crépeau L, Berryman N, Vu TT, et al. Physical functioning is associated with processing speed and executive functions in community-dwelling older adults. J Gerontol B Psychol Sci Soc Sci. 2014;69:837–844. doi:10.1093/geronb/gbu036 [DOI] [PubMed] [Google Scholar]
- 12. Gatz M, Pedersen NL, Berg S, et al. Heritability for Alzheimer’s disease: the study of dementia in Swedish twins. J Gerontol A Biol Sci Med Sci. 1997;52:M117–M125. doi:10.1093/gerona/52A.2.M117 [DOI] [PubMed] [Google Scholar]
- 13. Nesselroade JR, Pedersen NL, McClearn GE, Plomin R, Bergeman CS. Factorial and criterion validities of telephone-assessed cognitive ability measures. Age and gender comparisons in adult twins. Res Aging. 1988;10:220–234. doi:10.1177/0164027588102004 [DOI] [PubMed] [Google Scholar]
- 14. Pedersen NL, Plomin R, Nesselroade JR, McClearn GE. 1992. Quantitative genetic analysis of cognitive abilities during the second half of the lifespan. Psychol Sci. 3:346–353. doi:10.1111/j.1467-9280.1992.tb00045.x [Google Scholar]
- 15. Wechsler D. The Wechsler Adult Intelligence Scale-Revised (Manual). New York: Psychological Corporation; 1981. [Google Scholar]
- 16. Finkel D, Reynolds CA, McArdle JJ, Pedersen NL. The longitudinal relationship between processing speed and cognitive ability: genetic and environmental influences. Behav Genet. 2005;35:535–549. [DOI] [PubMed] [Google Scholar]
- 17. Finkel D, Ernsth-Bravell M, Pedersen NL. 2014. Sex differences in genetic and environmental influences on longitudinal change in functional ability in late adulthood. J Gerontol Psychol Sci. doi:10.1093/geronb/gbt134 [DOI] [PMC free article] [PubMed] [Google Scholar]
- 18. Ghisletta P, de Ribaupierre A. A dynamic investigation of cognitive dedifferentiation with control for retest: evidence from the Swiss Interdisciplinary Longitudinal Study on the Oldest Old. Psychol Aging. 2005;20:671–682. doi:10.1037/0882-7974.20.4.671 [DOI] [PubMed] [Google Scholar]
- 19. Lövdén M, Ghisletta P, Lindenberger U. Social participation attenuates decline in perceptual speed in old and very old age. Psychol Aging. 2005;20:423–434. doi:10.1037/0882-7974.20.3.423 [DOI] [PubMed] [Google Scholar]
- 20. Finkel D, Reynolds CA, McArdle JJ, Gatz M, Pedersen NL. Latent growth curve analyses of accelerating decline in cognitive abilities in late adulthood. Dev Psychol. 2003;39:535–550. doi:10.1037/0012-1649.39.3.535 [DOI] [PubMed] [Google Scholar]
- 21. Muthén LK, Muthén BO. Mplus User’s Guide. 7th ed. Los Angeles, CA: Muthén & Muthén; 2012. –2014. [Google Scholar]
- 22. Browne M, Cudeck R. Alternative ways of assessing model fit. In: Bollen K, Long S, eds. Testing Structural Equation Models. Beverly Hills, CA: Sage; 1993:136–162. [Google Scholar]
- 23. Welmer AK, Rizzuto D, Qiu C, Caracciolo B, Laukka EJ. Walking speed, processing speed, and dementia: a population-based longitudinal study. J Gerontol A Biol Sci Med Sci. 2014;69:1503–1510. doi:10.1093/gerona/glu047 [DOI] [PubMed] [Google Scholar]
- 24. Penke L, Muñoz Maniega S, Murray C, et al. A general factor of brain white matter integrity predicts information processing speed in healthy older people. J Neurosci. 2010;30:7569–7574. doi:10.1523/JNEUROSCI.1553-10.2010 [DOI] [PMC free article] [PubMed] [Google Scholar]
- 25. Starr JM, Leaper SA, Murray AD, et al. Brain white matter lesions detected by magnetic resonance [correction of resonance] imaging are associated with balance and gait speed. J Neurol Neurosurg Psychiatry. 2003;74:94–98. doi:10.1136/jnnp.74.1.94 [DOI] [PMC free article] [PubMed] [Google Scholar]
- 26. Seidler RD, Bernard JA, Burutolu TB, et al. Motor control and aging: links to age-related brain structural, functional, and biochemical effects. Neurosci Biobehav Rev. 2010;34:721–733. doi:10.1016/j.neubiorev.2009.10.005 [DOI] [PMC free article] [PubMed] [Google Scholar]
- 27. Ghisletta P, Lindenberger U. Age-based structural dynamics between perceptual speed and knowledge in the Berlin Aging Study: direct evidence for ability dedifferentiation in old age. Psychol Aging. 2003;18:696–713. doi:10.1037/0882-7974.18.4.696 [DOI] [PubMed] [Google Scholar]
- 28. Pedersen NL, Reynolds CA. 1998. Stability and change in adult personality: genetic and environmental components. Eur J Personality 12:365–386. doi:10.1002/(SICI)1099-0984 [Google Scholar]
- 29. Dominicus A, Palmgren J, Pedersen NL. Bias in variance components due to nonresponse in twin studies. Twin Res Hum Genet. 2006;9:185–193. doi:10.1375/twin.9.2.185 [DOI] [PubMed] [Google Scholar]
- 30. Sörman DE, Sundström A, Rönnlund M, Adolfsson R, Nilsson LG. Leisure activity in old age and risk of dementia: a 15-year prospective study. J Gerontol B Psychol Sci Soc Sci. 2014;69:493–501. doi:10.1093/geronb/gbt056 [DOI] [PubMed] [Google Scholar]
- 31. Rahe J, Petrelli A, Kaesberg S, Fink GR, Kessler J, Kalbe E. Effects of cognitive training with additional physical activity compared to pure cognitive training in healthy older adults. Clin Interv Aging. 2015;10:297–310. doi:10.2147/CIA.S74071 [DOI] [PMC free article] [PubMed] [Google Scholar]
- 32. Emery CF, Finkel D, Pedersen NL. Pulmonary function as a cause of cognitive aging. Psychol Sci. 2012;23:1024–1032. doi:10.1177/0956797612439422 [DOI] [PMC free article] [PubMed] [Google Scholar]
- 33. Finkel D, Reynolds CA, McArdle JJ, Pedersen NL. Age changes in processing speed as a leading indicator of cognitive aging. Psychol Aging. 2007;22:558–568. doi:10.1037/0882-7974.22.3.558 [DOI] [PubMed] [Google Scholar]
Associated Data
This section collects any data citations, data availability statements, or supplementary materials included in this article.