Abstract
The characterization of marker components in botanical materials is a challenging task and the increased consumption of botanicals and dietary supplements demands a greater understanding of the associated health benefits and risks. In order to successfully acquire and compare clinical results and correlate health trends, accurate, precise, and validated methods of analysis must be developed. Presented here is the development of a quantitative method for the determination of soy isoflavones (daidzin, glycitin, genistin, daidzein, and genistein) using liquid chromatography-particle beam/electron ionization mass spectrometry (LC-PB/EIMS). An internal standard (IS) approach for quantitation using 7-hydroxy-4-chromone as the IS compound was employed, with response factors for each individual isoflavone obtained from calibrant solutions. The results from this method were compared with the certified and reference values for NIST SRM 3238 Soy-Containing Solid Oral Dosage Form to demonstrate that the method was in control. Results obtained using LC-PB/EIMS were consistent with the NIST certified or reference values and their uncertainties for all five isoflavones, demonstrating that the LC-PB/EIMS approach is both accurate and precise when used for the determination of the target isoflavones in soy-containing dietary supplement finished products, while simultaneously providing structural information.
Keywords: Isoflavones, soy, particle beam, mass spectrometry, SRM 3238
Introduction
Soy has been a regular part of the diet in many countries for centuries, and as a result, soybeans and soy-based products are among the most studied foods for their potential health benefits. Epidemiologic studies over the last decade have suggested that soy-containing foods and supplements offer protective effects against a number of chronic diseases, including heart disease, breast cancer, and endometrial cancer (1–5). Isoflavones, the naturally occurring phytoestrogen components of soy, have gained considerable attention for their potential role in reducing risk factors for these diseases (2, 3). This interest, in turn, has led to more commercially available dietary supplements and functional foods containing isoflavones (1, 2, 6). Not coincidently, the use of dietary supplements continues to increase as the public becomes more concerned about lifestyle and health. The 2013 HerbalGram Herb Market Report released by the American Botanical Council estimated the total retail sales of herbal and botanical dietary supplements in the United States at 6 billion USD, which is an increase of an estimated 7.9 % from the previous year and the highest observed growth percentage since the late 1990s (7). Isoflavone supplement total sales were 8.7 million USD in 2013, ranking 21st of the top-selling herbal dietary supplements.
The considerable level of herbal supplement use has brought increased awareness for consumer safety and regulations on supplement products. In 1994, the Dietary Supplement Health and Education Act (DSHEA) defined and described in detail terminology concerning dietary supplements. Included were regulations concerning the identity, purity, and biological function of the active ingredients and accurate presentation on the labels of supplement products. Additional complications exist as there may be variations in the chemical content of similar botanicals due to differences in growth locations, seasons, production years, and other environmental conditions, making it nearly impossible to have a single chemical-content fingerprint matched to every product. In order to achieve sufficient accuracy in herbal product analyses, the availability of matrix-matched materials for validation of measurements is essential. The Chemical Sciences Division of the National Institute of Standards and Technology (NIST, Gaithersburg, MD), in collaboration with the Office of Dietary Supplements (ODS) at the National Institutes of Health (NIH), has developed dietary supplement Standard Reference Materials (SRMs) with certified values reported for specific analytes across various representative matrices (8). These materials are used to assess the accuracy and precision of analytical methods used by the manufacturers to determine the content of their products. The SRMs are characterized using multiple, orthogonal analytical methods, often in different laboratories, to evaluate sources of measurement bias and establish certified values. NIST has recently developed a suite of soy-based SRMs with certified and reference values for isoflavones, including soy flour, soy protein isolate, soy protein concentrate, and a soy-containing solid oral dosage form.
The analysis of botanical materials requires extensive sample pretreatment steps to achieve complete extraction of the analytes of interest, and sample pretreatment can lead to sample degradation, contamination, and loss. An appropriate extraction procedure should isolate all analytes of interest from the sample matrix in the smallest volume of solvent compatible with subsequent analysis techniques (9). Maintaining the original chemical profile is a consideration, meaning that all the target compounds are detected in the same chemical/structural form as present in the original botanical material. Isoflavones in particular are sensitive to UV photodegradation, high temperatures, and pH extremes, which need to be taken into account when choosing an extraction method, paired with adequate storage conditions. In the case of isoflavones, the chemically similar compounds must be separated prior to spectrometric detection. Methods providing high information content (i.e., MS vs absorbance detection) help to ensure selective determinations.
A variety of approaches have been reported for the extraction of isoflavones from soy bean matrices that utilize soaking, physical agitation, sonication, or maceration with various solvents (10–13). More recently, extraction procedures such as pressurized liquid extraction (PLE) (14, 15), supercritical fluid extraction (SFE) (16–18), and microwave-assisted extraction (MAE) (19–21) have been reported for isoflavone extraction from botanical materials. The common solvents for the extraction of isoflavones are aqueous solutions containing a high percentage of organic solvents (50 % to 90 %, v/v), including methanol, ethanol, acetonitrile, and/or acetone. Additives, such as acids, have also been used to accelerate extraction and inhibit precipitation (22). Extraction times vary from 30 min to 24 h, and temperatures used range from 4 °C to 80 °C. Most of these methods do not achieve full extraction of target analytes, and so the combination of several methods is common (10, 13, 21). A review of the literature shows that laboratories employ some combination of sonication and/or agitation with centrifugation, filtration, and/or dilution steps following the initial chemical extraction due to ease and availability of the procedures (13). Other steps, such as preconcentration, hydrolysis, and/or filtration, may also be necessary depending on the composition of the resulting extract and the stability of extracted compounds (23–25).
The final steps, essential for achieving accurate quantitation, are the separation and detection of target compounds. The most widely used analytical technique for the characterization of isoflavones is reversed phase (RP) LC in combination with absorbance detection (26–28), due to its simplicity, general sensitivity, stability, and relatively low instrumentation costs. This method is highly efficient and reproducible, however, the use of absorbance detection has limitations related to a general lack of analyte specificity in the detection step. Isoflavones generally absorb UV light optimally in the wavelength range of 250 nm to 270 nm, coincident with other compound classes commonly seen in botanical materials. Species-specific spikes of suspected components aids in the identification of eluting compounds as they yield increased absorbance values for the coincident peak in the analytical chromatogram. Alternatively, reports have described the use of LC coupled with electrospray ionization mass spectrometry (ESI-MS) to provide more specific identification of the isoflavones (29–31). The approach described here involves use of LC in tandem with electron ionization (EI) MS to fully separate the analytes and provide single-charged molecular ions with an appreciable amount of predictable fragmentation. The major challenge of coupling LC with EIMS is that LC solvents/vapors must be removed before the analytes arrive in the ionization chamber. Marcus et al. have employed a particle beam (PB) interface to remove solvents between LC and the low-pressure environment of an EI source for the analysis of botanical products and for metal speciation studies (32–36). The PB has two major components (Figure 1): a thermoconcentric nebulizer and a two-stage momentum separator. The function of each component is described in the Experimental Section.
Figure 1.
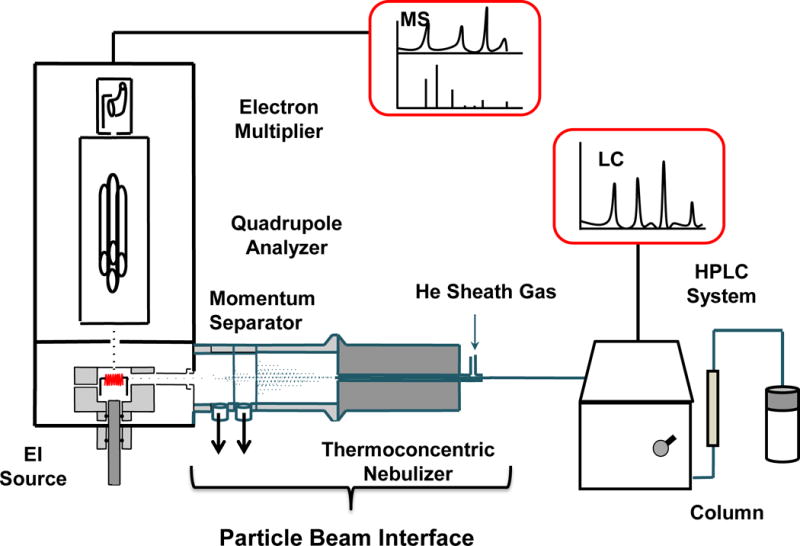
Diagrammatic representation of the LC-PB/EIMS system employed in these studies.
The work presented demonstrates the development of a method using the PB interface to couple LC to the EIMS for the determination of the isoflavone content in NIST SRM 3238 Soy-Containing Solid Oral Dosage Form. Use of conventional, 70 eV electron acceleration yields mass spectra that often contain the molecular ion as well as structurally significant fragmentation patterns (37). As such, the method provides high selectivity for compound identification. Five target isoflavones (daidzein, genistein, genistin, daidzin, and glycitin) were characterized using LC-PB/EIMS, with the quantitative results compared with the values from the NIST Certificate of Analysis. (A sixth isoflavone, glycitein, is also included in the NIST assay, but at the time of these studies, commercially available reagents were of insufficient purity and prohibitively expensive, and so glycitein was not included in the quantitative evaluation.) In this study, a chemically similar, but non-isoflavone compound, 7-hydroxy-4-chromone is employed as the internal standard (IS) (34). Studies that use IS quantitation select either an isoflavone compound not believed to be present in the specific matrix (for absorbance detection) or stable isotope labeled (e.g., deuterium, 13C) isoflavone compounds for each analyte of interest (for MS detection). As shown in Figure 2, the chemical structure of 7-hydroxy-4-chromone is in fact similar to the base structure of all of the target isoflavones, leading to similar behavior in the absorbance and MS ionization modes. The general strategy employed here provides a very useful alternative for botanical product characterization in terms of the simplicity of the extraction, use of the simple IS compound, and the use of EIMS as a detection tool.
Figure 2.
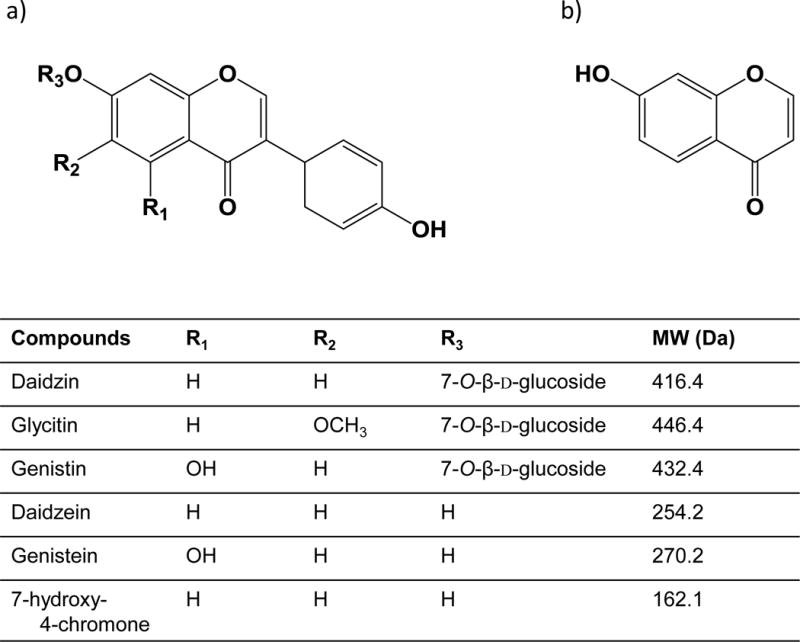
Chemical structure of a) target isoflavones, and b) 7-hydroxy-4-chromone (IS) used in this study.
Experimental1
A. Reagents
Water-High purity, deionized using a NANOpure Diamond water system (18.2 MΩ-cm, Barnstead International, Dubuque, IA).
Methanol (MeOH)- HPLC grade. (Merck KGaA, Darmstadt, Germany).
Acetic acid- 70 % HPLC grade. (ThermoFisher Scientific Inc., Waltham, MA).
Dimethylsulfoxide (DMSO)- > 99.9 % purity (Sigma-Aldrich, St. Louis, MO).
Reference Standards- soy isoflavone glycosides: daidzin, glycitin, genistin (BIOTANG Inc., Lexington, MA); aglycones: daidzein, genistein (BIOTANG Inc.); and the internal standard (IS) 7-hydroxy-4-chromone (Sigma-Aldrich). The purity of each compound as stated in Certificate of Analysis was used for purity correction in the determination of the concentration of the calibrant solutions.
B. Solutions
Dilution solvent- 30:70 (v:v) methanol:water. Also used as syringe wash.
Extraction solvent- 74.5:20:5.5 (v:v:v) methanol:water:DMSO.
IS stock solution- 2 mg/mL in 80:20 (v:v) methanol:water. Weigh (PerkinElmer AD-6 autobalance) 3 mg of 7-hydroxy-4-chromone, then add 15 mL pre-mixed 80:20 (v:v) methanol:water to dissolve. Solution was determined to be stable for at least 6 months when stored in a-20 °C freezer.
Stock solution containing isoflavone standards-Accurately weigh the following into individual 10 mL volumetric flasks: 1.7 mg daidzin, 1.0 mg glycitin, 0.7 mg daidzein, 1.7 mg genistin, and 0.6 mg genistein. Dilute to volume using pre-mixed extraction solution. LC stock standard solutions were stored in the refrigerator (5 °C) prior to use.
C. Extraction method
Approximately 0.4 g of as-received sample was weighed, spiked with ~0.4 g of IS solution, and then extracted at room temperature for 4 h in 6 g of the extraction solvent in a 15 mL polypropylene centrifuge tube, with agitation provided by a homemade rotary mixer adapted from a commercially available rotovap setup (Buchi rotavapor R-144, Buchi Corp., New Castle, DE). Use of methanol here, versus the more commonly employed acetonitrile, was done to provide another degree of orthogonality versus the NIST methodology. The samples were then centrifuged (VWR, West Chester, PA) for 30 min at speed of 4000 RPM (1914 x g centrifugal force) to remove any insoluble materials, and the supernatant was removed, filtered (0.45 μm PTFE syringe filter; VWR), and stored at 5 °C. Sample solutions were diluted for LC separation and absorbance detection.
D. Instrumentation
Waters Corp. (Milford, MA) Model Series 1500 liquid chromatograph, with a binary gradient pump, gradient mixer, and a 20 μL injection loop. A C18 column (Altima™, 250 × 4.6 mm, 5 μm particles, Alltech, Columbia, MD) was used to separate the components of the sample. Helium sparging was used for solvent degassing. Mobile phase A was water and mobile phase B was methanol, both containing 0.1 % (v/v) acetic acid. The gradient program was set in three segments; 1) linear increase from 30 % to 50 % B over 10 min at flow rate of 1.2 mL/min, 2) increase to 60 % B over 15 min at a flow rate of 1.2 mL/min, and 3) increase to 90 % B over 15 min at flow rate of 1.1 mL/min. (The lower flow rates at high organic solvent percentages is necessary to prolong the lifetime of the roughing pumps of the momentum separator.) A Waters 2487 Dual Absorbance detector was used for absorbance detection at 254 nm. Data acquisition and analysis were performed using Waters Empower 2 software.
The LC system was coupled to an Extrel (Pittsburgh, PA) Benchmark quadrupole mass spectrometer system using a particle beam interface. As shown in Figure 1, the PB interface (containing a thermoconcentric nebulizer and momentum separator) connects the LC and the MS detector in order to transform the liquid sample into dry analyte particles. The thermoconcentric nebulizer was heated to ≈85 °C and helium was used to nebulize the solution into small droplets. The wet droplets then evaporate and form dry particles in the heated desolvation chamber (≈100 °C). As the particle/gas mixture passes through the momentum separator, analyte enrichment and solvent vapor removal occur simultaneously in two stages of differential pumping. The low mass solvent molecules are pumped away because of their low momenta, while the heavier analyte-containing particles maintain their trajectory and pass through the orifices. Differential pumping not only permits solvent vapor removal but also creates pressure reduction to match the vacuum requirements of the ionization source. The resultant beam of dry analyte particles then enters the heated EI source for subsequent vaporization and ionization. The MS system was controlled by an Extrel Merlin Automation Data System (Extrel CMS, Pittsburgh, PA). The MS system scanned masses from 100 Da to 700 Da at a rate of 1 s/scan for the collection of the total ion chromatogram (TIC), from which the mass chromatograms of the target species and their mass spectra were extracted.
Results and Discussion
The method development and validation occurred in successive steps. In the first stage, the chromatographic separation was optimized and the unique mass spectrometric signatures determined for the abundant isoflavones present in soy products. Of interest here were the aglycones daidzein and genistein, as well as the glycosides daidzin, genistin, and glycitin. The second step was the development of an efficient extraction procedure for the isoflavones in the finished product. The third step was to refine the method of quantification and compare the results with the certified and reference values from the NIST Certificate of Analysis. Calibration solutions composed of the pure isoflavones and the IS were used to determine response factors for absorbance and MS detection.
A. Separation of Soy Isoflavones and Compound Identification
Previous studies in this laboratory demonstrated chromatographic separation and quantitation of a mixture of five-isoflavones containing puerarin, daidzein, genistein, formononetin, and biochanin A (34). This solution was developed to represent the isoflavone content of several types of botanical materials, including soy, red clover, and kudzu. The separation conditions in those studies were determined to be a water and methanol gradient (30 % to 90 % (v/v) methanol containing 0.1 % trifluoroacetic acid (TFA) over 40 min at a flow rate of 1 mL/min) using a C18 column. These conditions were used as the starting point for the separation of the present soy isoflavone suite. Using absorbance detection at 254 nm for initial monitoring, the previously developed method did not adequately separate all the components of the soy isoflavone suite. Therefore, the gradient program variables were changed until an adequate-quality separation was achieved to with near baseline resolution of all eluent peaks.
Interpretation of EI mass spectra, for library comparisons or identification of unknowns if needed, is facilitated by the present method, which is advantageous when analyzing complex botanical materials. Prior to the study of the complex herbal finished product material, neat solutions of single isoflavones were analyzed using LC-PB/EIMS, using the selected ion monitoring (SIM) chromatograms and resulting mass spectra to validate retention time assignments, mass spectral characteristics, and chromatographic resolution of each component. A separation of the calibration solution containing daidzin, glycitin, genistin, daidzein, genistein, and 7-hydroxy-4-chromone (IS) with absorbance detection is illustrated in Figure 3. (The equivalent separation of the SRM extract clearly exhibits a peak attributable to glycitein, eluting between daidzein and genistein. Its identity is readily confirmed in the corresponding PB/EIMS spectra.) Such an overlap may impose a burden toward MS quantification, introducing effects of cross interferences, ion enhancement, or ion suppression. Peak identification is based on their mass spectral features at the individual retention times as shown in Figure 4. The molecular ion (M+●) is the base peak in the mass spectra for 7-hydroxy-4-chromone, daidzein, and genistein, but not so for daidzin, glycitin, and genistin. Under EI conditions, the isoflavone glycosides fragment under the EI conditions, and the spectra obtained reflect where the fragmentation occurs; specifically, the loss of the 7-O-β-D-glucoside moiety (m/z = 163 Da). Using the spectra presented in Figure 4, base peaks were selected for daidzin (m/z 253), glycitin (m/z 283), genistin (m/z 269), daidzein (m/z 254), genistein (m/z 270), and 7-hydroxy-4-chromone (m/z 162). In the cases of daidzin, glycitin, and genistin, the glycoside moiety is likely lost in postionization degradation, resulting in highest abundance from the base aglycone fragments. Quantitation was based on integration of peaks present in the extracted ion chromatograms for each isoflavone (recorded ± 1 Da) (Figure 5).
Figure 3.
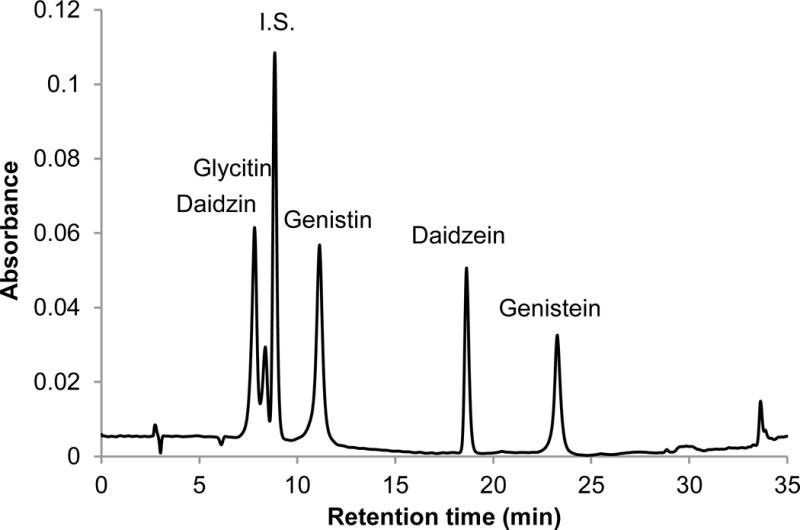
UV absorbance chromatogram obtained at 254 nm for the calibration solution containing the suite of target isoflavones and internal standard. Isoflavone standard solution separation using a C18 column and linear gradient 30 % to 50 % B over 10 min at flow rate of 1.2 mL/min, increased to 60 % B over 15 min at a flow rate of 1.2 mL/min, and to 90 % B over 15 min at flow rate of 1.1 mL/min, mobile phase A (Milli-Q water containing 0.1 % (v/v) acetic acid), and B (MeOH containing 0.1 % (v/v) acetic acid).
Figure 4.
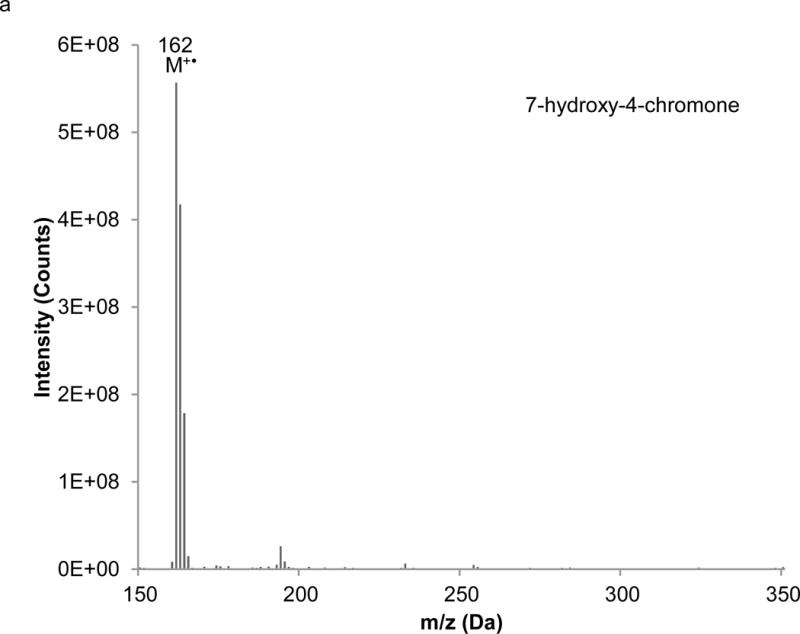
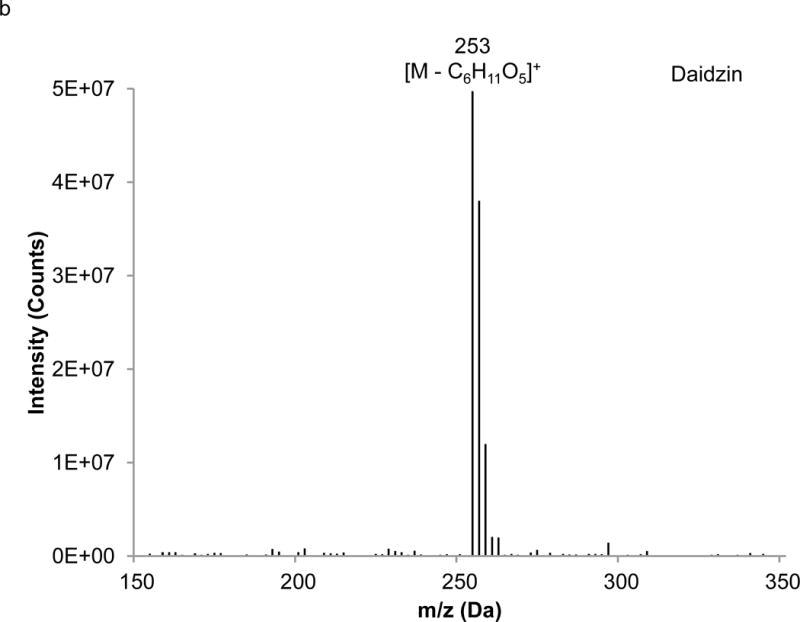
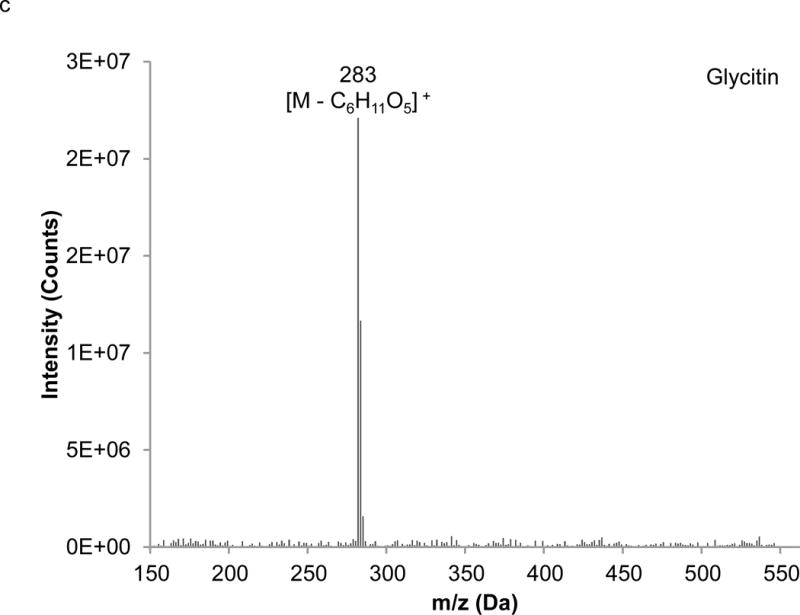
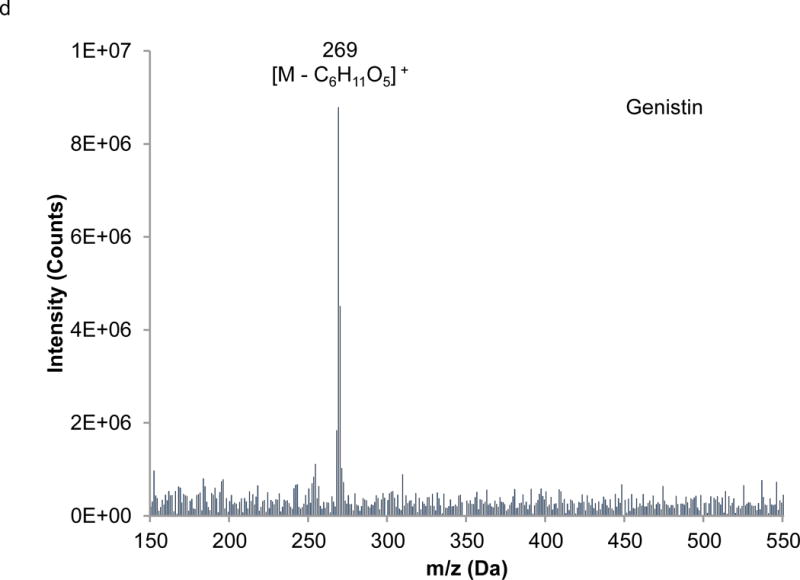
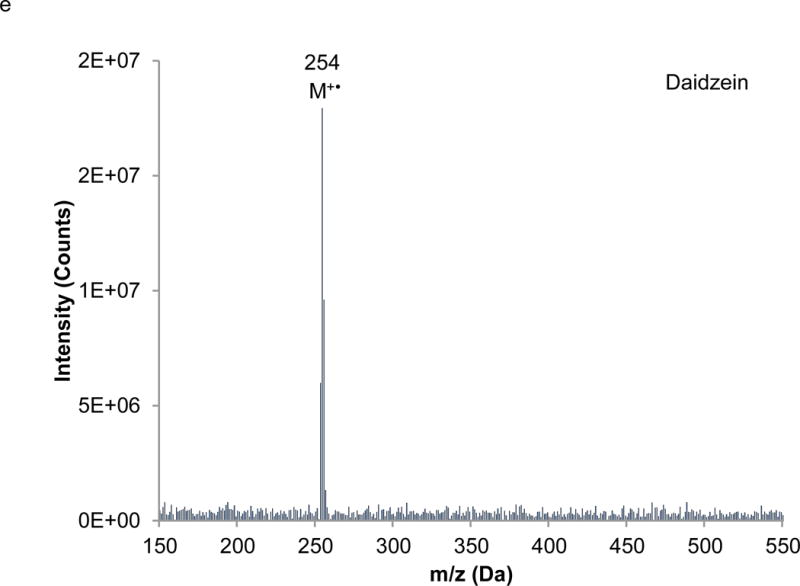
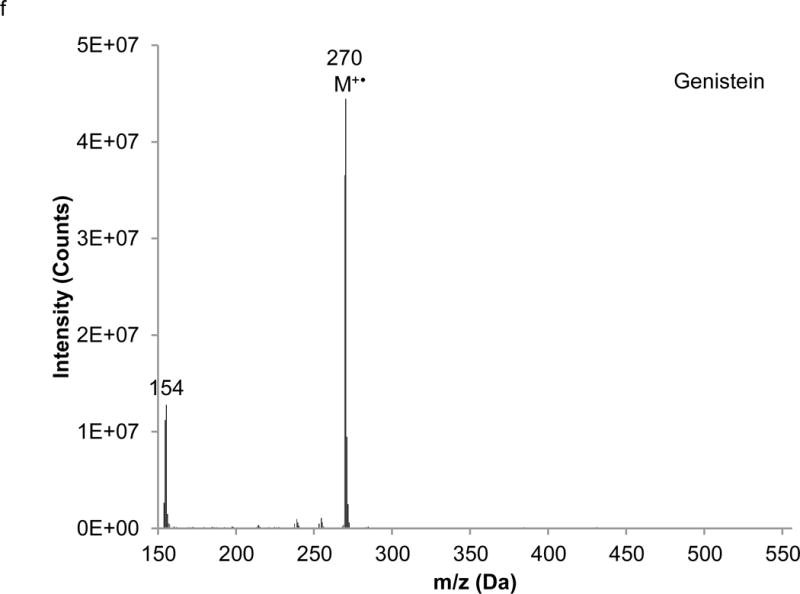
Extracted mass spectra derived from the elution of the internal standard and isoflavones in the chromatogram depicted in Figure 3: a) 7-hydroxy-4-chromone (IS), b) daidzin, c) glycitin, d) genistin, e) daidzein, f) genistein.
Figure 5.
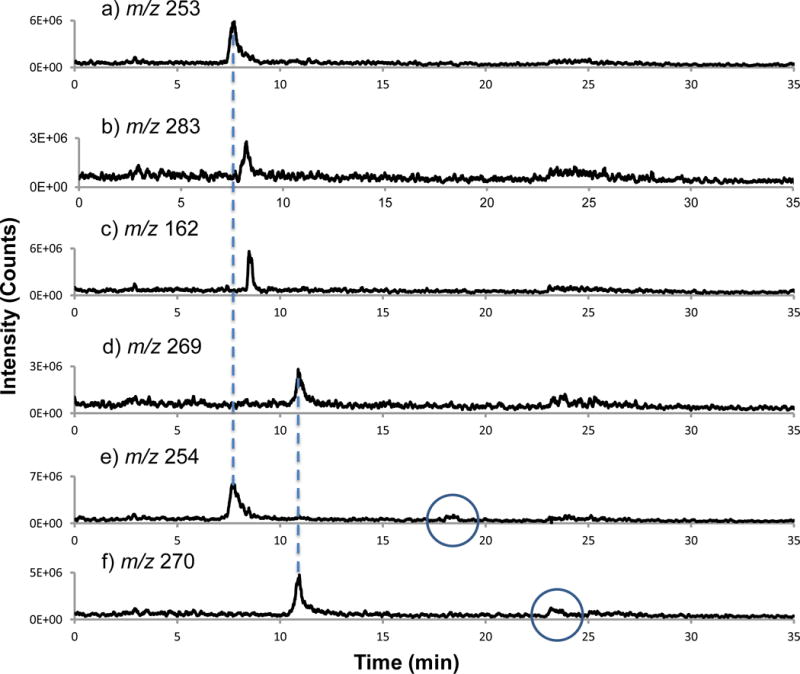
Selected ion chromatograms of the target isoflavones and internal standard: a) daidzin, b) glycitin, c) IS, d) genistin, e) daidzein, and f) genistein. In the case of e and f, the circled peak corresponds to the elution of the target analyte.
B. Extraction of Soy Isoflavones
A complete and accurate analysis of the active components in botanical materials is a non-trivial process that is affected by a number of factors, especially during the extraction and storage processes. Solvent composition and extraction times can affect significantly the extraction efficiency and relative yields of the individual compounds. Hydrolysis steps are often employed in isoflavone assays to cleave the acetyl and malonyl moieties on the glycoside and aglycone structures, thus reducing the chromatographic complexity (12, 38–40). The methodology used at NIST for characterizing SRM 3238 employs hydrolysis as a means of simplifying the analysis and to better meet the needs of the dietary supplement community (41). The method of extraction used here is a 74.5:20.0:5.5 (v:v:v) MeOH:H2O:DMSO solvent and 4 h rotary mixing at room temperature, which was developed based on the target isoflavones in SRM 3238. Methanol has been reported to yield higher recoveries for daidzin, glycitin, genistin, and genistein than acetonitrile and ethanol (13), and the DMSO additive improves the overall recoveries. Rotary mixing is a gentle method in comparison to shaking, being more comparable to stirring, which is one of the commonly used extraction techniques for isoflavones. An overt hydrolysis step was not employed, as EIMS detection was expected to yield unambiguous spectra from complex samples, including the various isoflavone glycoforms. However, the results suggest that acetyl and malonyl forms that may have been present in the extracts are ultimately reduced to the base glycosides in the course of the present method. In addition, the extract is simply centrifuged and the supernatant transferred for storage without a sonication step, which reduces the number of sample handling steps and chemical modifications required, and in turn reduces the potential for sample degradation, contamination, or loss.
C. Method of Quantitation
Once a suitable separation had been achieved, sample extract solutions were evaluated (n = 3) using both LC-UV and LC-PB/EIMS. The internal standard compound, 7-hydroxy-4-chromone, was added to each test solution. The specific attributes of this IS compound include: 1) structural similarity to each of the target isoflavones (same base molecule without the presence of the phenyl group on the pyrone ring), 2) very similar absorbance characteristics including spectral structure and molar absorptivity at 254 nm, 3) relatively high mass spectrometric responses with very little fragmentation (minimizing potential fragmentation variability), 4) commercial availability of the product in high purity and low cost, and 5) high chemical and thermal stability.
Levels of isoflavones in SRM 3238 are listed in Table 1 for both the absorbance and MS detection methods. An internal standard approach to quantitation was used. Because genistin and daidzin are much higher in concentration in comparison to the other isoflavones in the SRM, a 10-fold dilution prior to analysis was needed to obtain acceptable linearity. Unfortunately, the concentrations of genistein and daidzein in the diluted solution were below the limit of quantification for PB/EI-MS analysis, thus the original extract was used for PB/EI-MS analysis and then diluted for subsequent absorbance detection. Degraded limits of detection versus other LC-MS (e.g., APCI) are due to the complex series of vaporization, desolvation, and particle transport processes of the particle beam interface, which are necessary to achieve the low ion source pressures required for electron ionization (37, 42). The SIM traces for the base peak produced by each isoflavone (identified in Figure 4) were used for peak area determinations as demonstrated in Figure 5. Note that in the SIM chromatograms for daidzein (e) and genistein (f), two peaks are observed. In both cases, the first peak in the chromatogram corresponds to another isoflavone present in the mixture as designated by the dashed lines; the 254 Da related to daidzin (a) and 270 Da associated with genistin (d). The second peak in each chromatogram (circled), associated with daidzein and genistein, respectively, was used for the quantification.
Table 1.
Comparison of quantitative results for the analysis of SRM 3238 based on developed extraction and chromatography methods, using absorbance and PB/EI-MS detection.
| LC-UV Determinations | |||||
|---|---|---|---|---|---|
| Daidzin | Glycitin | Genistin | Daidzein | Genistein | |
| Mass Fraction (mg/g) | 13.793 | 3.581 | 12.896 | 0.559 | 0.123 |
|
SD (n=3)1 |
0.0453 | 0.0079 | 0.0332 | 0.0015 | 0.0016 |
| CV | 0.0033 | 0.0022 | 0.0026 | 0.0027 | 0.0129 |
| LC-MS Determinations | |||||
|---|---|---|---|---|---|
| Daidzin | Glycitin | Genistin | Daidzein | Genistein | |
| Mass Fraction (mg/g) | 14.012 | 3.913 | 12.684 | 0.310 | 0.104 |
|
SD (n=3)1 |
0.1440 | 0.0319 | 0.1290 | 0.0693 | 0.0840 |
| CV | 0.0103 | 0.0082 | 0.0102 | 0.2234 | 0.8073 |
triplicate injections for a single extraction
As seen in Table 1, both detection methods provide excellent precision as expressed in the coefficients of variation (CV) for daidzin, genistin, and glycitin. In this case, the CVs refer to triplicate injections of the same extract, as the focus here was on the characterization of the instrumental method. The PB/EI-MS determinations have much higher CV values compared to those determined by absorbance detection for daidzein and genistein. The greater variability for these two compounds via MS detection is likely a result of the concentration of daidzein and genistein being much lower than the other isoflavones. Indeed their concentrations are only a factor of three above the LOQs calculated using the previously computed LODs for those compounds based on single-component injections (34). The absolute values presented in Table 1 for the respective compounds determined by absorbance and MS detection are in rather good agreement; except for daidzein. In this case, the absorbance-derived concentration is almost a factor of two higher than the MS value. The difference here is attributed to the co-elution of a UV-absorbing compound that does not contribute to the SIM signal at 254 Da, which is possible due to the complexity of the botanical extract versus the isoflavone standard solutions from which the separation method was developed. Confirmation of this is seen in the extracted mass spectrum taken from the daidzein retention time, shown in Figure 6 where the starred peaks confirm the presence of a co-eluting compound, which has appreciable absorbance at 254 nm. Collisional activation of these ion species (MS/MS) would be valuable in identifying the co-eluting compound(s).
Figure 6.
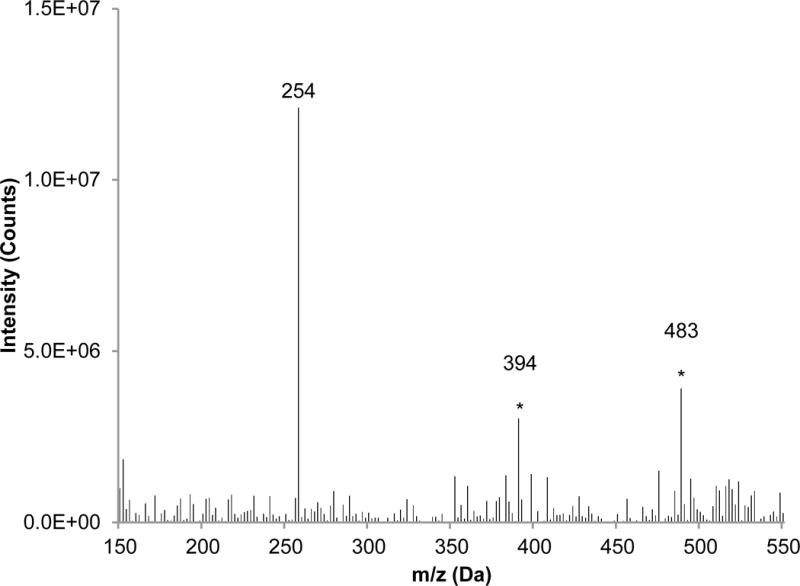
Extracted mass spectrum of the HPLC effluent at retention times of 18.7 min to 19.1 min., corresponding to the elution of daidzein. * label denotes peaks not seen for neat daidzein injection (Figure 4e).
A comparison between the NIST-assigned values in SRM 3238 and those obtained by PB/EI-MS in Table 2 provides insight into strengths and weaknesses of the LC-PB/EI-MS method. The certified and reference mass fractions provided by NIST for each isoflavone are the mean from the combination of the means of LC/absorbance and ID-LC/MS methods developed at NIST. The uncertainty provided for those values is an expanded uncertainty about the mean to cover the measured value with approximately 95 % confidence. The concentrations determined in this laboratory using PB/EI-MS match the NIST assigned values to within 5 % absolute difference, with the exception of daidzein. The measured values for all of the isoflavones are within the expanded uncertainty range.
Table 2.
Comparison of quantitative results for the analysis of SRM 3238 based on developed extraction and chromatography methods using PB/EI-MS detection and those of the NIST certification.
| PB/EI-MS detection (mg/kg) | NIST-determined mass fraction (mg/kg) | Absolute percentage difference (%) | |
|---|---|---|---|
| Daidzin | 14012 ± 144 | 13400 ± 2400(1) | 4.57 |
| Glycitin | 3913 ± 32 | 3760 ± 180(2) | 4.07 |
| Genistin | 12684 ± 129 | 12700 ± 530(2) | 0.13 |
| Daidzein | 310 ± 69 | 241 ± 5(2) | 28.63 |
| Genistein | 104 ± 84 | 108 ± 10(2) | 3.70 |
Reference value
Certified value
The analysis performed at NIST involved a basic hydrolysis step, which breaks the ester bond of the malonyl and acetyl groups esterified to the alcoholic function of the sugar moieties of isoflavones. The hydrolysis step reduces the chemical complexity and allows the determination of the total of the glycosides and free aglycones. The fact that the mass fractions of daidzin, glycitin and genistin determined in this laboratory agree with the NIST certified mass fractions suggests that, even without the discrete hydrolysis step, the glycoside mass fractions obtained in this laboratory represents the total glycoside contents. In practice, there are two reasons that could lead to this result for the present method. First, hydrolysis could happen in the course of the present extraction step, converting the malonyl and acetyl derivatives into their stable glycoside forms. While the extraction takes place without acid or base addition, 4 h of processing at room temperature and in mixed solvent may cause hydrolysis of the malonyl and acetyl forms, leaving the total glycosides present in the respective chromatographic fractions. No evidence of malonyl or acetyl species was observed in any of the extracted mass spectra. Alternatively, native malonyl and acetyl forms could have been hydrolyzed in the course of the manufacture of the dietary supplement matrix SRM. If this were occurring, the two extraction methods would indeed yield the same results; the quantification of the total glycosides.
Conclusions
Presented here is a method for the determination of isoflavone content in soy materials. The LC-PB/EIMS method developed here provides orthogonality in terms of the extraction procedure, chromatography protocol, and detection methodology to those used at NIST in the certification of SRM 3238. The LC-PB/EIMS approach provides accurate and precise measurements for the determination of the target isoflavones as well as providing simultaneous structural information. Structural information is a valuable asset, especially in the case of diagnosing the occurrence and potentially identifying co-eluting compounds. Such capabilities would clearly be advantageous in the case of characterizing natural products of ill-defined composition. The optimized method of analysis can be used in future work, such as quantifying the isoflavone content in other SRMs, or as a highly versatile tool for the characterization of herbal products in general (32–34, 36). In comparison to the use of ESI-MS following LC separation, the current method affords the ability to use MS databases and simple EI-type fragmentation rules to identify unknowns. In addition, the method places fewer constraints on the LC mobile phase as it is removed prior to the ionization event. Quantitative points of comparison including sensitivity, linearity, reproducibility, etc. will the focus of future studies.
Acknowledgments
This work was financially supported by the National Institute for Standards and Technology under grant # 1169208 to Clemson University. LXZ would also like to thank Drs. Benjamin T. Manard and Joaudimir Castro for their help throughout the duration of this project.
Footnotes
Certain commercial equipment, instruments, or material are identified in this report to specify adequately the experimental procedure. Such identification does not imply recommendation of endorsement by the National Institute of Standards and Technology, nor does it imply that the materials or equipment identified are necessarily the best available for the purpose.
References
- 1.Xiao CW. J Nutr. 2008;138:1244S–1249S. doi: 10.1093/jn/138.6.1244S. [DOI] [PubMed] [Google Scholar]
- 2.Isanga J, Zhang GN. Food Rev Int. 2008;24:252–276. [Google Scholar]
- 3.Andres S, Abraham K, Appel KE, Lampen A. Crit Rev Toxicol. 2011;41:463–506. doi: 10.3109/10408444.2010.541900. [DOI] [PubMed] [Google Scholar]
- 4.Nielsen IL, Williamson G. Nutr Cancer. 2007;57:1–10. doi: 10.1080/01635580701267677. [DOI] [PubMed] [Google Scholar]
- 5.Dewell A, Hollenbeck PL, Hollenbeck CB. J Clin Endocrinol Metab. 2006;91:772–80. doi: 10.1210/jc.2004-2350. [DOI] [PubMed] [Google Scholar]
- 6.Sacks FM, Lichtenstein A, Van Horn L, Harris W, Kris-Etherton P, Winston M. Circulation. 2006;113:1034–1044. doi: 10.1161/CIRCULATIONAHA.106.171052. [DOI] [PubMed] [Google Scholar]
- 7.Lindstrom A, Ooyen C, Lynch ME, Blumenthal M, Kawa K. HerbalGram. 2014:52–56. [Google Scholar]
- 8.Klein MA, Nahin RL, Messina MJ, Rader JI, Thompson LU, Badger TM, Dwyer JT, Kim YS, Pontzer CH, Starke-Reed PE, Weaver CM. The Journal of nutrition. 2010;140:1192S–1204S. doi: 10.3945/jn.110.121830. [DOI] [PMC free article] [PubMed] [Google Scholar]
- 9.Vacek J, Klejdus B, Lojkova L, Kuban V. J Sep Sci. 2008;31:2054–67. doi: 10.1002/jssc.200700569. [DOI] [PubMed] [Google Scholar]
- 10.Achouri A, Boye JI, Belanger D. Food Res Int. 2005;38:1199–1204. [Google Scholar]
- 11.Wu Y, Wang X, Fan E. Phytochem Anal. 2012;23:513–519. doi: 10.1002/pca.2349. [DOI] [PubMed] [Google Scholar]
- 12.Rostagno MA, Villares A, Guillamon E, Garcia-Lafuente A, Martinez JA. J Chromatogr A. 2009;1216:2–29. doi: 10.1016/j.chroma.2008.11.035. [DOI] [PubMed] [Google Scholar]
- 13.Luthria DL, Biswas R, Natarajan S. Food Chem. 2007;105:325–333. [Google Scholar]
- 14.Rostagno MA, Palma M, Barroso CG. Anal Chim Acta. 2004;522:169–177. [Google Scholar]
- 15.Zgorka G. J AOAC Int. 2011;94:22–31. [PubMed] [Google Scholar]
- 16.Klejdus B, Lojkova L, Lapcik O, Koblovska R, Moravcova J, Kuban V. J Sep Sci. 2005;28:1334–1346. doi: 10.1002/jssc.200500102. [DOI] [PubMed] [Google Scholar]
- 17.Klejdus B, Lojkova L, Plaza M, Snoblova M, Sterbova D. J Chromatogr A. 2010;1217:7956–7965. doi: 10.1016/j.chroma.2010.07.020. [DOI] [PubMed] [Google Scholar]
- 18.Sheng G, Zhou Q. Supercritical Fluid Extraction of Genistein from Extruded Soybean. In: Chu MJ, Xu HH, Jia Z, Fan Y, Xu JP, editors. Sustainable Environment and Transportation. 178–181. Trans Tech Publications Inc; 2012. pp. 838–842. [Google Scholar]
- 19.Rostagno MA, Palma M, Barroso CG. Anal Chim Acta. 2007;588:274–282. doi: 10.1016/j.aca.2007.02.010. [DOI] [PubMed] [Google Scholar]
- 20.Gong SZ, Cheng J, Yang ZR. Chin J Chem Eng. 2005;13:556–559. [Google Scholar]
- 21.Zeng J, Jiang B, Xiao Z, Li S. Pressurized microwave-assisted extraction of isoflavones from soy. In: Zhang H, Jin D, editors. Advanced Research on Material Engineering, Architectural Engineering and Informatization. Vol. 366. 2012. pp. 486–489. [Google Scholar]
- 22.Preedy VR, editor. Isoflavones: Chemistry, Analysis, Function and Effects. Royal Soc Chemistry, Thomas Graham House; Science Park, Cambridge Cb4 4wf, Cambs, Uk: 2013. Isoflavones: Chemistry, Analysis, Function and Effects. [Google Scholar]
- 23.Lee JH, Choung MG. Food Chem. 2011;129:577–582. doi: 10.1016/j.foodchem.2011.04.069. [DOI] [PubMed] [Google Scholar]
- 24.Cimino CO, Shelnutt SR, Ronis MJJ, Badger TM. Clinica Chimica Acta. 1999;287:69–82. doi: 10.1016/s0009-8981(99)00124-2. [DOI] [PubMed] [Google Scholar]
- 25.Konar N, Poyrazoglu ES, Demir K, Artik N. J Food Comp Anal. 2012;26:26–35. [Google Scholar]
- 26.Grynkiewicz G, Ksycinska H, Ramza J, Zagrodzka J. Acta Chromatogr. 2005;15:31–65. [Google Scholar]
- 27.Wang CC, Prasain JK, Barnes S. J Chromatogr B. 2002;777:3–28. doi: 10.1016/s1570-0232(02)00341-0. [DOI] [PubMed] [Google Scholar]
- 28.Wilkinson AP, Wahala K, Williamson G. J Chromatogr B. 2002;777:93–109. doi: 10.1016/s1570-0232(02)00095-8. [DOI] [PubMed] [Google Scholar]
- 29.Wu QL, Wang MF, Sciarappa WJ, Simon JE. J Agric Food Chem. 2004;52:2763–2769. doi: 10.1021/jf035053p. [DOI] [PubMed] [Google Scholar]
- 30.Singh SP, Wahajuddin Ali MM, Jain GK. J Sep Sci. 2010;33:3326–3334. doi: 10.1002/jssc.201000456. [DOI] [PubMed] [Google Scholar]
- 31.Borquez J, Kennelly EJ, Simirgiotis MJ. Food Res Int. 2013;52:288–297. [Google Scholar]
- 32.Castro J, Krishna MVM, Marcus RK. Am Lab. 2008;40:8–10. [Google Scholar]
- 33.Castro J, Krishna MVB, Choiniere JR, Marcus RK. Anal Bioanal Chem. 2010;397:1259–1271. doi: 10.1007/s00216-010-3612-0. [DOI] [PubMed] [Google Scholar]
- 34.Burdette CQ, Marcus RK. J AOAC Int. 2013;96:925–932. doi: 10.5740/jaoacint.12-431. [DOI] [PubMed] [Google Scholar]
- 35.Krishna MVB, Castro J, Brewer TM, Marcus RK. J Anal At Spectrom. 2007;22:283–291. [Google Scholar]
- 36.Krishna MVB, Castro J, Brewer TM, Marcus RK. J Anal At Spectrom. 2009;24:199–208. [Google Scholar]
- 37.Willoughby RC, Browner RF. Analytical Chemistry. 1984;56:2625–31. [Google Scholar]
- 38.Rostagno MA, Palma M, Barroso CG. Journal of Chromatography A. 2003;1012:119–128. doi: 10.1016/s0021-9673(03)01184-1. [DOI] [PubMed] [Google Scholar]
- 39.Richelle M, Pridmore-Merten S, Bodenstab S, Enslen M, Offord EA. J Nutr. 2002;132:2587–92. doi: 10.1093/jn/132.9.2587. [DOI] [PubMed] [Google Scholar]
- 40.Chiang WD, Shih CJ, Chu YH. Food Chemistry. 2001;72:499–503. [Google Scholar]
- 41.Technology, N. I. o. S., editor. Certificate of Analysis: Standard Reference Material 3238. NIST; Gaithersburg, MD: 2014. pp. 1–5. [Google Scholar]
- 42.Li YT, Koropchak JA. Instrumentation Science & Technology. 1998;26:389–407. [Google Scholar]


